4111 164th St SW #61 · North Lynnwood, WA
Flood risk No data
- FEMA flood zone
- —
- Chance of flooding over 30 yrs
- —
- Est. flood insurance / yr
- —
Fire risk No data
- Est. fire insurance / yr
- —
Heat risk No data
- Hot days now (above threshold)
- —
- Hot days in 30 yrs
- —
Wind risk No data
- Chance of severe wind over 30 yrs
- —
Air-quality risk No data
- Unhealthy air days now
- —
- Unhealthy air days in 30 yrs
- —
Risk factors via First Street. Map © Google.
Why this score? — see what drove the A- grade
The composite is a weighted blend of 9 inputs, each scored 0–100. Each bar is that input's sub-score; the figure is the points it added to the 100-point composite (weight × sub-score).
- Cash flow +30.0/30.0
- ARV discount +15.0/15.0
- 1% rule +10.0/10.0
- DSCR +10.0/10.0
- Schools +5.4/10.0
- Livability +4.5/5.0
- Rent growth +2.8/5.0
- Condition / age +2.5/5.0
- Appreciation +0.0/10.0
$79,995
🖨 Deal sheet 📄 Offer letter ✓ Due diligence
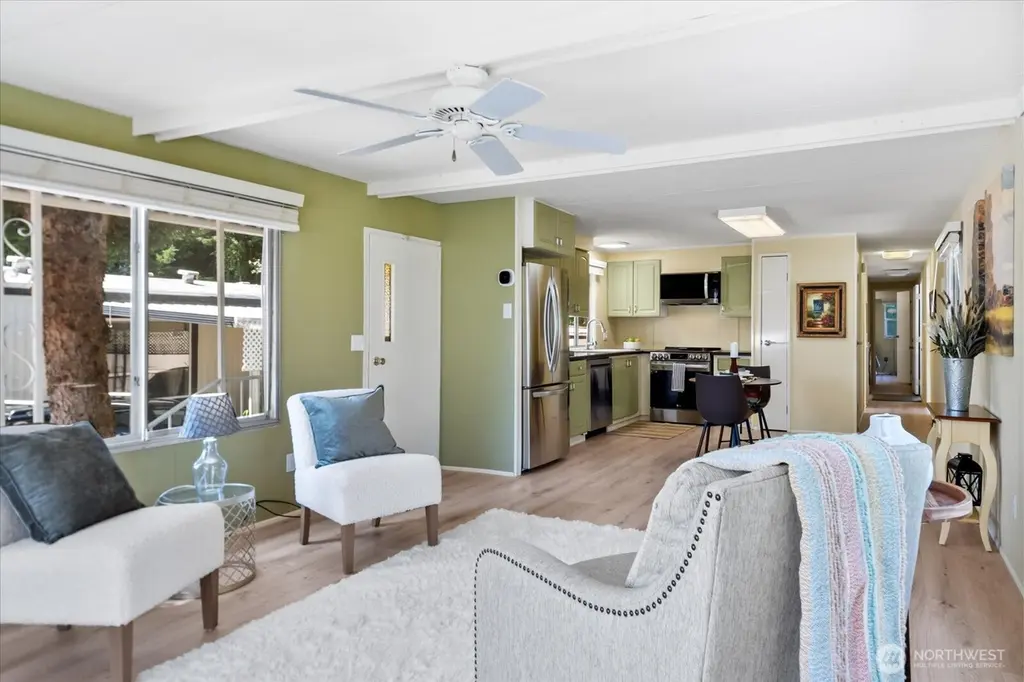
Listing remarks
55+ Community Welcome Home to Comfort & Community Living! Updated throughout, the bright kitchen offers all new appliances including garbage disposal. It opens to the living space making this home feel spacious. Relax in a newly tiled walk in shower with seat that offers a spa like feel off primary bedroom. New furnace and hot water tank gives peace of mind that this home is move in ready. Step outside to enjoy the outdoors on your private patio and small deck, or take advantage of the 8' x 10' lighted shed for additional storage. Tandem 2 car covered carport. Community is pet-friendly (dogs under 40 lbs. and cats allowed), plus RV parking and extra storage options available. Convenie
Key facts
- Bright kitchen
- Lighted shed
- Private patio
Tags
Neighborhood map
What this means for you Summary
Snapshot
- This is a 2-bed/1.0-bath manufactured listed at $80k.
Deal economics
- At list price, monthly cash flow is $1k ($15k/yr) — positive.
- The deal already cash-flows at list — no discount required.
- Meets the 1% rule at list price ($2k rent vs $80k).
- Recommended offer: $70k (12.0% below list) — sets the bar for market timing.
- Cap rate 25.6% vs local median 2.4% in North Lynnwood — top-decile yield for the area; either an underpriced asset or a hidden risk that comps aren't pricing in. Stress-test before assuming the spread holds.
Location & tenants
- Location reads 90/100 on livability (#6 in WA, #107 nationally) — a professional / high-income tenant draw. Strengths: schools A+, amenities A+, commute A+; Watch: cost of living F.
- Edmonds School District (suburban): math 54% / reading 65% proficiency, ranked #53 of 291 in WA (top 18%) — acceptable for families but not a draw, mixed tenant base, ~2y average lease.
- Market conditions: Rents rising (+1.2%/yr); 232 active listings in the ZIP; 40 comparable units currently listed for rent nearby; rentals leasing fast (median 3d on market — plan ~1-2 weeks tenant-placement turnaround); solid renter incomes; 3,982 units permitted in Snohomish County in 2024 (1,492 in 5+ unit buildings).
Forward outlook
- Local home prices are declining (-3.0%/yr); year-one equity from $553 of loan paydown is wiped out by about $2k of value loss. Plan a longer hold.
- Snohomish County population projected at +30% by 2050 — long-run rental-demand tailwind backs the buy-and-hold thesis.
- At projected returns (-3.0% appreciation + 1.2% rent growth), your $22k cash investment doubles in ~2 years — after that, you're playing with house money.
Negotiation context
- It's been on market 258 days — a 12% lower offer ($70k) is reasonable based on typical stale-listing flexibility.
- 3 sale attempts since 25y ago; this cycle's ask has dropped $50k (38%) from the opening price — seller is motivated, your offer sets the floor, not the list.
- Current owner paid $12k; list at $80k implies a 569% gain — meaningful room to come down on a strong offer.
Questions for the listing agent
- It's been on market 258 days. Have you received any prior offers? Is the seller open to a 12% concession, seller financing, or rate buy-down credit?
- Built in 1977 — when were the roof, HVAC, electrical panel, plumbing, and water heater last replaced?
- Why hasn't it sold? Are there any deal-killer items the seller is aware of (foundation, flood, title, zoning, code violations)?
- Is there a deadline driving the sale (1031 exchange, divorce, estate, relocation)? That informs how much negotiation room exists.
- Schools are A-rated — typically a magnet for longer-tenancy family renters. What's the average tenant stay here, and is there a school-zone premium baked into asking?
- What's the average days-on-market for RENTAL listings here right now (not sales)? A rising rental-DOM trend means longer vacancies and softer asking-rent achievability than the comps imply.
- What's the recent tenant-quality profile in this submarket — average credit score on applications, eviction rate, late-payment / NSF rate, and stable-employment percentage? A property-management company in the area should have these aggregated.
- How much new for-sale + rental construction is in the pipeline within 1–3 miles? Heavy new supply typically softens prices + rents 12–24 months out; constrained supply supports both.
Investment metrics
- 1% rule
- 2.80% ✓
- Cap rate
- 25.59%
- Cash-on-cash
- 68.93%
- DSCR
- 4.07
- GRM
- 3.0
CMA / ARV
- ARV (median comp)
- $104,429
- List price
- $79,995
- Delta
- -23.40%
- Verdict
- UNDERPRICED
- Comps
- 6 within 1.0 mi
Show comp detail 4 sales within ~0.75 mi
| Address | Dist | Beds/Ba | Sqft | Sold | Price | $/sf | Match |
|---|---|---|---|---|---|---|---|
| 4111 164th St SW #36 | 0.00mi | 2/1.0 | 924 (0%) | 4mo | $39,900 | $43 | 96 |
| 4111 164th St SW #16 | 0.00mi | 2/2.0 | 952 (+3%) | 0mo | $40,000 | $42 | 91 |
| 3832 164th St SW #10 | 0.27mi | 2/2.0 | 924 (0%) | 11mo | $113,556 | $123 | 74 |
| 3832 164th St SW Unit 9 | 0.27mi | 2/2.0 | 1,008 (+9%) | 8mo | $95,000 | $94 | 61 |
Match score weights: distance 35% · size 25% · config 20% · recency 20%. Top-matched comps best support the ARV.
Projected returns pro-forma
-3.0% appreciation · 1.22% rent growth · sell at horizon
- IRR
- 66.4%
- Equity multiple
- 3.90×
- Total profit
- $65,033
- Equity at exit
- $11,928
- IRR
- 70.1%
- Equity multiple
- 7.54×
- Total profit
- $146,497
- Equity at exit
- $6,917
Cash invested: $22,399 (down + closing). Projections, not guarantees.
Landlord ↔ Tenant lean methodology
- Overall (STATE)
- 28 Tenant-Leaning
- State Washington
- 28 Tenant-Leaning · D+8
- County
- — inherits STATE
- City
- — inherits STATE
ZIP-level market 98087
- Rents YoY
- 1.2%
- Active inventory
- 232
- Price-to-rent
- 3.0×
Monthly cashflow live
- Estimated rent
- $2,242 high interval (Pro) →
- Mortgage (P&I)
- −$420
- Tax from tax record
- −$32 /mo · $383/yr
- Insurance
- −$33
- HOA
- −$0
- Vacancy / Maint / Mgmt
- −$471
- Net cashflow
- $1,287
Break-even live
UW: 25.0% down · 7.5% · 30yr · 1.5% tax · 5.0% vac · 8.0% maint · 8.0% mgmt
Financing live
Cash to close
- Down payment
- $19,999
- Closing costs
- $2,400
- Reserves months
- —
- Total cash needed
- —
Loan-product check · same deal, 3 products live
Conventional
25% down · 7.5% · 30yr
- Down + closing
- —
- Monthly P&I
- —
- Monthly cashflow
- —
- DSCR
- —
- Eligible?
- —
Personal DTI + credit; lowest rate.
DSCR
20% down · 8.5% · 30yr
- Down + closing
- —
- Monthly P&I
- —
- Monthly cashflow
- —
- DSCR
- —
- Eligible?
- —
No personal income docs; deal must DSCR.
Hard money
10% down · 12.0% · 12mo
- Down + closing
- —
- Monthly P&I
- —
- Monthly cashflow
- —
- DSCR
- —
- Eligible?
- —
Short-term bridge; refi at stabilization.
Rent comps 40 comps
| Address | Beds | Baths | Sqft | Rent | $/sqft | DOM | Units | Dist |
|---|---|---|---|---|---|---|---|---|
| 4217 164th St SW Unit A204 Lynnwood, WA | 3.0 | 2.0 | 1100 | $2,450 | $2.23 | 43d | 1 | 0.11mi |
| 3805 164th St SW Lynnwood, WA | 1.0–2.0 | 1.0–2.0 | 843 | $2,295 | $2.72 | 1d | 5 | 0.20mi |
| 15914 44th Ave W Lynnwood, WA | 1.0–2.0 | 1.0–2.0 | 932 | $2,159 | $2.32 | 1d | 10 | 0.26mi |
| 3711 164th St SW Lynnwood, WA | 1.0–2.0 | 1.0–2.0 | 845 | $2,533 | $3.00 | 1d | 7 | 0.27mi |
| 2510 164th St SW Lynnwood, WA | 3.0 | 1.0–2.0 | 998 | $2,670 | $2.68 | 1d | 1 | 0.32mi |
| 15700 44th Ave W Lynnwood, WA | 1.0–3.0 | 1.0–2.0 | 940 | $1,979 | $2.11 | 2d | 1 | 0.33mi |
| 16419 Spruce Way Lynnwood, WA | 2.0 | 2.0 | 946 | $2,550 | $2.70 | 1d | 1 | 0.33mi |
| 16104 36th Ave W Lynnwood, WA | 1.0–2.0 | 1.0 | 761 | $2,099 | $2.76 | 2d | 6 | 0.33mi |
| 16419 Spruce Way Unit H4 Lynnwood, WA | 2.0 | 2.0 | 900 | $2,350 | $2.61 | 43d | 1 | 0.34mi |
| 4109 156th St SW Unit A3 Lynnwood, WA | 2.0 | 1.0 | 988 | $1,895 | $1.92 | 24d | 1 | 0.35mi |
| 4109 156th St SW Unit B4 Lynnwood, WA | 2.0 | 1.0 | 985 | $1,995 | $2.03 | 43d | 1 | 0.35mi |
| 3333 164th St SW Lynnwood, WA | 1.0–2.0 | 1.0–2.0 | 1048 | $2,518 | $2.40 | 2d | 20 | 0.39mi |
| 4525 164th St SW Lynnwood, WA | 2.0–3.0 | 1.0–2.0 | 1093 | $1,902 | $1.74 | 1d | 13 | 0.41mi |
| 15713 35th Ave W Lynnwood, WA | 2.0 | 1.0 | 940 | $2,000 | $2.13 | 24d | 1 | 0.47mi |
| 16200 Admiralty Way Lynnwood, WA | 2.0 | 1.0–2.0 | 783 | $3,019 | $3.86 | 1d | 33 | 0.57mi |
| 16003 Admiralty Way Lynnwood, WA | 1.0–4.0 | 1.0–2.0 | 1156 | $1,891 | $1.64 | 1d | 5 | 0.63mi |
| 16604 48th Ave W Lynnwood, WA | 1.0–3.0 | 1.0–2.0 | 890 | $2,162 | $2.43 | 2d | 9 | 0.63mi |
| 3116 164th St SW #2211 Lynnwood, WA | 2.0 | 1.5 | 1100 | $2,475 | $2.25 | 4d | 1 | 0.68mi |
| 16308 52nd Ave W Unit 4 Edmonds, WA | 2.0 | 1.0 | 900 | $1,795 | $1.99 | 10d | 1 | 0.72mi |
| 15001 35th Ave W Lynnwood, WA | 1.0–3.0 | 1.0–2.0 | 885 | $2,010 | $2.27 | 4d | 15 | 0.79mi |
| 17314 44th Ave W Unit C Lynnwood, WA | 2.0 | 1.5 | 1000 | $2,200 | $2.20 | 17d | 1 | 0.81mi |
| 3717 148th St SW Lynnwood, WA | 2.0 | 1.0–2.0 | 865 | $1,912 | $2.21 | 2d | 6 | 0.88mi |
| 4902 148th St SW Edmonds, WA | 1.0–2.0 | 1.0–2.0 | 801 | $2,221 | $2.77 | 1d | 10 | 0.90mi |
| 17529 44th Ave W Lynnwood, WA | 2.0 | 1.0 | 1000 | $2,395 | $2.40 | 3d | 1 | 0.96mi |
| 4410 176th St SW Lynnwood, WA | 1.0–2.0 | 1.0 | 770 | $1,850 | $2.40 | 4d | 3 | 1.00mi |
| 4432 176th St SW Unit 2 Lynnwood, WA | 2.0 | 2.0 | 1004 | $2,195 | $2.19 | 23d | 1 | 1.07mi |
| 4432 176th St SW Unit 3 Lynnwood, WA | 2.0 | 2.0 | 1004 | $2,195 | $2.19 | 43d | 1 | 1.07mi |
| 4428 176th St SW Unit 4 Lynnwood, WA | 2.0 | 2.0 | 1004 | $2,195 | $2.19 | 23d | 1 | 1.07mi |
| 4702 176th St SW Lynnwood, WA | 1.0–2.0 | 1.0 | 886 | $1,925 | $2.17 | 2d | 8 | 1.08mi |
| 4816 176th St SW Lynnwood, WA | 1.0–2.0 | 1.0–1.5 | 802 | $1,970 | $2.45 | 2d | 6 | 1.09mi |
| 4502 176th St SW Unit 2 Lynnwood, WA | 2.0 | 2.0 | 1004 | $2,195 | $2.19 | 43d | 1 | 1.11mi |
| 5419 172nd Pl SW Lynnwood, WA | 3.0 | 2.0 | 980 | $2,895 | $2.95 | 24d | 1 | 1.11mi |
| 17422 52nd Ave W Lynnwood, WA | 2.0 | 1.5 | 850 | $1,960 | $2.31 | 24d | 1 | 1.12mi |
| 17828 44th Ave W Unit 2 Lynnwood, WA | 2.0 | 2.0 | 750 | $2,100 | $2.80 | 43d | 1 | 1.14mi |
| 14611 Admiralty Way Lynnwood, WA | 1.0–3.0 | 1.0–2.0 | 1004 | $2,299 | $2.29 | 1d | 11 | 1.18mi |
| 14500 Admiralty Way Lynnwood, WA | 2.0 | 1.5 | 816 | $1,700 | $2.08 | 2d | 1 | 1.22mi |
| 16116 Ash Way Lynnwood, WA | 1.0–3.0 | 1.0–2.0 | 1000 | $2,420 | $2.42 | 2d | 9 | 1.34mi |
| 18031 36th Ave W Lynnwood, WA | 1.0–2.0 | 1.0–2.0 | 760 | $2,186 | $2.88 | 2d | 6 | 1.34mi |
| 16605 Ash Way Lynnwood, WA | 2.0 | 1.0–2.0 | 802 | $3,125 | $3.89 | 2d | 71 | 1.35mi |
| 18124 36th Ave W Lynnwood, WA | 1.0–2.0 | 1.0–2.0 | 821 | $2,155 | $2.62 | 2d | 8 | 1.36mi |
Listing history 21 events
-
2026-06-18days on market $79,995 Active 258 DOM
-
2026-06-17days on market $79,995 Active 257 DOM
-
2026-06-16days on market $79,995 Active 256 DOM
-
2026-06-15days on market $79,995 Active 255 DOM
-
2026-06-13days on market $79,995 Active 253 DOM
-
2026-06-13days on market $79,995 Active 252 DOM
-
2026-06-09days on market $79,995 Active 249 DOM
-
2026-06-08days on market $79,995 Active 248 DOM
-
2026-06-07days on market $79,995 Active 247 DOM
-
2026-06-04days on market $79,995 Active 244 DOM
-
2026-06-03days on market $79,995 Active 243 DOM
-
2026-06-02days on market $79,995 Active 242 DOM
-
2026-06-01days on market $79,995 Active 241 DOM
-
2026-05-31days on market $79,995 Active 240 DOM
-
2026-04-30price $79,995
-
2026-02-05price $99,990
-
2025-10-03$129,950 Active
-
2004-03-19soldstatus $11,950
-
2004-01-13$11,950
-
2001-09-25soldstatus $9,500
-
2001-09-07$9,900
ⓘ Source: listings_history table (triggers on properties + properties_extension) + one-shot
backfill from property_details.listing_events for pre-trigger history.
Tax reassessment forecast WA · Resets to sale price
- Current annual tax
- $383 · $32/mo
- Projected year-2 tax
- $784 · $65/mo
- Expected delta
- +$401/yr (+$33/mo · 104.5%)
ⓘ Screening estimate from a state-policy table — verify with the county assessor before closing.
Nearby sold comps map
Loading sold comps map…
Walkable amenities ~0.75 mi
Loading nearby amenities…
Taxation est. · year 1
- Rental income
- $26,909
- − Mortgage interest
- −$4,481
- − Property taxes
- −$383
- − Insurance
- −$400
- − Repairs & maintenance
- −$2,153
- − Management
- −$2,153
- − Depreciation
- −$2,327
- Taxable income
- $15,012
- Est. tax owed @ 24.0%
- −$3,603
- After-tax cash flow
- $11,838/yr
For passive investors: Depreciation is non-cash, so a rental often shows a tax loss while cash-flowing — sheltering income. Rental losses are passive: they offset passive income freely, and up to $25,000/yr can offset ordinary (W-2) income if you actively participate and your MAGI is under $100k (phasing out to $0 by $150k); unused losses carry forward. On sale, claimed depreciation is recaptured at up to 25%, and gains may owe capital-gains tax (a 1031 exchange can defer both). Figures are a year-1 estimate at your 24.0% rate — not tax advice; consult a CPA.
Schools (NCES district)
- District
- Edmonds School District
- NCES district ID
- 5302400
- Math proficiency
- 54% ▼ -1.00%
- Reading proficiency
- 65% ▬ 0.00%
- Median HH income
- $67,451
- Composite
- 53.94/100
- National rank
- #3026
- State rank
- #53 of 291 in WA
Livability — North Lynnwood
- Score
- 90/100
- State rank
- #6
- US rank
- #107
Category grades
Schools grade is shown separately in the Schools card above.
Census & demographics
- Census place
- North Lynnwood, WA
- County
- Snohomish County · 786,756 people
- City population
- 40,607
- Metro
- Seattle-Tacoma-Bellevue, WA
- Population (ZIP)
- 41,796
- Household income
- $106,693
- Rent vs Own
- Severe rent burden
- 2303.0
Population outlook (Snohomish County) Hauer SSP2
- Today (2025)
- 899,800 people
- By 2030
- 960,975 · +6.8%
- By 2040
- 1,074,447 · +19.4%
- By 2050
- 1,171,954 · +30.2%
- By 2075
- 1,384,849 · +53.9%
- By 2100
- 1,497,296 · +66.4%
Race, ethnicity, and origin ACS 2023
- Neighborhood character
- Highly diverse neighborhood (Simpson 0.71)
- Race & ethnicity
- White 48% Asian 20% Two or more races 13% Hispanic / Latino 12% Black 8% Pacific Islander 2%
- Hispanic origin (detail)
- Mexican 8%
- Common ancestry
- Portuguese 3% Slovak 3% Italian 3%
- Foreign-born
- 29% · Canada, South Korea, Vietnam
- Languages at home
- 64% English-only · Spanish 6% Russian/Polish/Slavic 5% Other Indo-European 5%
Political lean MEDSL · Snohomish
- 2024 margin
- D (+19.0) · D 57.8% · R 38.9% · Other 3.3%
- 2008→2024 swing
- +0.1pp no change · 2008: 18.9pp · 2024: 19.0pp
- All cycles
- 2024: D+19.0 2020: D+20.6 2016: D+16.6 2012: D+16.2 2008: D+18.9
Not yet ingested
- Civics
- —
Market trends
- HPI YoY
- ▼ -723.54%
- Current HPI
- 320.6888
- Rent YoY
- ▲ 1.22%
- Metro
- Seattle-Tacoma-Bellevue, WA
- State GDP YoY
- ▲ 4.65%
- F500 in state
- 22
Industry mix (Fortune 500 HQ in WA)
| Industry | F500 HQs | Revenue |
|---|---|---|
| Retail | 2 | $269B |
|
||
| Technology / Retail | 1 | $638B |
|
||
| Technology | 1 | $245B |
|
||
| Telecommunications | 1 | $38B |
|
||
| Food / Beverage | 1 | $36B |
|
||
| Automotive / Trucks | 1 | $34B |
|
||
Price history
+708.0% since first listed7 events — show timeline
- 2026-04-30 Price Changed $79,995 NWMLS as Distributed by MLS Grid
- 2026-02-05 Price Changed $99,990 NWMLS as Distributed by MLS Grid
- 2025-10-03 Listed $129,950 NWMLS as Distributed by MLS Grid
- 2004-03-19 Sold (MLS) $11,950 NWMLS as Distributed by MLS Grid
- 2004-01-13 Listed $11,950 NWMLS as Distributed by MLS Grid
- 2001-09-25 Sold (MLS) $9,500 NWMLS as Distributed by MLS Grid
- 2001-09-07 Listed $9,900 NWMLS as Distributed by MLS Grid
Property tax history
+9.0%/yrLatest (2026): $383 · +13.3% YoY. Source: county tax records.
Cash-flow waterfall
monthlySold comps — $/sqft
last 12 mo · ≤1 miLoading sold comps…