 🌊 Lakefront
4434 Wildwood Cir · DeCordova, TX
Flood risk 3/10 · Minor
- FEMA flood zone
- X (unshaded)
- Chance of flooding over 30 yrs
- 0.09%
- Est. flood insurance / yr
- $507 – $1,088
Fire risk 4/10 · Minor
- Est. fire insurance / yr
- $1,222 – $2,270
Heat risk 7/10 · Major
- Hot days now (above 109°F)
- 6 days/yr
- Hot days in 30 yrs
- 20 days/yr
Wind risk 6/10 · Moderate
- Chance of severe wind over 30 yrs
- 27.0%
Air-quality risk 2/10 · Minimal
- Unhealthy air days now
- 1 days/yr
- Unhealthy air days in 30 yrs
- 2 days/yr
Risk factors via First Street. Map © Google.
Why this score? — see what drove the D+ grade
The composite is a weighted blend of 9 inputs, each scored 0–100. Each bar is that input's sub-score; the figure is the points it added to the 100-point composite (weight × sub-score).
- ARV discount +15.0/15.0
- Cash flow +12.9/30.0
- Schools +4.0/10.0
- DSCR +3.9/10.0
- Rent growth +3.8/5.0
- Livability +3.8/5.0
- 1% rule +2.7/10.0
- Condition / age +2.5/5.0
- Appreciation +0.0/10.0
$219,900
🖨 Deal sheet (PDF) 📄 Offer letter ✓ Due diligence
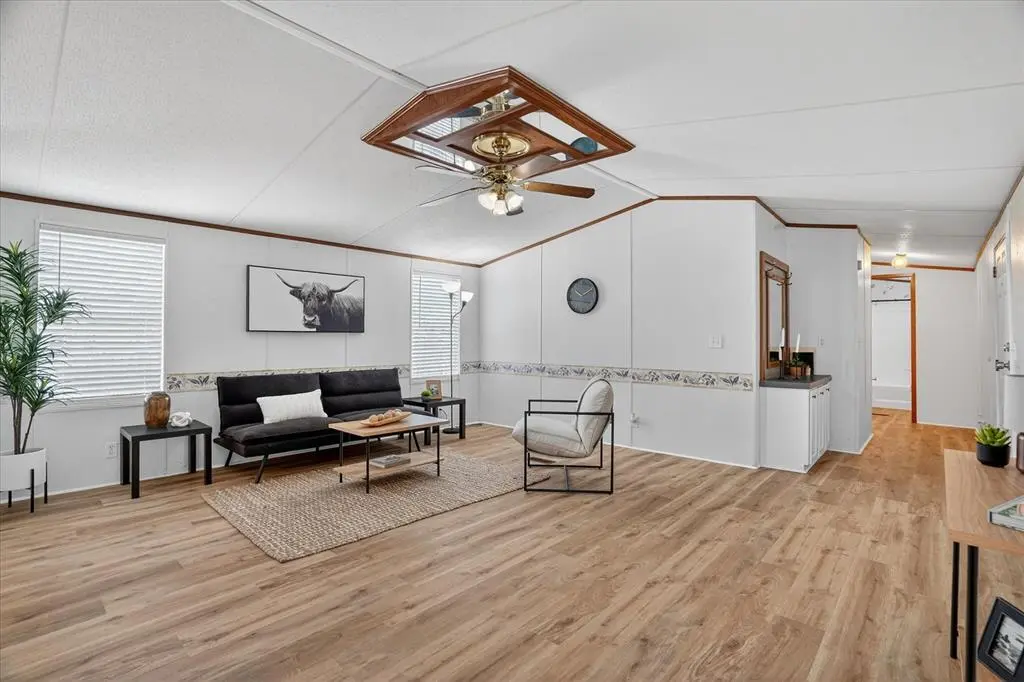
Listing remarks
1% RATE BUYDOWN INCENTIVE AVAILABLE, ASK LISTING AGENT FOR DETAILS. Welcome to 4434 Wildwood Circle in Granbury—a charming 3-bedroom, 2-bath home offering peaceful living just minutes from the lake. This home has been updated with new appliances, new flooring throughout, full exterior paint, and fresh landscaping, enhancing both comfort and curb appeal. Adding even more peace of mind, the property has been converted from septic to city sewer, eliminating a major future expense and providing added convenience for the next owner. Enjoy relaxing on the spacious covered deck while taking in the quiet surroundings that make this area so special. The property features two storage sheds and
Key facts
- New flooring
- Full exterior paint
- New appliances
Tags
Property features AI
Finance
- Financial info: Acceptable financing: Cash, Conventional, FHA, VA; Second mortgage: No; Loan type: Treat as clear
- HOA & community: Mandatory HOA (Port Ridglea East HOA); HOA fee $120 annually (includes full use of facilities); Community features: boat ramp, community pool, fishing, playground
Exterior
- Parking: Attached carport; Detached carport; 2 covered parking spaces; 2 carport spaces
- Utilities: City sewer; MUD sewer; MUD water; Municipal utility district
- Home design: Single family residence; Residential property; One story; Not attached; Year built: 2000
- Construction: Composition roof; Pillar/post/pier foundation; Preowned
- Exterior features: Chain link fencing; Deck; Kennel/dog run; Shed(s); Lot under 0.5 acre
Interior
- Kitchen: Dual sinks; Dishwasher; Electric oven; Electric range; Eat-in kitchen
- Bedrooms: 3 bedrooms; Primary bedroom on level 1 with ensuite bath and walk-in closet; Bedroom with walk-in closet (level 1); Bedroom with built-in desk and walk-in closet (level 1)
- Flooring: Carpet; Laminate; Vinyl
- Bathrooms: 2 full bathrooms; Primary bathroom with dual sinks, garden tub, separate shower and built-in cabinets; Additional bathroom with garden tub
- Heating & cooling: Central heating (electric); Central air (electric)
- Interior features: Cable TV available; Eat-in kitchen; High-speed internet available; One living area; One dining area; Total room count: 9; Levels: One
- Laundry & utility: Full-size washer/dryer area; Washer hookup; Electric dryer hookup; Utility room with built-in cabinets
Neighborhood map
What this means for you Summary
Snapshot
- This is a 3-bed/2.0-bath manufactured listed at $220k.
Deal economics
- At list price, monthly cash flow is $-17 ($-199/yr) — negative.
- To cash-flow at today's rent, offer at most $217k (1.3% below list).
- To meet the 1% rule (rent ≥ 1% of price), the offer needs to be $169k (23.2% below list).
- Recommended offer: $169k (23.2% below list) — sets the bar for 1% rule.
- Cap rate 6.2% vs local median 2.8% in DeCordova — top-decile yield for the area; either an underpriced asset or a hidden risk that comps aren't pricing in. Stress-test before assuming the spread holds.
Location & tenants
- Location reads 76/100 on livability (#120 in TX, #3,802 nationally) — a middle-class / working-renter tenant base. Strengths: crime A+, employment A+, cost of living A+; Watch: health & safety D+, amenities F, commute F.
- Granbury ISD (town): math 46% / reading 46% proficiency, ranked #237 of 826 in TX (top 29%) — families likely to look elsewhere, expect single-tenant / working-renter base with shorter leases.
- Zoned schools: Acton El (math 52% / reading 46%, grade D, #926 of 4,322 statewide, top 22%, 814 students, 48% FRL).
- Market conditions: Rents rising fast (+5.2%/yr); 690 active listings in the ZIP; 3 comparable units currently listed for rent nearby; rentals at typical pace (median 25d on market — plan ~3-4 weeks tenant-placement turnaround); solid renter incomes; 125 units permitted in Hood County in 2024 (0 in 5+ unit buildings).
Forward outlook
- Local home prices are declining (-3.0%/yr); year-one equity from $2k of loan paydown is wiped out by about $7k of value loss. Plan a longer hold.
- Hood County population projected at +29% by 2050 — long-run rental-demand tailwind backs the buy-and-hold thesis.
Negotiation context
- It's been on market 50 days — a 3% lower offer ($213k) is reasonable based on typical stale-listing flexibility.
- 6 sale attempts since 3y ago with the ask held roughly flat each time — persistent listings suggest the price (not the market) is what's stuck; bring a comps-based counter.
Risks & watch-outs
- Climate carrying-cost: major wind risk, 27% chance of damaging wind over 30y; extreme-heat days projected 6→20/yr by 2055 (HVAC capex compounding) — expect insurance premiums to compound above CPI over the hold.
Questions for the listing agent
- What do current leases actually rent for vs. the listed asking? Can we see a recent rent roll and the last 12 months of T-12 income?
- It's been on market 50 days. Have you received any prior offers? Is the seller open to a 23% concession, seller financing, or rate buy-down credit?
- What does the HOA fee cover, when was the last increase, and are there any pending special assessments or reserve-fund shortfalls?
- Is there a deadline driving the sale (1031 exchange, divorce, estate, relocation)? That informs how much negotiation room exists.
- Schools are D-rated, which usually means shorter tenancies and higher turnover. Who's the typical renter profile here, and what's been the actual vacancy rate?
- The area grade is low — what's the realistic commute time and amenity access for the typical tenant pool here? Any planned neighborhood developments (good or bad) we should know about?
- This sits on a lake — are riparian / water-frontage rights deeded with the parcel? Any dock permits, shoreline easements, or HOA water-use restrictions?
- What's the documented flood / surge / shoreline-erosion history here (FEMA AND non-FEMA — e.g., storm surge, creek backup, septic-field saturation)?
- Any water-quality or seasonal algae-bloom issues that affect tenant satisfaction or short-term-rental demand?
- What's the average days-on-market for RENTAL listings here right now (not sales)? A rising rental-DOM trend means longer vacancies and softer asking-rent achievability than the comps imply.
- What's the recent tenant-quality profile in this submarket — average credit score on applications, eviction rate, late-payment / NSF rate, and stable-employment percentage? A property-management company in the area should have these aggregated.
- How much new for-sale + rental construction is in the pipeline within 1–3 miles? Heavy new supply typically softens prices + rents 12–24 months out; constrained supply supports both.
Investment metrics
- 1% rule
- 0.77% ✗
- Cap rate
- 6.20%
- Cash-on-cash
- -0.32%
- DSCR
- 0.99
- GRM
- 10.8
CMA / ARV
- ARV (median comp)
- $285,989
- List price
- $219,900
- Delta
- -23.11%
- Verdict
- UNDERPRICED
- Comps
- 20 within 1.0 mi
Projected returns pro-forma
-3.0% appreciation · 5.2% rent growth · sell at horizon
- IRR
- -14.7%
- Equity multiple
- 0.46×
- Total profit
- $-32,946
- Equity at exit
- $32,788
- IRR
- -3.1%
- Equity multiple
- 0.77×
- Total profit
- $-13,958
- Equity at exit
- $19,013
Cash invested: $61,572 (down + closing). Projections, not guarantees.
Landlord ↔ Tenant lean methodology
- Overall (STATE)
- 87 Strongly Landlord-Friendly
- State Texas
- 87 Strongly Landlord-Friendly · R+5
- County
- — inherits STATE
- City
- — inherits STATE
ZIP-level market 76049
- Home prices YoY
- -26.8%
- Rents YoY
- 5.2%
- Active inventory
- 690
- Price-to-rent
- 10.8×
Monthly cashflow live
- Estimated rent
- $1,690 medium interval (Pro) →
- Mortgage (P&I)
- −$1,153
- Tax from tax record
- −$97 /mo · $1,161/yr
- Insurance
- −$92
- HOA
- −$10
- Vacancy / Maint / Mgmt
- −$355
- Net cashflow
- $-17
Break-even live
Sensitivity live
| Price | -10% $108 | -5% $46 | +0% $-17 | +5% $-79 | +10% $-141 |
|---|---|---|---|---|---|
| Rent | -10% $-150 | -5% $-83 | +0% $-17 | +5% $50 | +10% $117 |
| Rate | -1.0pp $94 | -0.5pp $39 | base $-17 | +0.5pp $-74 | +1.0pp $-132 |
UW: 25.0% down · 7.5% · 30yr · 1.5% tax · 5.0% vac · 8.0% maint · 8.0% mgmt
Financing live
Cash to close
- Down payment
- $54,975
- Closing costs
- $6,597
- Reserves months
- —
- Total cash needed
- —
Loan-product check · same deal, 3 products live
Conventional
25% down · 7.5% · 30yr
- Down + closing
- —
- Monthly P&I
- —
- Monthly cashflow
- —
- DSCR
- —
- Eligible?
- —
Personal DTI + credit; lowest rate.
DSCR
20% down · 8.5% · 30yr
- Down + closing
- —
- Monthly P&I
- —
- Monthly cashflow
- —
- DSCR
- —
- Eligible?
- —
No personal income docs; deal must DSCR.
Hard money
10% down · 12.0% · 12mo
- Down + closing
- —
- Monthly P&I
- —
- Monthly cashflow
- —
- DSCR
- —
- Eligible?
- —
Short-term bridge; refi at stabilization.
Rent comps 3 comps
| Address | Beds | Baths | Sqft | Rent | $/sqft | DOM | Units | Dist |
|---|---|---|---|---|---|---|---|---|
| 4528 Wildwood Cir Granbury, TX | 2.0 | 2.0 | 912 | $1,450 | $1.59 | 25d | 1 | 0.08mi |
| 3910 Montgomery Dr Granbury, TX | 4.0 | 2.0 | 1344 | $1,410 | $1.05 | 44d | 1 | 0.61mi |
| 3524 Gerry Dr Granbury, TX | 2.0 | 2.0 | 784 | $1,375 | $1.75 | 25d | 1 | 0.75mi |
HOA detail
- Monthly dues
- $10 · $120/yr
- Likely covers
- sewerlandscaping
Listing history 31 events
-
2026-06-18days on market $219,900 Active 50 DOM
-
2026-06-17days on market $219,900 Active 49 DOM
-
2026-06-16days on market $219,900 Active 48 DOM
-
2026-06-15days on market $219,900 Active 47 DOM
-
2026-06-13days on market $219,900 Active 45 DOM
-
2026-06-09days on market $219,900 Active 41 DOM
-
2026-06-08days on market $219,900 Active 40 DOM
-
2026-06-07days on market $219,900 Active 39 DOM
-
2026-06-04days on market $219,900 Active 36 DOM
-
2026-06-03days on market $219,900 Active 35 DOM
-
2026-06-02days on market $219,900 Active 34 DOM
-
2026-06-02days on market $219,900 Active 33 DOM
-
2026-05-31days on market $219,900 Active 32 DOM
-
2026-04-24$224,900 Active 1102-char remark
-
2025-08-21historical
-
2025-08-19price $192,200
-
2025-05-09price $192,000
-
2025-04-25$192,900 Active
-
2025-04-22historical
-
2025-04-17price $193,000
-
2025-04-11price $193,900
-
2025-02-27$194,900 Active
-
2024-05-08price $199,900
-
2024-03-04status Active
-
2024-02-24historical Active Option Contract
-
2024-02-16$214,900 Active
-
2024-02-10historical
-
2023-11-15price $219,900
-
2023-08-10$225,000 Active
-
2023-07-24soldstatus
-
2021-03-03soldstatus
ⓘ Source: listings_history table (triggers on properties + properties_extension) + one-shot
backfill from property_details.listing_events for pre-trigger history.
Tax reassessment forecast TX · Resets to sale price
- Current annual tax
- $1,161 · $97/mo
- Projected year-2 tax
- $4,024 · $335/mo
- Expected delta
- +$2,863/yr (+$239/mo · 246.5%)
ⓘ Screening estimate from a state-policy table — verify with the county assessor before closing.
Climate risk First Street
- Flood 3/10 Moderate FEMA zone X (unshaded) · 9% chance over 30 yrs
- Wildfire 4/10 Moderate
- Heat 7/10 Severe 6 d/yr ≥109°F today · 20 d/yr by 30 yrs out
- Wind 6/10 Major 27% chance of damaging wind over 30 yrs
- Air quality 2/10 Low 1 unhealthy d/yr today · 2 by 30 yrs out
Nearby sold comps map
Loading sold comps map…
Walkable amenities ~0.75 mi
Loading nearby amenities…
Taxation est. · year 1
- Rental income
- $20,278
- − Mortgage interest
- −$12,318
- − Property taxes
- −$1,161
- − Insurance
- −$1,100
- − Repairs & maintenance
- −$1,622
- − Management
- −$1,622
- − HOA
- −$120
- − Depreciation
- −$6,397
- Taxable loss
- −$4,062
- Est. tax savings @ 24.0%
- +$975
- After-tax cash flow
- $776/yr
For passive investors: Depreciation is non-cash, so a rental often shows a tax loss while cash-flowing — sheltering income. Rental losses are passive: they offset passive income freely, and up to $25,000/yr can offset ordinary (W-2) income if you actively participate and your MAGI is under $100k (phasing out to $0 by $150k); unused losses carry forward. On sale, claimed depreciation is recaptured at up to 25%, and gains may owe capital-gains tax (a 1031 exchange can defer both). Figures are a year-1 estimate at your 24.0% rate — not tax advice; consult a CPA.
Schools (NCES district)
- District
- Granbury ISD
- NCES district ID
- 4821390
- Math proficiency
- 46% ▬ 0.00%
- Reading proficiency
- 46% ▲ 4.00%
- Median HH income
- $55,856
- Composite
- 40.04/100
- National rank
- #3820
- State rank
- #237 of 826 in TX
Livability — DeCordova
- Score
- 76/100
- State rank
- #120
- US rank
- #3802
Category grades
Schools grade is shown separately in the Schools card above.
Census & demographics
- County
- Hood County · 58,506 people
- Metro
- Granbury, TX
- Population (ZIP)
- 31,506
- Household income
- $104,967
- Rent vs Own
- Severe rent burden
- 235.0
Population outlook (Hood County) Hauer SSP2
- Today (2025)
- 63,502 people
- By 2030
- 67,459 · +6.2%
- By 2040
- 74,958 · +18.0%
- By 2050
- 81,922 · +29.0%
- By 2075
- 98,872 · +55.7%
- By 2100
- 107,796 · +69.8%
Race, ethnicity, and origin ACS 2023
- Neighborhood character
- Predominantly White (82%)
- Race & ethnicity
- White 82% Hispanic / Latino 14% Two or more races 9%
- Hispanic origin (detail)
- Mexican 11%
- Common ancestry
- Slovak 3% Serbian 2% Italian 2%
- Foreign-born
- 5% · Canada
- Languages at home
- 91% English-only · Spanish 8%
Political lean MEDSL · Hood
- 2024 margin
- Solid R (+66.0) · D 16.6% · R 82.6%
- 2008→2024 swing
- -11.9pp toward R · 2008: -54.0pp · 2024: -66.0pp
- All cycles
- 2024: R+66.0 2020: R+64.1 2016: R+66.5 2012: R+64.7 2008: R+54.0
Not yet ingested
- Civics
- —
Market trends
- HPI YoY
- ▼ -100.09%
- Current HPI
- 273.1293
- Rent YoY
- ▲ 5.20%
- Metro
- Granbury, TX
- State GDP YoY
- ▲ 3.95%
- F500 in state
- 110
Industry mix (Fortune 500 HQ in TX)
| Industry | F500 HQs | Revenue |
|---|---|---|
| Energy | 16 | $1,198B |
|
||
| Technology | 5 | $198B |
|
||
| Engineering / Construction | 4 | $72B |
|
||
| Energy Services | 3 | $60B |
|
||
| Utilities | 3 | $41B |
|
||
| Healthcare | 2 | $330B |
|
||
Price history
-2.3% since first listed19 events — show timeline
- 2026-05-21 Price Changed $219,900 NTREIS
- 2026-04-24 Listed $224,900 NTREIS
- 2025-08-21 Listing Removed — NTREIS
- 2025-08-19 Price Changed $192,200 NTREIS
- 2025-05-09 Price Changed $192,000 NTREIS
- 2025-04-25 Listed $192,900 NTREIS
- 2025-04-22 Listing Removed — NTREIS
- 2025-04-17 Price Changed $193,000 NTREIS
- 2025-04-11 Price Changed $193,900 NTREIS
- 2025-02-27 Listed $194,900 NTREIS
- 2024-05-08 Price Changed $199,900 NTREIS
- 2024-03-04 Relisted — NTREIS
- 2024-02-24 Contingent — NTREIS
- 2024-02-16 Listed $214,900 NTREIS
- 2024-02-10 Listing Removed — NTREIS
- 2023-11-15 Price Changed $219,900 NTREIS
- 2023-08-10 Listed $225,000 NTREIS
- 2023-07-24 Sold (Public Records) — Public Records
- 2021-03-03 Sold (Public Records) — Public Records
Property tax history
+13.2%/yrLatest (2025): $1,161 · +438.1% YoY. Source: county tax records.
Cash-flow waterfall
monthlySold comps — $/sqft
last 12 mo · ≤1 miLoading sold comps…