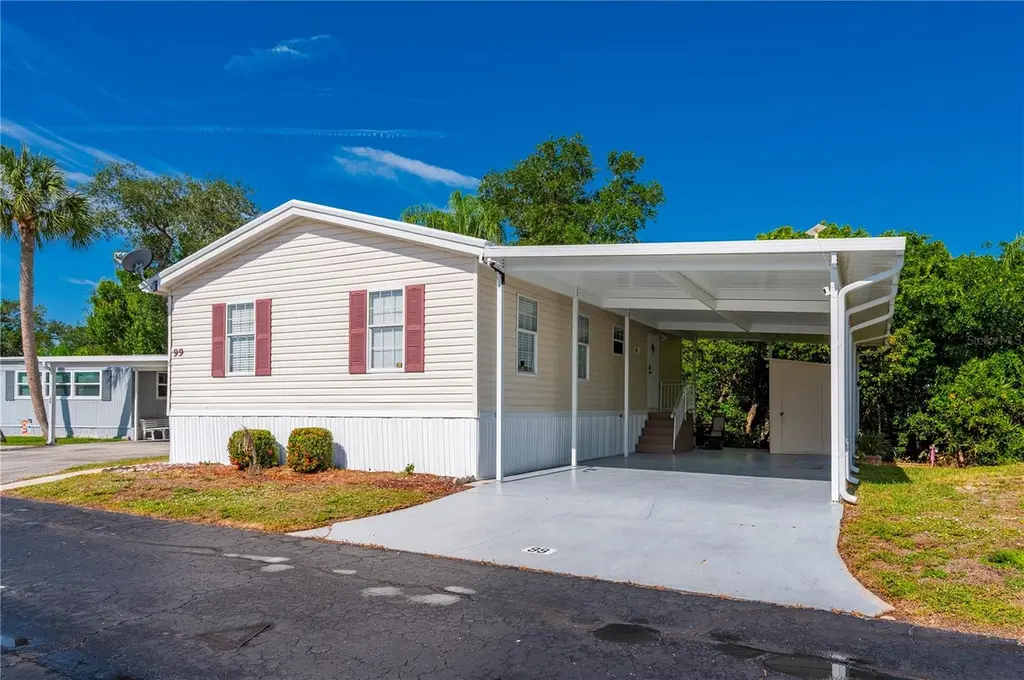
24437 Harborview Rd #99 · Charlotte Harbor, FL
Flood risk 9/10 · Severe
- FEMA flood zone
- AE
- Chance of flooding over 30 yrs
- 0.99%
- Est. flood insurance / yr
- $1,737 – $8,500
Fire risk 1/10 · Minimal
- Est. fire insurance / yr
- $947 – $1,759
Heat risk 10/10 · Severe
- Hot days now (above 107°F)
- 7 days/yr
- Hot days in 30 yrs
- 28 days/yr
Wind risk 10/10 · Severe
- Chance of severe wind over 30 yrs
- 99.0%
Air-quality risk 2/10 · Minimal
- Unhealthy air days now
- 2 days/yr
- Unhealthy air days in 30 yrs
- 2 days/yr
Risk factors via First Street. Map © Google.
Why this score? — see what drove the C+ grade
The composite is a weighted blend of 9 inputs, each scored 0–100. Each bar is that input's sub-score; the figure is the points it added to the 100-point composite (weight × sub-score).
- Cash flow +30.0/30.0
- 1% rule +10.0/10.0
- DSCR +10.0/10.0
- Schools +4.6/10.0
- Livability +3.4/5.0
- Condition / age +2.5/5.0
- Rent growth +1.5/5.0
- ARV discount +0.0/15.0
- Appreciation +0.0/10.0
$98,300
🖨 Deal sheet 📄 Offer letter ✓ Due diligence
Listing remarks
Welcome to easy, peaceful living where your mornings start with coffee under the carport, a gentle breeze coming off the water, and the quiet rhythm of a community designed for relaxation. Tucked inside a charming 55+ waterfront community along the Peace River, this TURNKEY home offers a lifestyle that feels a world away from the everyday rush. Step inside and you’re greeted with a bright, open layout that invites you to settle in right away. The spacious great room becomes the heart of the home, perfect for hosting friends, enjoying a quiet evening, or simply unwinding after a day on the water. The kitchen offers plenty of cabinetry and workspace, making it easy to stay organized whi
Key facts
- Recent updates
- Private ramp
- Waterfront community
Tags
Property features AI
Finance
- Other: Property type: Residential — Manufactured Home; Body type: Double Wide; Lot approx. 0.07 acres (paved road access); Located in MHP zoning; Other structures: Shed(s)
- Financial info: Total monthly HOA fees $250 (annual $3,000); Lease restrictions apply
- HOA & community: Has HOA (monthly fee $250) — fee required and association approval required; Association covers maintenance of grounds, management, sewer, trash and water; Community clubhouse; Community mailbox; Deed restrictions; Golf carts allowed; Senior community; Cats allowed
Exterior
- Parking: Carport with 2 spaces
- Utilities: Public water; Public sewer; Electricity connected; Cable connected
- Home design: Manufactured double-wide home; Single-story; Faces east; Completed condition
- Construction: Vinyl siding; Membrane roof; Crawlspace foundation; Built as a manufactured home
- Exterior features: Exterior lighting; Storage shed
Interior
- Kitchen: Range; Microwave; Refrigerator
- Bedrooms: 2 bedrooms
- Flooring: Carpet; Linoleum
- Bathrooms: 2 full bathrooms
- Heating & cooling: Electric heating; Central air conditioning
- Interior features: Ceiling fans; Open floorplan; Split bedroom layout; Walk-in closets
- Laundry & utility: Washer; Dryer; Electric water heater; Laundry inside
Neighborhood map
What this means for you Summary
Snapshot
- This is a 2-bed/2.0-bath manufactured listed at $98k.
Deal economics
- At list price, monthly cash flow is $362 ($4k/yr) — positive.
- The deal already cash-flows at list — no discount required.
- Meets the 1% rule at list price ($2k rent vs $98k).
- Recommended offer: $95k (3.0% below list) — sets the bar for market timing.
Location & tenants
- Location reads 68/100 on livability (#536 in FL) — a middle-class / working-renter tenant base. Strengths: cost of living A+, housing A+, crime A-; Watch: employment D+, schools F, amenities F.
- Charlotte (suburban): math 54% / reading 54% proficiency, ranked #22 of 73 in FL (top 30%) — acceptable for families but not a draw, mixed tenant base, ~2y average lease.
- Market conditions: Rents falling (-4.0%/yr); 600 active listings in the ZIP; 4 comparable units currently listed for rent nearby; rentals at typical pace (median 21d on market — plan ~3-4 weeks tenant-placement turnaround); 4,585 units permitted in Charlotte County in 2024 (703 in 5+ unit buildings).
- This rent runs 42% of the median local income ($64k/yr) — at the standard rent-burdened threshold; future hikes will face affordability resistance.
Forward outlook
- Local home prices are declining (-3.0%/yr); year-one equity from $680 of loan paydown is wiped out by about $3k of value loss. Plan a longer hold.
- Charlotte County population projected at +24% by 2050 — long-run rental-demand tailwind backs the buy-and-hold thesis.
Negotiation context
- It's been on market 34 days — a 3% lower offer ($95k) is reasonable based on typical stale-listing flexibility.
- 2 sale attempts with the ask held roughly flat each time — persistent listings suggest the price (not the market) is what's stuck; bring a comps-based counter.
Risks & watch-outs
- Watch-outs: flood insurance adds $427/mo.
- Climate carrying-cost: in FEMA flood zone AE (mandatory federal flood insurance); severe wind risk, 99% chance of damaging wind over 30y; extreme-heat days projected 7→28/yr by 2055 (HVAC capex compounding) — expect insurance premiums to compound above CPI over the hold.
Questions for the listing agent
- It's been on market 34 days. Have you received any prior offers? Is the seller open to a 3% concession, seller financing, or rate buy-down credit?
- What's the actual annual flood-insurance premium (NFIP or private), and is the property in a SFHA with mandatory coverage?
- What does the HOA fee cover, when was the last increase, and are there any pending special assessments or reserve-fund shortfalls?
- Is there a deadline driving the sale (1031 exchange, divorce, estate, relocation)? That informs how much negotiation room exists.
- Schools are F-rated, which usually means shorter tenancies and higher turnover. Who's the typical renter profile here, and what's been the actual vacancy rate?
- What's the average days-on-market for RENTAL listings here right now (not sales)? A rising rental-DOM trend means longer vacancies and softer asking-rent achievability than the comps imply.
- What's the recent tenant-quality profile in this submarket — average credit score on applications, eviction rate, late-payment / NSF rate, and stable-employment percentage? A property-management company in the area should have these aggregated.
- How much new for-sale + rental construction is in the pipeline within 1–3 miles? Heavy new supply typically softens prices + rents 12–24 months out; constrained supply supports both.
Investment metrics
- 1% rule
- 2.25% ✓
- Cap rate
- 15.92%
- Cash-on-cash
- 34.37%
- DSCR
- 2.53
- GRM
- 3.7
CMA / ARV
- ARV (on-the-fly)
- $81,600
- Comps found
- 1
Show comp detail 1 sale within ~0.75 mi
| Address | Dist | Beds/Ba | Sqft | Sold | Price | $/sf | Match |
|---|---|---|---|---|---|---|---|
| 20 Mary LU Mhp | 0.07mi | 2/2.0 | 1,056 (+10%) | 6mo | $90,000 | $85 | 75 |
Match score weights: distance 35% · size 25% · config 20% · recency 20%. Top-matched comps best support the ARV.
Projected returns pro-forma
-3.0% appreciation · 0.0% rent growth · sell at horizon
- IRR
- 1.1%
- Equity multiple
- 1.04×
- Total profit
- $1,091
- Equity at exit
- $14,657
- IRR
- 4.8%
- Equity multiple
- 1.27×
- Total profit
- $7,454
- Equity at exit
- $8,499
Cash invested: $27,524 (down + closing). Projections, not guarantees.
Landlord ↔ Tenant lean methodology
- Overall (STATE)
- 87 Strongly Landlord-Friendly
- State Florida
- 87 Strongly Landlord-Friendly · R+3
- County
- — inherits STATE
- City
- — inherits STATE
ZIP-level market 33980
- Home prices YoY
- -5.0%
- Rents YoY
- -4.0%
- Active inventory
- 600
- Price-to-rent
- 3.7×
Monthly cashflow live
- Estimated rent
- $2,213 medium interval (Pro) →
- Mortgage (P&I)
- −$515
- Tax from tax record
- −$153 /mo · $1,839/yr
- Insurance
- −$41
- Flood insurance flood zone
- −$427 /mo · $5,118/yr
- HOA
- −$250
- Vacancy / Maint / Mgmt
- −$465
- Net cashflow
- $362
Break-even live
UW: 25.0% down · 7.5% · 30yr · 1.5% tax · 5.0% vac · 8.0% maint · 8.0% mgmt
Financing live
Cash to close
- Down payment
- $24,575
- Closing costs
- $2,949
- Reserves months
- —
- Total cash needed
- —
Loan-product check · same deal, 3 products live
Conventional
25% down · 7.5% · 30yr
- Down + closing
- —
- Monthly P&I
- —
- Monthly cashflow
- —
- DSCR
- —
- Eligible?
- —
Personal DTI + credit; lowest rate.
DSCR
20% down · 8.5% · 30yr
- Down + closing
- —
- Monthly P&I
- —
- Monthly cashflow
- —
- DSCR
- —
- Eligible?
- —
No personal income docs; deal must DSCR.
Hard money
10% down · 12.0% · 12mo
- Down + closing
- —
- Monthly P&I
- —
- Monthly cashflow
- —
- DSCR
- —
- Eligible?
- —
Short-term bridge; refi at stabilization.
Rent comps 4 comps
| Address | Beds | Baths | Sqft | Rent | $/sqft | DOM | Units | Dist |
|---|---|---|---|---|---|---|---|---|
| 4056 Oakview Dr Unit E7 Punta Gorda, FL | 2.0 | 2.0 | 892 | $3,000 | $3.36 | 21d | 1 | 0.31mi |
| 4016 Oakview Dr Unit J9 Punta Gorda, FL | 2.0 | 2.0 | 893 | $2,400 | $2.69 | 21d | 1 | 0.38mi |
| 4024 Oakview Dr Unit I3 Punta Gorda, FL | 2.0 | 2.0 | 893 | $1,900 | $2.13 | 21d | 1 | 0.38mi |
| 25068 Harbor View Rd Punta Gorda, FL | 2.0 | 2.0 | 956 | $1,500 | $1.57 | 21d | 1 | 0.42mi |
HOA detail
- Monthly dues
- $250 · $3,000/yr
- Likely covers
- water
Listing history 26 events
-
2026-06-18days on market $98,300 Active 34 DOM
-
2026-06-17days on market $98,300 Active 33 DOM
-
2026-06-16days on market $98,300 Active 32 DOM
-
2026-06-15days on market $98,300 Active 31 DOM
-
2026-06-14days on market $98,300 Active 29 DOM
-
2026-06-13days on market $98,300 Active 28 DOM
-
2026-06-10days on market $98,300 Active 26 DOM
-
2026-06-09days on market $98,300 Active 25 DOM
-
2026-06-08days on market $98,300 Active 24 DOM
-
2026-06-07days on market $98,300 Active 23 DOM
-
2026-06-05days on market $98,300 Active 20 DOM
-
2026-06-03days on market $98,300 Active 19 DOM
-
2026-06-02days on market $98,300 Active 18 DOM
-
2026-06-01days on market $98,300 Active 17 DOM
-
2026-05-31days on market $98,300 Active 16 DOM
-
2026-05-30days on market $98,300 Active 15 DOM
-
2026-05-15$98,300 Active
-
2025-08-30status Pending
-
2025-08-30historical
-
2025-08-25price $75,000
-
2025-08-12price $79,000
-
2025-08-01price $104,500
-
2025-07-15price $114,950
-
2025-06-14price $119,900
-
2025-04-16price $124,500
-
2025-01-14$135,000 Active
ⓘ Source: listings_history table (triggers on properties + properties_extension) + one-shot
backfill from property_details.listing_events for pre-trigger history.
Tax reassessment forecast FL · Resets to sale price
- Current annual tax
- $1,839 · $153/mo
- Projected year-2 tax
- $1,839 · $153/mo
- Expected delta
- $0/yr ($0/mo · 0.0%)
ⓘ Screening estimate from a state-policy table — verify with the county assessor before closing.
Climate risk First Street
- Flood 9/10 Extreme FEMA zone AE · 99% chance over 30 yrs
- Wildfire 1/10 Low
- Heat 10/10 Extreme 7 d/yr ≥107°F today · 28 d/yr by 30 yrs out
- Wind 10/10 Extreme 99% chance of damaging wind over 30 yrs
- Air quality 2/10 Low 2 unhealthy d/yr today · 2 by 30 yrs out
Nearby sold comps map
Loading sold comps map…
Walkable amenities ~0.75 mi
Loading nearby amenities…
Taxation est. · year 1
- Rental income
- $26,551
- − Mortgage interest
- −$5,506
- − Property taxes
- −$1,839
- − Insurance
- −$5,610
- − Repairs & maintenance
- −$2,124
- − Management
- −$2,124
- − HOA
- −$3,000
- − Depreciation
- −$2,860
- Taxable income
- $3,488
- Est. tax owed @ 24.0%
- −$837
- After-tax cash flow
- $3,503/yr
For passive investors: Depreciation is non-cash, so a rental often shows a tax loss while cash-flowing — sheltering income. Rental losses are passive: they offset passive income freely, and up to $25,000/yr can offset ordinary (W-2) income if you actively participate and your MAGI is under $100k (phasing out to $0 by $150k); unused losses carry forward. On sale, claimed depreciation is recaptured at up to 25%, and gains may owe capital-gains tax (a 1031 exchange can defer both). Figures are a year-1 estimate at your 24.0% rate — not tax advice; consult a CPA.
Schools (NCES district)
- District
- Charlotte
- NCES district ID
- 1200240
- Math proficiency
- 54% ▼ -6.00%
- Reading proficiency
- 54% ▼ -1.00%
- Median HH income
- $44,864
- Composite
- 45.62/100
- National rank
- #2586
- State rank
- #22 of 73 in FL
Livability — Charlotte Harbor
- Score
- 68/100
- State rank
- #536
- US rank
- #10043
Category grades
Schools grade is shown separately in the Schools card above.
Census & demographics
- Census place
- Charlotte Harbor, FL
- County
- Charlotte County · 196,994 people
- Metro
- Punta Gorda, FL
- Population (ZIP)
- 13,120
- Household income
- $63,591
- Rent vs Own
- Severe rent burden
- 612.0
Population outlook (Charlotte County) Hauer SSP2
- Today (2025)
- 198,646 people
- By 2030
- 210,507 · +6.0%
- By 2040
- 230,857 · +16.2%
- By 2050
- 247,148 · +24.4%
- By 2075
- 281,777 · +41.8%
- By 2100
- 293,609 · +47.8%
Race, ethnicity, and origin ACS 2023
- Neighborhood character
- Predominantly White (75%)
- Race & ethnicity
- White 75% Hispanic / Latino 10% Two or more races 10% Black 9%
- Hispanic origin (detail)
- Puerto Rican 3% Cuban 2% Dominican 2%
- Common ancestry
- Romanian 5% Hispanic 4% Slovak 3%
- Foreign-born
- 16% · Canada, Jamaica
- Languages at home
- 85% English-only · Spanish 8% French/Haitian/Cajun 5% German/W. Germanic 1%
Political lean MEDSL · Charlotte
- 2024 margin
- Solid R (+34.0) · D 32.7% · R 66.7%
- 2008→2024 swing
- -26.7pp toward R · 2008: -7.2pp · 2024: -34.0pp
- All cycles
- 2024: R+34.0 2020: R+26.6 2016: R+27.8 2012: R+14.3 2008: R+7.2
Not yet ingested
- Civics
- —
Market trends
- HPI YoY
- ▼ -16.02%
- Current HPI
- 306.3331
- Rent YoY
- ▼ -4.04%
- Metro
- Punta Gorda, FL
- State GDP YoY
- ▲ 3.28%
- F500 in state
- 36
Industry mix (Fortune 500 HQ in FL)
| Industry | F500 HQs | Revenue |
|---|---|---|
| Industrial Technology | 2 | $29B |
|
||
| Insurance | 2 | $17B |
|
||
| Retail | 1 | $60B |
|
||
| Technology Distribution | 1 | $58B |
|
||
| Homebuilding | 1 | $35B |
|
||
| Technology Manufacturing | 1 | $35B |
|
||
Price history
-27.2% since first listed10 events — show timeline
- 2026-05-15 Listed $98,300 Stellar MLS as Distributed by MLS Grid
- 2025-08-30 Pending — Stellar MLS as Distributed by MLS Grid
- 2025-08-30 Listing Removed — Stellar MLS as Distributed by MLS Grid
- 2025-08-25 Price Changed $75,000 Stellar MLS as Distributed by MLS Grid
- 2025-08-12 Price Changed $79,000 Stellar MLS as Distributed by MLS Grid
- 2025-08-01 Price Changed $104,500 Stellar MLS as Distributed by MLS Grid
- 2025-07-15 Price Changed $114,950 Stellar MLS as Distributed by MLS Grid
- 2025-06-14 Price Changed $119,900 Stellar MLS as Distributed by MLS Grid
- 2025-04-16 Price Changed $124,500 Stellar MLS as Distributed by MLS Grid
- 2025-01-14 Listed $135,000 Stellar MLS as Distributed by MLS Grid
Property tax history
+9.0%/yrLatest (2025): $1,839 · -0.9% YoY. Source: county tax records.
Cash-flow waterfall
monthlySold comps — $/sqft
last 12 mo · ≤1 miLoading sold comps…