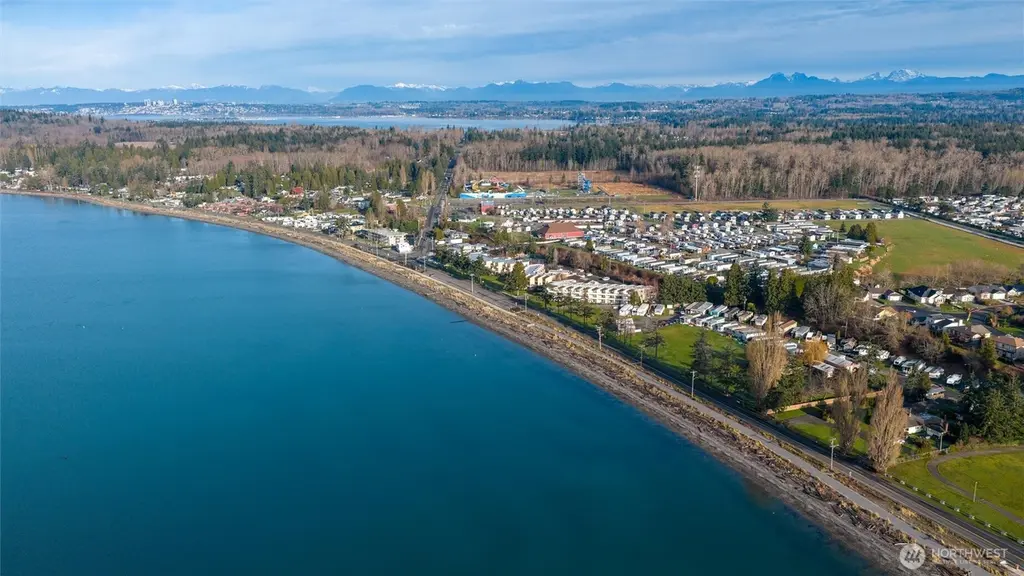
7954 Birch Bay Dr #24 · Birch Bay, WA
Flood risk 9/10 · Severe
- FEMA flood zone
- AE
- Chance of flooding over 30 yrs
- 0.99%
- Est. flood insurance / yr
- $1,737 – $8,500
Fire risk 1/10 · Minimal
- Est. fire insurance / yr
- $604 – $1,122
Heat risk 2/10 · Minimal
- Hot days now (above 81°F)
- 7 days/yr
- Hot days in 30 yrs
- 18 days/yr
Wind risk 1/10 · Minimal
- Chance of severe wind over 30 yrs
- —
Air-quality risk 6/10 · Moderate
- Unhealthy air days now
- 7 days/yr
- Unhealthy air days in 30 yrs
- 10 days/yr
Risk factors via First Street. Map © Google.
Why this score? — see what drove the A grade
The composite is a weighted blend of 9 inputs, each scored 0–100. Each bar is that input's sub-score; the figure is the points it added to the 100-point composite (weight × sub-score).
- Cash flow +30.0/30.0
- ARV discount +15.0/15.0
- 1% rule +10.0/10.0
- DSCR +10.0/10.0
- Appreciation +10.0/10.0
- Schools +4.7/10.0
- Rent growth +3.3/5.0
- Livability +3.1/5.0
- Condition / age +2.5/5.0
$75,000
🖨 Deal sheet 📄 Offer letter ✓ Due diligence
Listing remarks
Coastal Living Just Steps from the Water! This charming single-wide manufactured home in Birch Bay offers an unbeatable location and relaxed beachside lifestyle. Featuring 2 bedrooms and 1 bathroom, the home feels open and airy with vaulted ceilings and a comfortable, functional layout with a new ductless heat pump and new carpet in the living room. Enjoy morning coffee or evening sunsets from the covered porch and take advantage of the storage shed for all your beach gear. Located directly across the street from Birch Bay, you’ll have steps-away beach access and water enjoyment right at your doorstep. Just minutes from local restaurants, shops, and amenities, and conveniently close t
Key facts
- Covered porch
- Storage shed
- Beach access
Tags
Neighborhood map
What this means for you Summary
Snapshot
- This is a 2-bed/1.0-bath manufactured listed at $75k.
Deal economics
- At list price, monthly cash flow is $636 ($8k/yr) — positive.
- The deal already cash-flows at list — no discount required.
- Meets the 1% rule at list price ($2k rent vs $75k).
- Recommended offer: $66k (12.0% below list) — sets the bar for market timing.
- Cap rate 23.3% vs local median 2.6% in Birch Bay — top-decile yield for the area; either an underpriced asset or a hidden risk that comps aren't pricing in. Stress-test before assuming the spread holds.
Location & tenants
- Location reads 62/100 on livability (#406 in WA) — a middle-class / working-renter tenant base. Strengths: housing A; Watch: cost of living D+, health & safety D, schools F.
- Blaine School District (town): math 49% / reading 55% proficiency, ranked #120 of 291 in WA (top 41%) — acceptable for families but not a draw, mixed tenant base, ~2y average lease.
- Market conditions: Rents rising (+3.1%/yr); 454 active listings in the ZIP; solid renter incomes; 1,190 units permitted in Whatcom County in 2024 (327 in 5+ unit buildings).
Forward outlook
- In year one you build about $8k of equity ($519 loan paydown + $8k appreciation (10.0% local appreciation)).
- Whatcom County population projected at +28% by 2050 — long-run rental-demand tailwind backs the buy-and-hold thesis.
- At projected returns (10.0% appreciation + 3.1% rent growth), your $21k cash investment doubles in ~2 years — after that, you're playing with house money.
- By year 5, paydown + projected appreciation supports a ~$37k cash-out refi (75% LTV) — recoverable capital for the next deal without selling this one.
Negotiation context
- It's been on market 140 days — a 12% lower offer ($66k) is reasonable based on typical stale-listing flexibility.
- 4 sale attempts since 4y ago with the ask held roughly flat each time — persistent listings suggest the price (not the market) is what's stuck; bring a comps-based counter.
- Current owner paid $65k; 15% above their basis — modest negotiation headroom, anchor on the comps not their cost.
Risks & watch-outs
- Watch-outs: flood insurance adds $427/mo.
- Climate carrying-cost: in FEMA flood zone AE (mandatory federal flood insurance) — expect insurance premiums to compound above CPI over the hold.
Questions for the listing agent
- It's been on market 140 days. Have you received any prior offers? Is the seller open to a 12% concession, seller financing, or rate buy-down credit?
- Built in 1970 — when were the roof, HVAC, electrical panel, plumbing, and water heater last replaced?
- What's the actual annual flood-insurance premium (NFIP or private), and is the property in a SFHA with mandatory coverage?
- Why hasn't it sold? Are there any deal-killer items the seller is aware of (foundation, flood, title, zoning, code violations)?
- Is there a deadline driving the sale (1031 exchange, divorce, estate, relocation)? That informs how much negotiation room exists.
- Schools are F-rated, which usually means shorter tenancies and higher turnover. Who's the typical renter profile here, and what's been the actual vacancy rate?
- What's the average days-on-market for RENTAL listings here right now (not sales)? A rising rental-DOM trend means longer vacancies and softer asking-rent achievability than the comps imply.
- What's the recent tenant-quality profile in this submarket — average credit score on applications, eviction rate, late-payment / NSF rate, and stable-employment percentage? A property-management company in the area should have these aggregated.
- How much new for-sale + rental construction is in the pipeline within 1–3 miles? Heavy new supply typically softens prices + rents 12–24 months out; constrained supply supports both.
Investment metrics
- 1% rule
- 2.54% ✓
- Cap rate
- 23.29%
- Cash-on-cash
- 60.70%
- DSCR
- 3.70
- GRM
- 3.3
CMA / ARV
- ARV (median comp)
- $149,306
- List price
- $75,000
- Delta
- -49.77%
- Verdict
- UNDERPRICED
- Comps
- 14 within 1.0 mi
Show comp detail 11 sales within ~0.75 mi
| Address | Dist | Beds/Ba | Sqft | Sold | Price | $/sf | Match |
|---|---|---|---|---|---|---|---|
| 8080 Harborview Rd Unit M159 | 0.12mi | 2/1.0 | 528 (0%) | 1mo | $20,000 | $38 | 93 |
| 4751 Birch Bay Lynden Rd #51 | 0.41mi | 2/1.0 | 536 (+2%) | 7mo | $149,900 | $280 | 72 |
| 8080 Harborview Rd | 0.18mi | 2/1.0 | 530 (+0%) | 22mo | $15,000 | $28 | 72 |
| 4751 Birch Bay Lynden #129 | 0.25mi | 1/1.0 (-1) | 570 (+8%) | 1mo | $240,000 | $421 | 69 |
| 4751 Birch Bay Lynden Rd #99 | 0.32mi | 1/1.0 (-1) | 540 (+2%) | 10mo | $193,500 | $358 | 68 |
| 8080 Harborview Rd Unit F91 | 0.25mi | 1/1.0 (-1) | 560 (+6%) | 9mo | $75,000 | $134 | 66 |
| 7954 Birch Bay Dr #22 | 0.00mi | 2/1.0 | 576 (+9%) | 24mo | $122,500 | $213 | 65 |
| 4751 Birch Bay Lynden Rd #256 | 0.32mi | 1/1.0 (-1) | 550 (+4%) | 12mo | $250,000 | $455 | 63 |
| 4751 Birch Bay Lynden Rd #2 | 0.40mi | 1/1.0 (-1) | 531 (+1%) | 17mo | $125,000 | $235 | 61 |
| 4751 Birch Bay Lynden Rd #236 | 0.31mi | 1/1.0 (-1) | 580 (+10%) | 13mo | $240,000 | $414 | 53 |
| 5028 Maple St | 0.75mi | 2/1.0 | 576 (+9%) | 0mo | $159,000 | $276 | 50 |
Match score weights: distance 35% · size 25% · config 20% · recency 20%. Top-matched comps best support the ARV.
Projected returns pro-forma
10.0% appreciation · 3.1% rent growth · sell at horizon
- IRR
- 52.4%
- Equity multiple
- 4.89×
- Total profit
- $81,772
- Equity at exit
- $67,566
- IRR
- 46.1%
- Equity multiple
- 10.99×
- Total profit
- $209,836
- Equity at exit
- $145,709
Cash invested: $21,000 (down + closing). Projections, not guarantees.
Landlord ↔ Tenant lean methodology
- Overall (STATE)
- 28 Tenant-Leaning
- State Washington
- 28 Tenant-Leaning · D+8
- County
- — inherits STATE
- City
- — inherits STATE
ZIP-level market 98230
- Home prices YoY
- 14.0%
- Rents YoY
- 3.1%
- Active inventory
- 454
- Price-to-rent
- 3.3×
Monthly cashflow live
- Estimated rent
- $1,902 medium interval (Pro) →
- Mortgage (P&I)
- −$393
- Tax from tax record
- −$16 /mo · $187/yr
- Insurance
- −$31
- Flood insurance flood zone
- −$427 /mo · $5,118/yr
- HOA
- −$0
- Vacancy / Maint / Mgmt
- −$399
- Net cashflow
- $636
Break-even live
UW: 25.0% down · 7.5% · 30yr · 1.5% tax · 5.0% vac · 8.0% maint · 8.0% mgmt
Financing live
Cash to close
- Down payment
- $18,750
- Closing costs
- $2,250
- Reserves months
- —
- Total cash needed
- —
Loan-product check · same deal, 3 products live
Conventional
25% down · 7.5% · 30yr
- Down + closing
- —
- Monthly P&I
- —
- Monthly cashflow
- —
- DSCR
- —
- Eligible?
- —
Personal DTI + credit; lowest rate.
DSCR
20% down · 8.5% · 30yr
- Down + closing
- —
- Monthly P&I
- —
- Monthly cashflow
- —
- DSCR
- —
- Eligible?
- —
No personal income docs; deal must DSCR.
Hard money
10% down · 12.0% · 12mo
- Down + closing
- —
- Monthly P&I
- —
- Monthly cashflow
- —
- DSCR
- —
- Eligible?
- —
Short-term bridge; refi at stabilization.
Listing history 22 events
-
2026-06-18days on market $75,000 Active 140 DOM
-
2026-06-17days on market $75,000 Active 139 DOM
-
2026-06-16days on market $75,000 Active 138 DOM
-
2026-06-15days on market $75,000 Active 137 DOM
-
2026-06-14days on market $75,000 Active 135 DOM
-
2026-06-13days on market $75,000 Active 134 DOM
-
2026-06-10days on market $75,000 Active 132 DOM
-
2026-06-09days on market $75,000 Active 131 DOM
-
2026-06-08days on market $75,000 Active 130 DOM
-
2026-06-07days on market $75,000 Active 129 DOM
-
2026-06-05days on market $75,000 Active 126 DOM
-
2026-06-02days on market $75,000 Active 124 DOM
-
2026-06-01days on market $75,000 Active 123 DOM
-
2026-05-31days on market $75,000 Active 122 DOM
-
2026-05-30days on market $75,000 Active 121 DOM
-
2026-01-29$75,000 Active
-
2023-09-15soldstatus $65,000 Closed
-
2023-08-19status Pending
-
2023-06-22status Active
-
2023-02-22status Active
-
2023-02-17status Pending
-
2022-12-07$75,000 Active
ⓘ Source: listings_history table (triggers on properties + properties_extension) + one-shot
backfill from property_details.listing_events for pre-trigger history.
Tax reassessment forecast WA · Resets to sale price
- Current annual tax
- $187 · $16/mo
- Projected year-2 tax
- $735 · $61/mo
- Expected delta
- +$548/yr (+$46/mo · 292.9%)
ⓘ Screening estimate from a state-policy table — verify with the county assessor before closing.
Climate risk First Street
- Flood 9/10 Extreme FEMA zone AE · 99% chance over 30 yrs
- Wildfire 1/10 Low
- Heat 2/10 Low 7 d/yr ≥81°F today · 18 d/yr by 30 yrs out
- Wind 1/10 Low
- Air quality 6/10 Major 7 unhealthy d/yr today · 10 by 30 yrs out
Nearby sold comps map
Loading sold comps map…
Walkable amenities ~0.75 mi
Loading nearby amenities…
Taxation est. · year 1
- Rental income
- $22,822
- − Mortgage interest
- −$4,201
- − Property taxes
- −$187
- − Insurance
- −$5,494
- − Repairs & maintenance
- −$1,826
- − Management
- −$1,826
- − Depreciation
- −$2,182
- Taxable income
- $7,107
- Est. tax owed @ 24.0%
- −$1,706
- After-tax cash flow
- $5,923/yr
For passive investors: Depreciation is non-cash, so a rental often shows a tax loss while cash-flowing — sheltering income. Rental losses are passive: they offset passive income freely, and up to $25,000/yr can offset ordinary (W-2) income if you actively participate and your MAGI is under $100k (phasing out to $0 by $150k); unused losses carry forward. On sale, claimed depreciation is recaptured at up to 25%, and gains may owe capital-gains tax (a 1031 exchange can defer both). Figures are a year-1 estimate at your 24.0% rate — not tax advice; consult a CPA.
Schools (NCES district)
- District
- Blaine School District
- NCES district ID
- 5300570
- Math proficiency
- 49% ▼ -1.00%
- Reading proficiency
- 55% ▼ -2.00%
- Median HH income
- $57,085
- Composite
- 47.05/100
- National rank
- #5128
- State rank
- #120 of 291 in WA
Livability — Birch Bay
- Score
- 62/100
- State rank
- #406
- US rank
- #16180
Category grades
Schools grade is shown separately in the Schools card above.
Census & demographics
- Census place
- Birch Bay, WA
- County
- Whatcom County · 209,776 people
- Metro
- Bellingham, WA
- Population (ZIP)
- 18,744
- Household income
- $86,623
- Rent vs Own
- Severe rent burden
- 454.0
Population outlook (Whatcom County) Hauer SSP2
- Today (2025)
- 240,408 people
- By 2030
- 254,667 · +5.9%
- By 2040
- 281,365 · +17.0%
- By 2050
- 307,592 · +27.9%
- By 2075
- 375,576 · +56.2%
- By 2100
- 421,637 · +75.4%
Race, ethnicity, and origin ACS 2023
- Neighborhood character
- Predominantly White (77%)
- Race & ethnicity
- White 77% Two or more races 11% Hispanic / Latino 9% Asian 3% Pacific Islander 2% Black 1%
- Hispanic origin (detail)
- Mexican 5%
- Common ancestry
- Portuguese 6% Iranian 4% Lithuanian 3%
- Foreign-born
- 13% · Canada, China
- Languages at home
- 89% English-only · Spanish 4% Russian/Polish/Slavic 1% Other Indo-European 1%
Political lean MEDSL · Whatcom
- 2024 margin
- Strong D (+24.9) · D 60.8% · R 35.9% · Other 3.3%
- 2008→2024 swing
- +6.9pp toward D · 2008: 18.0pp · 2024: 24.9pp
- All cycles
- 2024: D+24.9 2020: D+23.9 2016: D+17.7 2012: D+12.1 2008: D+18.0
Not yet ingested
- Civics
- —
Market trends
- HPI YoY
- ▲ 106.58%
- Current HPI
- 868.68
- Rent YoY
- ▲ 3.10%
- Metro
- Bellingham, WA
- State GDP YoY
- ▲ 4.65%
- F500 in state
- 22
Industry mix (Fortune 500 HQ in WA)
| Industry | F500 HQs | Revenue |
|---|---|---|
| Retail | 2 | $269B |
|
||
| Technology / Retail | 1 | $638B |
|
||
| Technology | 1 | $245B |
|
||
| Telecommunications | 1 | $38B |
|
||
| Food / Beverage | 1 | $36B |
|
||
| Automotive / Trucks | 1 | $34B |
|
||
Price history
+0.0% since first listed7 events — show timeline
- 2026-01-29 Listed $75,000 NWMLS as Distributed by MLS Grid
- 2023-09-15 Sold (MLS) $65,000 NWMLS as Distributed by MLS Grid
- 2023-08-19 Pending — NWMLS as Distributed by MLS Grid
- 2023-06-22 Relisted — NWMLS as Distributed by MLS Grid
- 2023-02-22 Relisted — NWMLS as Distributed by MLS Grid
- 2023-02-17 Pending — NWMLS as Distributed by MLS Grid
- 2022-12-07 Listed $75,000 NWMLS as Distributed by MLS Grid
Property tax history
+13.7%/yrLatest (2026): $187 · +383.4% YoY. Source: county tax records.
Cash-flow waterfall
monthlySold comps — $/sqft
last 12 mo · ≤1 miLoading sold comps…