 🏗️ New Construction
3035 Viceroy Ct · Poinciana, FL
Flood risk No data
- FEMA flood zone
- —
- Chance of flooding over 30 yrs
- —
- Est. flood insurance / yr
- —
Fire risk No data
- Est. fire insurance / yr
- —
Heat risk No data
- Hot days now (above threshold)
- —
- Hot days in 30 yrs
- —
Wind risk No data
- Chance of severe wind over 30 yrs
- —
Air-quality risk No data
- Unhealthy air days now
- —
- Unhealthy air days in 30 yrs
- —
Risk factors via First Street. Map © Google.
Why this score? — see what drove the D- grade
The composite is a weighted blend of 9 inputs, each scored 0–100. Each bar is that input's sub-score; the figure is the points it added to the 100-point composite (weight × sub-score).
- Cash flow +8.9/30.0
- ARV discount +7.5/15.0
- Appreciation +4.3/10.0
- Schools +3.5/10.0
- Livability +2.9/5.0
- 1% rule +2.8/10.0
- Rent growth +2.8/5.0
- DSCR +2.5/10.0
- Condition / age +2.5/5.0
$280,900
🖨 Deal sheet 📄 Offer letter ✓ Due diligence
Listing remarks
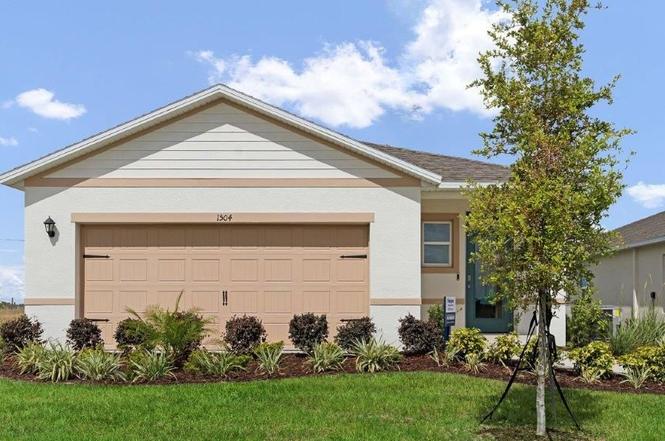
Under Construction. Welcome to Lake Deer Estates, located in the city of Poinciana. This location is conveniently located near world class attractions. Lake Deer Estates is the perfect community to call home with its beautiful Florida lifestyle and resort amenities that include a community pool, tot lot, and dog park. Let me introduce you to the 1-story Harper floor plan that is a 4 bedroom, 2 bath home with 1,665 sq ft that features block to block construction. This plan has 18x18 ceramic tile and granite countertops in all the wet areas. Whirlpool stainless steel appliances add to the feel of the home. The open floor plan seamless connects the rooms and make this home perfect for entertai
Key facts
- Dog park
- 18x18 ceramic tile
- Open floor plan
Tags
Property features AI
Finance
- Other: Home warranty included; Lease restrictions apply; Property condition: under construction; Living area source: builder; Living area about 1665 square feet; Lot approximately 0.11 acres; Permit number BR-2025-9394; CDD applies
- Financial info: Other annual assessment listed
- HOA & community: Homeowners association required (Prime Community Management; First Service Residential); Monthly HOA fee approximately $19.83 (additional association fees listed annually); Association amenities: pool, park, playground, cable TV; Community features include community mailbox, dog park, sidewalks, street lights, pool, playground
Exterior
- Parking: Attached 2-car garage
- Utilities: Public water; Public sewer; Broadband/High-speed internet available; Cable available and connected; Electricity connected; Phone available; Water connected; Sewer connected; Irrigation equipment
- Home design: Single family residence; New construction (projected completion Apr 21, 2026); One story; West-facing; Slab foundation
- Construction: Block and stucco construction; Shingle roof; Built by D.R. Horton (model: Harper); Builder license CBC1265174
- Exterior features: Covered rear porch; Exterior lighting; Sidewalks; Sliding doors; Landscaped yard; Paved surfaces; City limits location
Interior
- Kitchen: Dishwasher; Disposal; Microwave; Range; Refrigerator; Stone counters
- Bedrooms: 4 bedrooms (one-level home)
- Flooring: Carpet; Concrete
- Bathrooms: 2 full bathrooms
- Heating & cooling: Central heating (electric, heat pump); Central air conditioning
- Interior features: Open floorplan with living room/dining room combo; Stone countertops; Programmable thermostat; Walk-in closet(s); Window treatments (blinds)
- Laundry & utility: Inside laundry room; Washer; Dryer; Electric water heater
Neighborhood map
What this means for you Summary
Snapshot
- This is a 4-bed/2.0-bath land listed at $281k.
Deal economics
- At list price, monthly cash flow is $-225 ($-3k/yr) — negative.
- To cash-flow at today's rent, offer at most $241k (14.2% below list).
- To meet the 1% rule (rent ≥ 1% of price), the offer needs to be $218k (22.2% below list).
- Recommended offer: $218k (22.2% below list) — sets the bar for 1% rule.
- Cap rate 5.3% vs local median 4.3% in Poinciana — meaningfully above typical; check what's discounted (condition, days-on-market, listing class) to confirm the premium yield is real.
Location & tenants
- Location reads 57/100 on livability (#859 in FL) — a working-class tenant base; expect higher turnover. Strengths: cost of living A+, housing A+; Watch: employment D+, amenities F, commute F.
- Polk (suburban): math 39% / reading 43% proficiency, ranked #62 of 73 in FL (top 85%) — families likely to look elsewhere, expect single-tenant / working-renter base with shorter leases.
- Zoned schools: Sandhill Elementary School (math 21% / reading 37%, grade F, #1,932 of 2,144 statewide, top 91%, 991 students, 55% FRL); Haines City Senior High School (math 12% / reading 32%, grade F, #544 of 667 statewide, top 82%, 2,700 students, 58% FRL) — zoned schools at 56% FRL track the district average.
- Zoned-school proficiency averages 26% at this address vs 41% district-wide (-16 pts) — the specific schools serving this property underperform the Polk average; the district grade overstates school quality for this exact location.
- Market conditions: Rents rising (+1.1%/yr); 1151 active listings in the ZIP; 40 comparable units currently listed for rent nearby; rentals at typical pace (median 14d on market — plan ~3-4 weeks tenant-placement turnaround); 10,384 units permitted in Polk County in 2024 (1,716 in 5+ unit buildings).
- This rent runs 38% of the median local income ($69k/yr) — at the standard rent-burdened threshold; future hikes will face affordability resistance.
Forward outlook
- Local home prices are declining (-1.5%/yr); year-one equity from $2k of loan paydown is wiped out by about $4k of value loss. Plan a longer hold.
- Polk County population projected at +33% by 2050 — long-run rental-demand tailwind backs the buy-and-hold thesis.
Negotiation context
- It's been on market 101 days — a 9% lower offer ($256k) is reasonable based on typical stale-listing flexibility.
Questions for the listing agent
- What do current leases actually rent for vs. the listed asking? Can we see a recent rent roll and the last 12 months of T-12 income?
- It's been on market 101 days. Have you received any prior offers? Is the seller open to a 22% concession, seller financing, or rate buy-down credit?
- What does the HOA fee cover, when was the last increase, and are there any pending special assessments or reserve-fund shortfalls?
- Why hasn't it sold? Are there any deal-killer items the seller is aware of (foundation, flood, title, zoning, code violations)?
- Is there a deadline driving the sale (1031 exchange, divorce, estate, relocation)? That informs how much negotiation room exists.
- Schools are F-rated, which usually means shorter tenancies and higher turnover. Who's the typical renter profile here, and what's been the actual vacancy rate?
- The area grade is low — what's the realistic commute time and amenity access for the typical tenant pool here? Any planned neighborhood developments (good or bad) we should know about?
- What's the average days-on-market for RENTAL listings here right now (not sales)? A rising rental-DOM trend means longer vacancies and softer asking-rent achievability than the comps imply.
- What's the recent tenant-quality profile in this submarket — average credit score on applications, eviction rate, late-payment / NSF rate, and stable-employment percentage? A property-management company in the area should have these aggregated.
- How much new for-sale + rental construction is in the pipeline within 1–3 miles? Heavy new supply typically softens prices + rents 12–24 months out; constrained supply supports both.
Investment metrics
- 1% rule
- 0.78% ✗
- Cap rate
- 5.33%
- Cash-on-cash
- -3.44%
- DSCR
- 0.85
- GRM
- 10.7
CMA / ARV
No comps found within radius.
Projected returns pro-forma
-1.48% appreciation · 1.14% rent growth · sell at horizon
- IRR
- -14.3%
- Equity multiple
- 0.42×
- Total profit
- $-45,486
- Equity at exit
- $61,411
- IRR
- -9.3%
- Equity multiple
- 0.28×
- Total profit
- $-56,976
- Equity at exit
- $59,183
Cash invested: $78,652 (down + closing). Projections, not guarantees.
Landlord ↔ Tenant lean methodology
- Overall (STATE)
- 87 Strongly Landlord-Friendly
- State Florida
- 87 Strongly Landlord-Friendly · R+3
- County
- — inherits STATE
- City
- — inherits STATE
ZIP-level market 34759
- Home prices YoY
- -0.5%
- Rents YoY
- 1.1%
- Active inventory
- 1151
- Price-to-rent
- 10.7×
Monthly cashflow live
- Estimated rent
- $2,185 high interval (Pro) →
- Mortgage (P&I)
- −$1,473
- Tax from tax record
- −$252 /mo · $3,025/yr
- Insurance
- −$117
- HOA
- −$109
- Vacancy / Maint / Mgmt
- −$459
- Net cashflow
- $-225
Break-even live
UW: 25.0% down · 7.5% · 30yr · 1.5% tax · 5.0% vac · 8.0% maint · 8.0% mgmt
Financing live
Cash to close
- Down payment
- $70,225
- Closing costs
- $8,427
- Reserves months
- —
- Total cash needed
- —
Loan-product check · same deal, 3 products live
Conventional
25% down · 7.5% · 30yr
- Down + closing
- —
- Monthly P&I
- —
- Monthly cashflow
- —
- DSCR
- —
- Eligible?
- —
Personal DTI + credit; lowest rate.
DSCR
20% down · 8.5% · 30yr
- Down + closing
- —
- Monthly P&I
- —
- Monthly cashflow
- —
- DSCR
- —
- Eligible?
- —
No personal income docs; deal must DSCR.
Hard money
10% down · 12.0% · 12mo
- Down + closing
- —
- Monthly P&I
- —
- Monthly cashflow
- —
- DSCR
- —
- Eligible?
- —
Short-term bridge; refi at stabilization.
Rent comps 40 comps
| Address | Beds | Baths | Sqft | Rent | $/sqft | DOM | Units | Dist |
|---|---|---|---|---|---|---|---|---|
| 3630 Walking Stick Way Kissimmee, FL | 4.0 | 3.0 | 1999 | $2,150 | $1.08 | 23d | 1 | 0.24mi |
| 2004 Red Fox Ln Kissimmee, FL | 3.0–4.0 | 2.0 | 2186 | $2,399 | $1.10 | 2d | 10 | 0.24mi |
| 237 Cimarron Dr Kissimmee, FL | 3.0 | 2.0 | 1560 | $1,950 | $1.25 | 23d | 1 | 0.32mi |
| 3181 Viceroy Ct Kissimmee, FL | 4.0 | 2.0 | 1610 | $1,900 | $1.18 | 3d | 1 | 0.33mi |
| 245 Cimarron Dr Kissimmee, FL | 3.0 | 2.0 | 1245 | $2,125 | $1.71 | 23d | 1 | 0.34mi |
| 217 Cimarron Dr Kissimmee, FL | 4.0 | 2.0 | 1670 | $2,085 | $1.25 | 18d | 1 | 0.37mi |
| 157 Cimarron Ln Kissimmee, FL | 4.0 | 2.0 | 2097 | $2,000 | $0.95 | 3d | 1 | 0.38mi |
| 377 Cimarron Ct Kissimmee, FL | 4.0 | 3.0 | 1999 | $1,950 | $0.98 | 11d | 1 | 0.48mi |
| 423 Churchill Ct Kissimmee, FL | 4.0 | 2.5 | 1711 | $1,975 | $1.15 | 23d | 1 | 0.54mi |
| 935 Cumberland Dr Kissimmee, FL | 3.0 | 2.0 | 1260 | $1,599 | $1.27 | 13d | 1 | 0.66mi |
| 943 Cumberland Dr Poinciana, FL | 3.0 | 2.0 | 1288 | $1,695 | $1.32 | 23d | 1 | 0.69mi |
| 642 Desmoines Ct Kissimmee, FL | 4.0 | 2.5 | 1826 | $1,975 | $1.08 | 3d | 1 | 0.73mi |
| 802 James Dr Kissimmee, FL | 4.0 | 2.0 | 1670 | $2,090 | $1.25 | 11d | 1 | 0.75mi |
| 733 James Ct Kissimmee, FL | 3.0 | 2.5 | 2040 | $2,350 | $1.15 | 23d | 1 | 0.85mi |
| 1167 Nelson Meadow Ln Kissimmee, FL | 4.0 | 3.0 | 1868 | $1,875 | $1.00 | 14d | 1 | 0.91mi |
| 1160 Nelson Meadow Ln Kissimmee, FL | 4.0 | 2.0 | 2168 | $4,500 | $2.08 | 23d | 1 | 0.95mi |
| 1144 Nelson Meadow Ln Kissimmee, FL | 3.0 | 2.0 | 1288 | $1,795 | $1.39 | 23d | 1 | 0.98mi |
| 1142 Nelson Meadow Ln Kissimmee, FL | 3.0 | 2.0 | 1288 | $1,700 | $1.32 | 23d | 1 | 0.99mi |
| 994 James Dr Kissimmee, FL | 4.0 | 2.0 | 1661 | $1,825 | $1.10 | 23d | 1 | 0.99mi |
| 1157 Hudson Harbor Ln Kissimmee, FL | 4.0 | 2.0 | 1626 | $1,850 | $1.14 | 23d | 1 | 1.06mi |
| 650 Hudson Valley Dr Kissimmee, FL | 4.0 | 2.0 | 1580 | $1,734 | $1.10 | 3d | 1 | 1.07mi |
| 2129 Hibiscus Pl Kissimmee, FL | 4.0 | 2.0 | 1765 | $2,100 | $1.19 | 3d | 1 | 1.16mi |
| 1019 N Platte Way Kissimmee, FL | 3.0 | 2.0 | 1461 | $1,595 | $1.09 | 23d | 1 | 1.16mi |
| 260 Hyacinth Ct Kissimmee, FL | 4.0 | 2.0 | 1400 | $1,765 | $1.26 | 23d | 1 | 1.21mi |
| 344 Hibiscus Dr Kissimmee, FL | 4.0 | 2.0 | 1670 | $1,825 | $1.09 | 3d | 1 | 1.23mi |
| 1388 N Platte Ct Kissimmee, FL | 3.0 | 2.0 | 1830 | $1,850 | $1.01 | 10d | 1 | 1.24mi |
| 108 Tulip Ln Kissimmee, FL | 4.0 | 2.0 | 1612 | $2,000 | $1.24 | 14d | 1 | 1.25mi |
| 119 Tulip Ln Kissimmee, FL | 4.0 | 2.0 | 1670 | $2,095 | $1.25 | 23d | 1 | 1.26mi |
| 263 Gladiola Ct Kissimmee, FL | 4.0 | 2.0 | 1605 | $1,750 | $1.09 | 14d | 1 | 1.26mi |
| 337 Hibiscus Dr Kissimmee, FL | 4.0 | 2.0 | 1670 | $1,980 | $1.19 | 13d | 1 | 1.27mi |
| 260 Gladiola Ct Kissimmee, FL | 4.0 | 2.0 | 1670 | $2,065 | $1.24 | 3d | 1 | 1.29mi |
| 325 Hibiscus Dr Kissimmee, FL | 4.0 | 2.0 | 1605 | $1,995 | $1.24 | 3d | 1 | 1.30mi |
| 207 Gladiola Ct Kissimmee, FL | 4.0 | 2.0 | 1605 | $1,855 | $1.16 | 3d | 1 | 1.35mi |
| 210 Goldenrod Ln Kissimmee, FL | 4.0 | 2.0 | 1626 | $1,875 | $1.15 | 23d | 1 | 1.37mi |
| 1110 Chervil Dr Kissimmee, FL | 3.0 | 2.5 | 2110 | $1,575 | $0.75 | 23d | 1 | 1.42mi |
| 1130 Chervil Dr Kissimmee, FL | 3.0 | 2.5 | 1495 | $1,575 | $1.05 | 23d | 1 | 1.42mi |
| 204 Fig Ct Kissimmee, FL | 4.0 | 2.5 | 1823 | $2,080 | $1.14 | 23d | 1 | 1.46mi |
| 316 Fern Ct Kissimmee, FL | 4.0 | 2.0 | 1605 | $1,775 | $1.11 | 3d | 1 | 1.47mi |
| 1282 Clove Dr Kissimmee, FL | 4.0 | 2.5 | 1906 | $1,600 | $0.84 | 3d | 1 | 1.48mi |
| 216 Fig Ct Kissimmee, FL | 4.0 | 2.5 | 1823 | $2,080 | $1.14 | 14d | 1 | 1.48mi |
HOA detail
- Monthly dues
- $109 · $1,308/yr
- Likely covers
- pool
Listing history 16 events
-
2026-06-18days on market $280,900 Active 101 DOM
-
2026-06-17days on market $280,900 Active 100 DOM
-
2026-06-16days on market $280,900 Active 99 DOM
-
2026-06-15days on market $280,900 Active 98 DOM
-
2026-06-13pricedays on market $280,900 Active 96 DOM
-
2026-06-10pricedays on market $286,900 Active 93 DOM
-
2026-06-09days on market $284,900 Active 92 DOM
-
2026-06-08days on market $284,900 Active 91 DOM
-
2026-06-07days on market $284,900 Active 90 DOM
-
2026-06-05days on market $284,900 Active 87 DOM
-
2026-06-03days on market $284,900 Active 85 DOM
-
2026-06-01days on market $284,900 Active 84 DOM
-
2026-05-31days on market $284,900 Active 83 DOM
-
2026-04-20price $282,090
-
2026-04-17price $280,090
-
2026-03-09$282,990 Active
ⓘ Source: listings_history table (triggers on properties + properties_extension) + one-shot
backfill from property_details.listing_events for pre-trigger history.
Tax reassessment forecast FL · Resets to sale price
- Current annual tax
- $3,025 · $252/mo
- Projected year-2 tax
- $3,025 · $252/mo
- Expected delta
- $0/yr ($0/mo · 0.0%)
ⓘ Screening estimate from a state-policy table — verify with the county assessor before closing.
Nearby sold comps map
Loading sold comps map…
Walkable amenities ~0.75 mi
Loading nearby amenities…
Taxation est. · year 1
- Rental income
- $26,216
- − Mortgage interest
- −$15,735
- − Property taxes
- −$3,025
- − Insurance
- −$1,404
- − Repairs & maintenance
- −$2,097
- − Management
- −$2,097
- − HOA
- −$1,308
- − Depreciation
- −$8,172
- Taxable loss
- −$7,622
- Est. tax savings @ 24.0%
- +$1,829
- After-tax cash flow
- $-874/yr
For passive investors: Depreciation is non-cash, so a rental often shows a tax loss while cash-flowing — sheltering income. Rental losses are passive: they offset passive income freely, and up to $25,000/yr can offset ordinary (W-2) income if you actively participate and your MAGI is under $100k (phasing out to $0 by $150k); unused losses carry forward. On sale, claimed depreciation is recaptured at up to 25%, and gains may owe capital-gains tax (a 1031 exchange can defer both). Figures are a year-1 estimate at your 24.0% rate — not tax advice; consult a CPA.
Schools (NCES district)
- District
- Polk
- NCES district ID
- 1201590
- Math proficiency
- 39% ▼ -11.00%
- Reading proficiency
- 43% ▼ -4.00%
- Median HH income
- $43,979
- Composite
- 34.74/100
- National rank
- #5132
- State rank
- #62 of 73 in FL
Livability — Poinciana
- Score
- 57/100
- State rank
- #859
- US rank
- #21760
Category grades
Schools grade is shown separately in the Schools card above.
Census & demographics
- Census place
- Poinciana, FL
- County
- Polk County · 740,051 people
- City population
- 91,336
- Metro
- Lakeland-Winter Haven, FL
- Population (ZIP)
- 44,568
- Household income
- $69,373
- Rent vs Own
- Severe rent burden
- 1186.0
Population outlook (Polk County) Hauer SSP2
- Today (2025)
- 752,975 people
- By 2030
- 804,621 · +6.9%
- By 2040
- 906,117 · +20.3%
- By 2050
- 1,000,476 · +32.9%
- By 2075
- 1,197,520 · +59.0%
- By 2100
- 1,271,518 · +68.9%
Race, ethnicity, and origin ACS 2023
- Neighborhood character
- Diverse neighborhood (Simpson 0.62)
- Race & ethnicity
- Hispanic / Latino 55% White 21% Two or more races 20% Black 19%
- Hispanic origin (detail)
- Mexican 2% Puerto Rican 38% Cuban 6% Dominican 3%
- Common ancestry
- Hispanic 3% Romanian 2% Scotch-Irish 1%
- Foreign-born
- 17% · Canada, Jamaica
- Languages at home
- 49% English-only · Spanish 48% French/Haitian/Cajun 2%
Political lean MEDSL · Polk
- 2024 margin
- Strong R (+20.7) · D 39.2% · R 59.9%
- 2008→2024 swing
- -14.6pp toward R · 2008: -6.1pp · 2024: -20.7pp
- All cycles
- 2024: R+20.7 2020: R+14.4 2016: R+14.1 2012: R+6.8 2008: R+6.1
Not yet ingested
- Civics
- —
Market trends
- HPI YoY
- ▼ -1.48%
- Current HPI
- 276.6861
- Rent YoY
- ▲ 1.14%
- Metro
- Lakeland-Winter Haven, FL
- State GDP YoY
- ▲ 3.28%
- F500 in state
- 36
Industry mix (Fortune 500 HQ in FL)
| Industry | F500 HQs | Revenue |
|---|---|---|
| Industrial Technology | 2 | $29B |
|
||
| Insurance | 2 | $17B |
|
||
| Retail | 1 | $60B |
|
||
| Technology Distribution | 1 | $58B |
|
||
| Homebuilding | 1 | $35B |
|
||
| Technology Manufacturing | 1 | $35B |
|
||
Price history
-0.3% since first listed3 events — show timeline
- 2026-04-20 Price Changed $282,090 Stellar MLS as Distributed by MLS Grid
- 2026-04-17 Price Changed $280,090 Stellar MLS as Distributed by MLS Grid
- 2026-03-09 Listed $282,990 Stellar MLS as Distributed by MLS Grid
Property tax history
+4.8%/yrLatest (2025): $3,025 · +4.8% YoY. Source: county tax records.
Cash-flow waterfall
monthlySold comps — $/sqft
last 12 mo · ≤1 miLoading sold comps…