 7-Plex
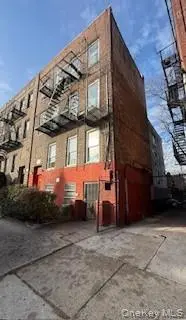
4383 Matilda Ave · New York, NY
Flood risk 1/10 · Minimal
- FEMA flood zone
- X (unshaded)
- Chance of flooding over 30 yrs
- 0.0%
- Est. flood insurance / yr
- $507 – $1,088
Fire risk 1/10 · Minimal
- Est. fire insurance / yr
- $691 – $1,283
Heat risk 6/10 · Moderate
- Hot days now (above 99°F)
- 7 days/yr
- Hot days in 30 yrs
- 15 days/yr
Wind risk 6/10 · Moderate
- Chance of severe wind over 30 yrs
- 27.0%
Air-quality risk 3/10 · Minor
- Unhealthy air days now
- 3 days/yr
- Unhealthy air days in 30 yrs
- 4 days/yr
Risk factors via First Street. Map © Google.
Why this score? — see what drove the C grade
The composite is a weighted blend of 9 inputs, each scored 0–100. Each bar is that input's sub-score; the figure is the points it added to the 100-point composite (weight × sub-score).
- Cash flow +23.3/30.0
- DSCR +7.5/10.0
- ARV discount +7.5/15.0
- 1% rule +6.5/10.0
- Schools +5.0/10.0
- Livability +3.8/5.0
- Rent growth +2.5/5.0
- Condition / age +2.5/5.0
- Appreciation +0.0/10.0
$1,555,000
🖨 Deal sheet 📄 Offer letter ✓ Due diligence
Multi-family units
County records classify this as Multi-Family (5+ Unit). Listing-text estimate: 7 units. confirmed
5+ unit building — per-unit beds/baths from public records are typically unavailable; the breakdown below (if shown) is an estimate from the listing text.
Listing remarks
Prime Wakefield Investment — 7-Unit Income-Producing Property Near Transit. Exceptional opportunity to own a brick 3-story multifamily building in the Wakefield section of the Bronx—one of the city’s strongest and most consistent rental markets. 7 total income-generating units, including: • Five 2-bedroom apartments • One 1-bedroom apartment • Bonus 2-bedroom unit in the basement Perfect for investors seeking strong cash flow, portfolio expansion, or owner-occupants looking to offset living costs with rental income. • Gross Rental Income: $169,020 annually • Total Expenses: $58,427.72 • Net Operating Income (NOI): $110,592.28 • Cap Rate:
Key facts
- 2,500 sq ft lot
- Built 1930
- Listed 72 days
Property features AI
Finance
- Other:
- Financial info:
- HOA & community:
Exterior
- Parking: On-street parking
- Security:
- Utilities: Public sewer; Electricity connected; Natural gas connected; Public trash collection; Water connected
- Home design: Quadruplex
- Construction:
- Exterior features: Brick construction; Not waterfront
Interior
- Kitchen:
- Bedrooms:
- Flooring:
- Bathrooms:
- Heating & cooling: Oil heating; Wall/window air conditioning units
- Interior features: Washer/dryer hookups; Finished walk-out basement
- Laundry & utility: Common area laundry
Neighborhood map
What this means for you Summary
Snapshot
- This is a 6×2bd/1ba + 1×1bd/1ba units multifamily listed at $1.55M.
Deal economics
- At list price, monthly cash flow is $3k ($34k/yr) — positive. Per door: $406/mo.
- The deal already cash-flows at list — no discount required.
- Meets the 1% rule at list price ($18k rent vs $1.55M).
- Recommended offer: $1.46M (6.0% below list) — sets the bar for market timing.
- Cap rate 8.5% vs local median 2.6% in New York — top-decile yield for the area; either an underpriced asset or a hidden risk that comps aren't pricing in. Stress-test before assuming the spread holds.
Location & tenants
- Location reads 75/100 on livability (#268 in NY, #4,188 nationally) — a middle-class / working-renter tenant base. Strengths: amenities A+, commute A+, health & safety A; Watch: crime F, cost of living F.
- Market conditions: 161 active listings in the ZIP; 6,929 units permitted in Bronx County in 2024 (6,829 in 5+ unit buildings).
- At $17,859/mo this rent would consume 325% of the median local household income ($66k/yr) (locally 4791% of renters already pay >50% of income on rent) — very limited rent-growth headroom before tenants either downsize or default.
Forward outlook
- Local home prices are declining (-3.0%/yr); year-one equity from $11k of loan paydown is wiped out by about $47k of value loss. Plan a longer hold.
- Bronx County population projected at +21% by 2050 — long-run rental-demand tailwind backs the buy-and-hold thesis.
Negotiation context
- It's been on market 72 days — a 6% lower offer ($1.46M) is reasonable based on typical stale-listing flexibility.
- 4 sale attempts since 3y ago with the ask held roughly flat each time — persistent listings suggest the price (not the market) is what's stuck; bring a comps-based counter.
- Current owner paid $365k; list at $1.55M implies a 326% gain — meaningful room to come down on a strong offer.
Risks & watch-outs
- Watch-outs: built in 1930 — expect roof / HVAC / electrical / plumbing capex.
- Climate carrying-cost: major wind risk, 27% chance of damaging wind over 30y; extreme-heat days projected 7→15/yr by 2055 (HVAC capex compounding) — expect insurance premiums to compound above CPI over the hold.
Questions for the listing agent
- It's been on market 72 days. Have you received any prior offers? Is the seller open to a 6% concession, seller financing, or rate buy-down credit?
- Can we see the unit-by-unit rent roll, current vacancy, and any below-market leases? What's the average tenancy length?
- What capital expenditures (roof, boiler, parking lot, exteriors) have been made in the last 5 years, and what's planned in the next 2?
- Built in 1930 — when were the roof, HVAC, electrical panel, plumbing, and water heater last replaced?
- Why hasn't it sold? Are there any deal-killer items the seller is aware of (foundation, flood, title, zoning, code violations)?
- Is there a deadline driving the sale (1031 exchange, divorce, estate, relocation)? That informs how much negotiation room exists.
- Schools are B-rated — typically a magnet for longer-tenancy family renters. What's the average tenant stay here, and is there a school-zone premium baked into asking?
- Crime grade is F in this area — have there been break-ins, vandalism, or insurance claims at this property in the last 3 years? What carrier currently insures it and at what premium?
- What's the average days-on-market for RENTAL listings here right now (not sales)? A rising rental-DOM trend means longer vacancies and softer asking-rent achievability than the comps imply.
- What's the recent tenant-quality profile in this submarket — average credit score on applications, eviction rate, late-payment / NSF rate, and stable-employment percentage? A property-management company in the area should have these aggregated.
- How much new apartment / multifamily construction is in the pipeline within 1–3 miles? Heavy new supply (>2% of stock underway) typically softens rents 12–24 months out; light construction supports rent growth.
Investment metrics
- 1% rule
- 1.15% ✓
- Cap rate
- 8.49%
- Cash-on-cash
- 7.84%
- DSCR
- 1.35
- GRM
- 7.3
CMA / ARV
No comps found within radius.
Projected returns pro-forma
-3.0% appreciation · 3.0% rent growth · sell at horizon
- IRR
- -4.3%
- Equity multiple
- 0.84×
- Total profit
- $-70,225
- Equity at exit
- $231,856
- IRR
- 5.4%
- Equity multiple
- 1.40×
- Total profit
- $174,516
- Equity at exit
- $134,448
Cash invested: $435,400 (down + closing). Projections, not guarantees.
Landlord ↔ Tenant lean methodology
- Overall (CITY)
- 0 Strongly Tenant-Friendly
- State New York
- 15 Strongly Tenant-Friendly · D+10
- County
- — inherits STATE
- City New York
- 0 Strongly Tenant-Friendly · D+34
ZIP-level market 10466
- Active inventory
- 161
- Price-to-rent
- 50.3×
Monthly cashflow live
- Estimated rent
- $17,859 high interval (Pro) →
- Mortgage (P&I)
- −$8,155
- Tax from tax record
- −$2,462 /mo · $29,540/yr
- Insurance
- −$648
- HOA
- −$0
- Vacancy / Maint / Mgmt
- −$3,750
- Net cashflow
- $2,844
Break-even live
7-unit breakdown (identical units grouped — click to expand)
| Units | Beds | Baths | Est. rent |
|---|---|---|---|
| 6× units | 2 | 1 | $15,456 |
| #1 | 2 | 1 | $2,576 |
| #2 | 2 | 1 | $2,576 |
| #3 | 2 | 1 | $2,576 |
| #4 | 2 | 1 | $2,576 |
| #5 | 2 | 1 | $2,576 |
| #7 | 2 | 1 | $2,576 |
| 1× unit | 1 | 1 | $2,400 |
| Total (7 units) | $17,859 | ||
UW: 25.0% down · 7.5% · 30yr · 1.5% tax · 5.0% vac · 8.0% maint · 8.0% mgmt
Financing live
Cash to close
- Down payment
- $388,750
- Closing costs
- $46,650
- Reserves months
- —
- Total cash needed
- —
Loan-product check · same deal, 3 products live
Conventional
25% down · 7.5% · 30yr
- Down + closing
- —
- Monthly P&I
- —
- Monthly cashflow
- —
- DSCR
- —
- Eligible?
- —
Personal DTI + credit; lowest rate.
DSCR
20% down · 8.5% · 30yr
- Down + closing
- —
- Monthly P&I
- —
- Monthly cashflow
- —
- DSCR
- —
- Eligible?
- —
No personal income docs; deal must DSCR.
Hard money
10% down · 12.0% · 12mo
- Down + closing
- —
- Monthly P&I
- —
- Monthly cashflow
- —
- DSCR
- —
- Eligible?
- —
Short-term bridge; refi at stabilization.
Listing history 26 events
-
2026-06-18days on market $1,555,000 Active 72 DOM
-
2026-06-17days on market $1,555,000 Active 71 DOM
-
2026-06-15days on market $1,555,000 Active 69 DOM
-
2026-06-13days on market $1,555,000 Active 67 DOM
-
2026-06-10days on market $1,555,000 Active 63 DOM
-
2026-06-08days on market $1,555,000 Active 62 DOM
-
2026-06-08days on market $1,555,000 Active 61 DOM
-
2026-06-04days on market $1,555,000 Active 58 DOM
-
2026-06-03days on market $1,555,000 Active 57 DOM
-
2026-06-01days on market $1,555,000 Active 55 DOM
-
2026-05-31days on market $1,555,000 Active 54 DOM
-
2026-04-07$1,555,000 Active
-
2026-04-07historical
-
2026-02-02price $1,650,000
-
2025-12-10$1,800,000 Active
-
2023-07-01$1,650,000 Active
-
2023-06-27historical
-
2023-06-20historical
-
2023-05-05price $1,699,000
-
2023-03-31$1,890,000 Active
-
2002-09-18soldstatus $365,000
-
2000-02-25soldstatus $282,000
-
1994-02-01soldstatus $240,000
-
1990-02-13soldstatus $240,000
-
1987-07-28soldstatus $97,500
-
1986-06-10soldstatus $100,000
ⓘ Source: listings_history table (triggers on properties + properties_extension) + one-shot
backfill from property_details.listing_events for pre-trigger history.
Tax reassessment forecast NY · Partial reset (capped growth)
- Current annual tax
- $29,540 · $2,462/mo
- Projected year-2 tax
- $29,540 · $2,462/mo
- Expected delta
- $0/yr ($0/mo · 0.0%)
ⓘ Screening estimate from a state-policy table — verify with the county assessor before closing.
Climate risk First Street
- Flood 1/10 Low FEMA zone X (unshaded) · 0% chance over 30 yrs
- Wildfire 1/10 Low
- Heat 6/10 Major 7 d/yr ≥99°F today · 15 d/yr by 30 yrs out
- Wind 6/10 Major 27% chance of damaging wind over 30 yrs
- Air quality 3/10 Moderate 3 unhealthy d/yr today · 4 by 30 yrs out
Nearby sold comps map
Loading sold comps map…
Walkable amenities ~0.75 mi
Loading nearby amenities…
Taxation est. · year 1
- Rental income
- $214,308
- − Mortgage interest
- −$87,104
- − Property taxes
- −$29,540
- − Insurance
- −$7,775
- − Repairs & maintenance
- −$17,145
- − Management
- −$17,145
- − Depreciation
- −$45,236
- Taxable income
- $10,363
- Est. tax owed @ 24.0%
- −$2,487
- After-tax cash flow
- $31,646/yr
For passive investors: Depreciation is non-cash, so a rental often shows a tax loss while cash-flowing — sheltering income. Rental losses are passive: they offset passive income freely, and up to $25,000/yr can offset ordinary (W-2) income if you actively participate and your MAGI is under $100k (phasing out to $0 by $150k); unused losses carry forward. On sale, claimed depreciation is recaptured at up to 25%, and gains may owe capital-gains tax (a 1031 exchange can defer both). Figures are a year-1 estimate at your 24.0% rate — not tax advice; consult a CPA.
Schools (NCES district)
No district data.
Livability — New York
- Score
- 75/100
- State rank
- #268
- US rank
- #4188
Category grades
Schools grade is shown separately in the Schools card above.
Census & demographics
- Census place
- New York, NY
- County
- Bronx County · 1,197,324 people
- City population
- 7,731,280
- Metro
- New York-Newark-Jersey City, NY-NJ-PA
- Population (ZIP)
- 71,116
- Household income
- $65,969
- Rent vs Own
- Severe rent burden
- 4791.0
Population outlook (Bronx County) Hauer SSP2
- Today (2025)
- 1,607,353 people
- By 2030
- 1,681,852 · +4.6%
- By 2040
- 1,824,421 · +13.5%
- By 2050
- 1,945,470 · +21.0%
- By 2075
- 2,187,887 · +36.1%
- By 2100
- 2,244,136 · +39.6%
Race, ethnicity, and origin ACS 2023
- Neighborhood character
- Diverse neighborhood (Simpson 0.55)
- Race & ethnicity
- Black 60% Hispanic / Latino 29% Two or more races 7% White 2% Asian 2% Native American 1%
- Hispanic origin (detail)
- Mexican 3% Puerto Rican 9% Dominican 12%
- Common ancestry
- Hispanic 1%
- Foreign-born
- 42% · Canada, Jamaica, United Kingdom
- Languages at home
- 67% English-only · Spanish 22% French/Haitian/Cajun 1% Other Indo-European 1%
Political lean MEDSL · Bronx
- 2024 margin
- Solid D (+45.4) · D 72.7% · R 27.3%
- 2008→2024 swing
- -32.3pp toward R · 2008: 77.8pp · 2024: 45.4pp
- All cycles
- 2024: D+45.4 2020: D+67.6 2016: D+79.1 2012: D+82.9 2008: D+77.8
Not yet ingested
- Civics
- —
Market trends
- HPI YoY
- ▼ -314.77%
- Current HPI
- 349.542
- Rent YoY
- —
- Metro
- New York-Newark-Jersey City, NY-NJ-PA
- State GDP YoY
- ▲ 2.60%
- F500 in state
- 92
Industry mix (Fortune 500 HQ in NY)
| Industry | F500 HQs | Revenue |
|---|---|---|
| Financial Services | 10 | $950B |
|
||
| Consumer Goods | 9 | $162B |
|
||
| Insurance | 4 | $225B |
|
||
| Telecommunications | 2 | $144B |
|
||
| Pharmaceuticals | 2 | $112B |
|
||
| Media / Entertainment | 2 | $69B |
|
||
Price history
+1455.0% since first listed15 events — show timeline
- 2026-04-07 Listing Removed — OneKey® MLS as Distributed by MLS Grid
- 2026-04-07 Listed $1,555,000 OneKey® MLS as Distributed by MLS Grid
- 2026-02-02 Price Changed $1,650,000 OneKey® MLS as Distributed by MLS Grid
- 2025-12-10 Listed $1,800,000 OneKey® MLS as Distributed by MLS Grid
- 2023-07-01 Listed $1,650,000 OneKey® MLS as Distributed by MLS Grid
- 2023-06-27 Coming Soon — OneKey® MLS as Distributed by MLS Grid
- 2023-06-20 Listing Removed — OneKey® MLS as Distributed by MLS Grid
- 2023-05-05 Price Changed $1,699,000 OneKey® MLS as Distributed by MLS Grid
- 2023-03-31 Listed $1,890,000 OneKey® MLS as Distributed by MLS Grid
- 2002-09-18 Sold (Public Records) $365,000 Public Records
- 2000-02-25 Sold (Public Records) $282,000 Public Records
- 1994-02-01 Sold (Public Records) $240,000 Public Records
- 1990-02-13 Sold (Public Records) $240,000 Public Records
- 1987-07-28 Sold (Public Records) $97,500 Public Records
- 1986-06-10 Sold (Public Records) $100,000 Public Records
Property tax history
+5.2%/yrLatest (2025): $29,540 · +3.2% YoY. Source: county tax records.
Cash-flow waterfall
monthlySold comps — $/sqft
last 12 mo · ≤1 miLoading sold comps…