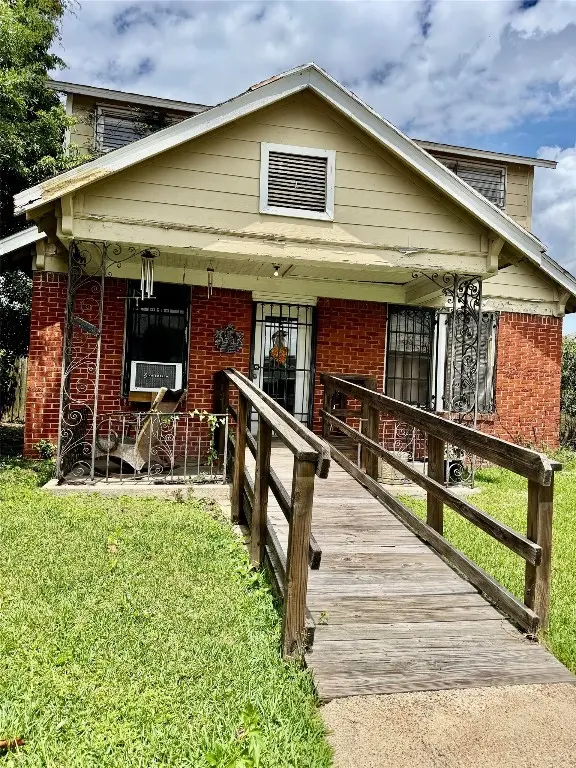
105 Dresden St · Houston, TX
Flood risk 5/10 · Moderate
- FEMA flood zone
- X (unshaded)
- Chance of flooding over 30 yrs
- 0.24%
- Est. flood insurance / yr
- $507 – $1,088
Fire risk 1/10 · Minimal
- Est. fire insurance / yr
- $1,222 – $2,270
Heat risk 9/10 · Severe
- Hot days now (above 109°F)
- 7 days/yr
- Hot days in 30 yrs
- 24 days/yr
Wind risk 9/10 · Severe
- Chance of severe wind over 30 yrs
- 99.0%
Air-quality risk 2/10 · Minimal
- Unhealthy air days now
- 2 days/yr
- Unhealthy air days in 30 yrs
- 2 days/yr
Risk factors via First Street. Map © Google.
Why this score? — see what drove the B- grade
The composite is a weighted blend of 9 inputs, each scored 0–100. Each bar is that input's sub-score; the figure is the points it added to the 100-point composite (weight × sub-score).
- Cash flow +21.3/30.0
- ARV discount +15.0/15.0
- 1% rule +6.9/10.0
- DSCR +6.8/10.0
- Appreciation +4.0/10.0
- Livability +3.7/5.0
- Schools +2.7/10.0
- Rent growth +2.5/5.0
- Condition / age +2.5/5.0
$169,500
🖨 Deal sheet 📄 Offer letter ✓ Due diligence
Listing remarks
Fantastic investment opportunity in desirable East End location. This 3 bedroom, 1 bath home, and an extra large room that can be used as a 4 bedroom or game room, boasts 1792 sqft a rare find, a 2 car garage, and carport. Perfect for investors seeking a full remodel or rental property. With a little TLC, this home can be restored to its original charm. All utilities are active. Conveniently located near I-45, I-610, University of Houston, Mason Park, and shopping.
Key facts
- Active utilities
- Near i-45
- Full remodel
Tags
Property features AI
Exterior
- Parking: Attached carport; Detached carport; Converted garage; Garage (2-car); Carport with 2 spaces; Alley access
- Utilities: Public water; Public sewer
- Home design: Residential property; Built in 1930
- Construction: Brick construction; Block foundation; Composition roof
- Exterior features: Concrete road surface; Located in a subdivision
Interior
- Kitchen: Gas range
- Bedrooms: Two bedrooms on the first floor; One bedroom on the second floor
- Bathrooms: 1 full bathroom
- Heating & cooling: Window unit heating; Window unit cooling
- Interior features: Bonus room on the second floor; Total of 4 rooms
- Laundry & utility: Washer hookup; Gas dryer hookup
Neighborhood map
What this means for you Summary
Snapshot
- This is a 4-bed/1.0-bath single-family listed at $170k.
Deal economics
- At list price, monthly cash flow is $249 ($3k/yr) — positive.
- The deal already cash-flows at list — no discount required.
- Meets the 1% rule at list price ($2k rent vs $170k).
- Recommended offer: $164k (3.0% below list) — sets the bar for market timing.
- Cap rate 8.1% vs local median 3.2% in Houston — top-decile yield for the area; either an underpriced asset or a hidden risk that comps aren't pricing in. Stress-test before assuming the spread holds.
Location & tenants
- Location reads 74/100 on livability (#184 in TX, #4,771 nationally) — a middle-class / working-renter tenant base. Strengths: amenities A+, cost of living A+, housing A+; Watch: crime F.
- Houston ISD (urban): math 27% / reading 35% proficiency, ranked #593 of 826 in TX (top 72%) — families likely to look elsewhere, expect single-tenant / working-renter base with shorter leases; 71% free/reduced lunch — lower-income household profile, screen leases tightly.
- Zoned schools: Edison Middle (math 12% / reading 16%, grade F, #1,596 of 1,662 statewide, top 96%, 460 students, 96% FRL); Milby H S (math 28% / reading 38%, grade F, #1,023 of 1,632 statewide, top 63%, 2,107 students, 93% FRL) — zoned schools average 95% FRL vs 71% district-wide (23 pts higher); higher-poverty schools than district average — tighter screening recommended.
- Market conditions: 74 active listings in the ZIP; 4 comparable units currently listed for rent nearby; rentals lingering (median 44d on market — plan ~5-8 weeks vacancy on turnover, expect pricing pressure); 50% of comp listings sitting > 30 days — soft ceiling on asking rent; 29,883 units permitted in Harris County in 2024 (8,621 in 5+ unit buildings).
Forward outlook
- Local home prices are declining (-2.1%/yr); year-one equity from $1k of loan paydown is wiped out by about $4k of value loss. Plan a longer hold.
- Harris County population projected at +47% by 2050 — long-run rental-demand tailwind backs the buy-and-hold thesis.
Negotiation context
- It's been on market 55 days — a 3% lower offer ($164k) is reasonable based on typical stale-listing flexibility.
Risks & watch-outs
- Watch-outs: property tax is 2.7% of price; built in 1930 — expect roof / HVAC / electrical / plumbing capex.
- Climate carrying-cost: moderate flood risk; severe wind risk, 99% chance of damaging wind over 30y; extreme-heat days projected 7→24/yr by 2055 (HVAC capex compounding) — expect insurance premiums to compound above CPI over the hold.
Questions for the listing agent
- It's been on market 55 days. Have you received any prior offers? Is the seller open to a 3% concession, seller financing, or rate buy-down credit?
- Built in 1930 — when were the roof, HVAC, electrical panel, plumbing, and water heater last replaced?
- Property tax is high relative to price — has the assessment been appealed recently, and will the sale trigger a re-assessment?
- Is there a deadline driving the sale (1031 exchange, divorce, estate, relocation)? That informs how much negotiation room exists.
- Schools are D-rated, which usually means shorter tenancies and higher turnover. Who's the typical renter profile here, and what's been the actual vacancy rate?
- Crime grade is F in this area — have there been break-ins, vandalism, or insurance claims at this property in the last 3 years? What carrier currently insures it and at what premium?
- What's the average days-on-market for RENTAL listings here right now (not sales)? A rising rental-DOM trend means longer vacancies and softer asking-rent achievability than the comps imply.
- What's the recent tenant-quality profile in this submarket — average credit score on applications, eviction rate, late-payment / NSF rate, and stable-employment percentage? A property-management company in the area should have these aggregated.
- How much new for-sale + rental construction is in the pipeline within 1–3 miles? Heavy new supply typically softens prices + rents 12–24 months out; constrained supply supports both.
Investment metrics
- 1% rule
- 1.19% ✓
- Cap rate
- 8.06%
- Cash-on-cash
- 6.29%
- DSCR
- 1.28
- GRM
- 7.0
CMA / ARV
- ARV (median comp)
- $295,413
- List price
- $169,500
- Delta
- -42.62%
- Verdict
- UNDERPRICED
- Comps
- 20 within 1.0 mi
Show comp detail 12 sales within ~0.75 mi
| Address | Dist | Beds/Ba | Sqft | Sold | Price | $/sf | Match |
|---|---|---|---|---|---|---|---|
| 7422 Mckinney St | 0.28mi | 3/2.0 (-1) | 1,836 (+2%) | 3mo | $339,900 | $185 | 71 |
| 147 Woodvale Street St Unit A | 0.13mi | 3/2.5 (-1) | 1,725 (-4%) | 8mo | $270,000 | $157 | 70 |
| 7216 Avenue B | 0.51mi | 3/2.5 (-1) | 1,874 (+5%) | 3mo | $339,500 | $181 | 56 |
| 409 S 72nd St | 0.52mi | 4/4.0 | 1,847 (+3%) | 6mo | $280,000 | $152 | 53 |
| 7729 Avenue J Unit B | 0.68mi | 3/2.5 (-1) | 1,851 (+3%) | 12mo | $349,990 | $189 | 42 |
| 7729 Avenue J Unit A | 0.68mi | 3/3.5 (-1) | 1,851 (+3%) | 8mo | $350,000 | $189 | 42 |
| 7805 Avenue E | 0.46mi | 3/2.5 (-1) | 1,551 (-13%) | 4mo | $229,990 | $148 | 41 |
| 7409 Erath St | 0.65mi | 3/2.0 (-1) | 2,016 (+12%) | 2mo | $360,000 | $179 | 38 |
| 7725 Avenue H | 0.58mi | 4/3.0 | 2,000 (+12%) | 9mo | $295,000 | $148 | 38 |
| 7947 Avenue F | 0.63mi | 3/2.0 (-1) | 1,571 (-12%) | 5mo | $289,900 | $185 | 37 |
| 7331A Avenue J | 0.72mi | 3/2.5 (-1) | 1,725 (-4%) | 16mo | $334,900 | $194 | 36 |
| 7333 Avenue J | 0.71mi | 3/2.5 (-1) | 1,725 (-4%) | 16mo | $334,900 | $194 | 36 |
Match score weights: distance 35% · size 25% · config 20% · recency 20%. Top-matched comps best support the ARV.
Projected returns pro-forma
-2.08% appreciation · 3.0% rent growth · sell at horizon
- IRR
- -2.5%
- Equity multiple
- 0.90×
- Total profit
- $-4,883
- Equity at exit
- $32,287
- IRR
- 5.7%
- Equity multiple
- 1.48×
- Total profit
- $22,571
- Equity at exit
- $26,991
Cash invested: $47,460 (down + closing). Projections, not guarantees.
Landlord ↔ Tenant lean methodology
- Overall (STATE)
- 87 Strongly Landlord-Friendly
- State Texas
- 87 Strongly Landlord-Friendly · R+5
- County
- — inherits STATE
- City
- — inherits STATE
ZIP-level market 77012
- Home prices YoY
- -0.8%
- Active inventory
- 74
- Price-to-rent
- 7.0×
Monthly cashflow live
- Estimated rent
- $2,016 medium interval (Pro) →
- Mortgage (P&I)
- −$889
- Tax from tax record
- −$384 /mo · $4,606/yr
- Insurance
- −$71
- HOA
- −$0
- Vacancy / Maint / Mgmt
- −$423
- Net cashflow
- $249
Break-even live
UW: 25.0% down · 7.5% · 30yr · 1.5% tax · 5.0% vac · 8.0% maint · 8.0% mgmt
Financing live
Cash to close
- Down payment
- $42,375
- Closing costs
- $5,085
- Reserves months
- —
- Total cash needed
- —
Loan-product check · same deal, 3 products live
Conventional
25% down · 7.5% · 30yr
- Down + closing
- —
- Monthly P&I
- —
- Monthly cashflow
- —
- DSCR
- —
- Eligible?
- —
Personal DTI + credit; lowest rate.
DSCR
20% down · 8.5% · 30yr
- Down + closing
- —
- Monthly P&I
- —
- Monthly cashflow
- —
- DSCR
- —
- Eligible?
- —
No personal income docs; deal must DSCR.
Hard money
10% down · 12.0% · 12mo
- Down + closing
- —
- Monthly P&I
- —
- Monthly cashflow
- —
- DSCR
- —
- Eligible?
- —
Short-term bridge; refi at stabilization.
Rent comps 4 comps
| Address | Beds | Baths | Sqft | Rent | $/sqft | DOM | Units | Dist |
|---|---|---|---|---|---|---|---|---|
| 7334 Texas St Houston, TX | 3.0 | 2.0 | 1782 | $2,200 | $1.23 | 43d | 1 | 0.33mi |
| 1010 S Wayside Dr #101 Houston, TX | 4.0 | 2.0 | 1400 | $1,199 | $0.86 | 24d | 1 | 1.21mi |
| 1010 S Wayside Dr #101 Houston, TX | 4.0 | 2.0 | 1400 | $1,982 | $1.42 | 43d | 1 | 1.21mi |
| 6403 Avenue C Unit 1019625P Houston, TX | 2.0–8.0 | 1.0–4.0 | 1232 | $4,453 | $3.61 | 3d | 2 | 1.48mi |
Listing history 14 events
-
2026-06-18days on market $169,500 Active 55 DOM
-
2026-06-17days on market $169,500 Active 54 DOM
-
2026-06-16days on market $169,500 Active 53 DOM
-
2026-06-15days on market $169,500 Active 52 DOM
-
2026-06-13days on market $169,500 Active 50 DOM
-
2026-06-10days on market $169,500 Active 46 DOM
-
2026-06-08days on market $169,500 Active 45 DOM
-
2026-06-07days on market $169,500 Active 44 DOM
-
2026-06-04days on market $169,500 Active 41 DOM
-
2026-06-01days on market $169,500 Active 38 DOM
-
2026-05-31days on market $169,500 Active 37 DOM
-
2026-04-23$169,500 Active 469-char remark
-
2004-07-29soldstatus
-
1988-01-02soldstatus
ⓘ Source: listings_history table (triggers on properties + properties_extension) + one-shot
backfill from property_details.listing_events for pre-trigger history.
Tax reassessment forecast TX · Resets to sale price
- Current annual tax
- $4,606 · $384/mo
- Projected year-2 tax
- $4,606 · $384/mo
- Expected delta
- $0/yr ($0/mo · 0.0%)
ⓘ Screening estimate from a state-policy table — verify with the county assessor before closing.
Climate risk First Street
- Flood 5/10 Major FEMA zone X (unshaded) · 24% chance over 30 yrs
- Wildfire 1/10 Low
- Heat 9/10 Extreme 7 d/yr ≥109°F today · 24 d/yr by 30 yrs out
- Wind 9/10 Extreme 99% chance of damaging wind over 30 yrs
- Air quality 2/10 Low 2 unhealthy d/yr today · 2 by 30 yrs out
Nearby sold comps map
Loading sold comps map…
Walkable amenities ~0.75 mi
Loading nearby amenities…
Taxation est. · year 1
- Rental income
- $24,187
- − Mortgage interest
- −$9,495
- − Property taxes
- −$4,606
- − Insurance
- −$848
- − Repairs & maintenance
- −$1,935
- − Management
- −$1,935
- − Depreciation
- −$4,931
- Taxable income
- $437
- Est. tax owed @ 24.0%
- −$105
- After-tax cash flow
- $2,882/yr
For passive investors: Depreciation is non-cash, so a rental often shows a tax loss while cash-flowing — sheltering income. Rental losses are passive: they offset passive income freely, and up to $25,000/yr can offset ordinary (W-2) income if you actively participate and your MAGI is under $100k (phasing out to $0 by $150k); unused losses carry forward. On sale, claimed depreciation is recaptured at up to 25%, and gains may owe capital-gains tax (a 1031 exchange can defer both). Figures are a year-1 estimate at your 24.0% rate — not tax advice; consult a CPA.
Schools (NCES district)
- District
- Houston ISD
- NCES district ID
- 4823640
- Math proficiency
- 27% ▼ -18.00%
- Reading proficiency
- 35% ▼ -6.00%
- Median HH income
- $46,054
- Composite
- 26.63/100
- National rank
- #7173
- State rank
- #593 of 826 in TX
Livability — Houston
- Score
- 74/100
- State rank
- #184
- US rank
- #4771
Category grades
Schools grade is shown separately in the Schools card above.
Census & demographics
- Census place
- Houston, TX
- City population
- 3,226,434
- Population (ZIP)
- 16,780
Population outlook (Harris County) Hauer SSP2
- Today (2025)
- 5,571,493 people
- By 2030
- 6,089,821 · +9.3%
- By 2040
- 7,142,806 · +28.2%
- By 2050
- 8,185,864 · +46.9%
- By 2075
- 10,574,329 · +89.8%
- By 2100
- 12,109,958 · +117.4%
Race, ethnicity, and origin ACS 2023
- Neighborhood character
- Predominantly Hispanic (92%)
- Race & ethnicity
- Hispanic / Latino 92% Two or more races 35% Black 5% White 2%
- Hispanic origin (detail)
- Mexican 80%
- Common ancestry
- Lithuanian 2%
- Foreign-born
- 37% · Canada, Jamaica
- Languages at home
- 18% English-only · Spanish 82%
Political lean MEDSL · Harris
- 2024 margin
- Lean D (+5.5) · D 52.0% · R 46.4% · Other 1.6%
- 2008→2024 swing
- +3.9pp toward D · 2008: 1.6pp · 2024: 5.5pp
- All cycles
- 2024: D+5.5 2020: D+13.3 2016: D+12.4 2012: D+0.1 2008: D+1.6
Not yet ingested
- Civics
- —
Market trends
- HPI YoY
- ▼ -2.08%
- Current HPI
- 274.5729
- Rent YoY
- —
- Metro
- —
- State GDP YoY
- ▲ 3.95%
- F500 in state
- 110
Industry mix (Fortune 500 HQ in TX)
| Industry | F500 HQs | Revenue |
|---|---|---|
| Energy | 16 | $1,198B |
|
||
| Technology | 5 | $198B |
|
||
| Engineering / Construction | 4 | $72B |
|
||
| Energy Services | 3 | $60B |
|
||
| Utilities | 3 | $41B |
|
||
| Healthcare | 2 | $330B |
|
||
Price history
3 events — show timeline
- 2026-04-23 Listed $169,500 HARMLS
- 2004-07-29 Sold (Public Records) — Public Records
- 1988-01-02 Sold (Public Records) — Public Records
Property tax history
+4.5%/yrLatest (2025): $4,606 · +1.5% YoY. Source: county tax records.
Cash-flow waterfall
monthlySold comps — $/sqft
last 12 mo · ≤1 miLoading sold comps…