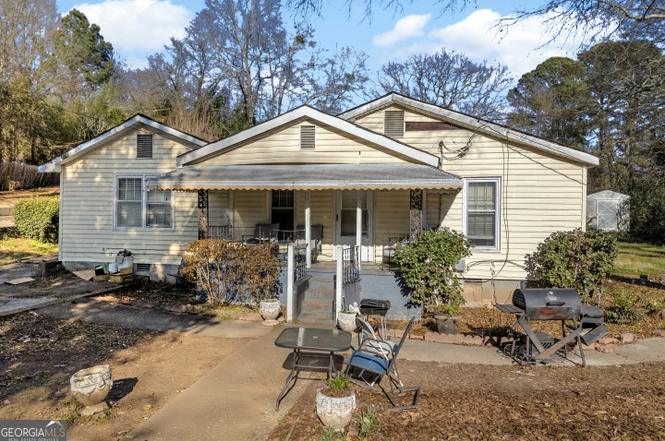
373 Arch St · Athens-Clarke County unified government (balance), GA
Flood risk 1/10 · Minimal
- FEMA flood zone
- X (unshaded)
- Chance of flooding over 30 yrs
- 0.0%
- Est. flood insurance / yr
- $507 – $1,088
Fire risk 3/10 · Minor
- Est. fire insurance / yr
- $963 – $1,789
Heat risk 6/10 · Moderate
- Hot days now (above 106°F)
- 7 days/yr
- Hot days in 30 yrs
- 16 days/yr
Wind risk 5/10 · Moderate
- Chance of severe wind over 30 yrs
- 25.0%
Air-quality risk 3/10 · Minor
- Unhealthy air days now
- 4 days/yr
- Unhealthy air days in 30 yrs
- 4 days/yr
Risk factors via First Street. Map © Google.
Why this score? — see what drove the B- grade
The composite is a weighted blend of 9 inputs, each scored 0–100. Each bar is that input's sub-score; the figure is the points it added to the 100-point composite (weight × sub-score).
- Cash flow +26.7/30.0
- ARV discount +15.0/15.0
- DSCR +9.2/10.0
- 1% rule +6.7/10.0
- Rent growth +3.5/5.0
- Livability +2.5/5.0
- Condition / age +2.5/5.0
- Schools +1.6/10.0
- Appreciation +0.0/10.0
$190,000
🖨 Deal sheet 📄 Offer letter ✓ Due diligence
Listing remarks
3 bedroom 2 bath home located in Athens GA! Perfect for a first time home buyer or college student. Close to Downtown and easy access to loop 10.
Key facts
- 0.38 acre lot
- Built 1936
- Listed 91 days
Neighborhood map
What this means for you Summary
Snapshot
- This is a 3-bed/1.0-bath single-family listed at $190k.
Deal economics
- At list price, monthly cash flow is $513 ($6k/yr) — positive.
- The deal already cash-flows at list — no discount required.
- Meets the 1% rule at list price ($2k rent vs $190k).
- Recommended offer: $173k (9.0% below list) — sets the bar for market timing.
- Cap rate 9.5% vs local median 3.3% in Athens-Clarke County unified government (balance) — top-decile yield for the area; either an underpriced asset or a hidden risk that comps aren't pricing in. Stress-test before assuming the spread holds.
Location & tenants
- Location reads: area grade B — affects rentability + tenant quality, not the cash-flow math above.
- Clarke County (urban): math 17% / reading 21% proficiency, ranked #146 of 174 in GA (top 84%) — low school quality limits family demand, transient renter base, plan for 1-2y turnover; 74% free/reduced lunch — lower-income household profile, screen leases tightly.
- Zoned schools: Gaines Elementary School (math 8% / reading 8%, grade F, #1,125 of 1,228 statewide, top 93%, 518 students, 83% FRL); Hilsman Middle School (math 12% / reading 22%, grade F, #381 of 470 statewide, top 82%, 628 students, 83% FRL); Cedar Shoals High School (1,443 students, 83% FRL).
- Market conditions: Rents rising (+3.9%/yr); 115 active listings in the ZIP; 36 comparable units currently listed for rent nearby; rentals lingering (median 44d on market — plan ~5-8 weeks vacancy on turnover, expect pricing pressure); 58% of comp listings sitting > 30 days — soft ceiling on asking rent; lower-income renter base — watch delinquency; 1,172 units permitted in Clarke County in 2024 (876 in 5+ unit buildings).
- At $2,215/mo this rent would consume 68% of the median local household income ($39k/yr) (locally 3108% of renters already pay >50% of income on rent) — very limited rent-growth headroom before tenants either downsize or default.
Forward outlook
- Local home prices are declining (-3.0%/yr); year-one equity from $1k of loan paydown is wiped out by about $6k of value loss. Plan a longer hold.
- Clarke County population projected at +31% by 2050 — long-run rental-demand tailwind backs the buy-and-hold thesis.
- At projected returns (-3.0% appreciation + 3.9% rent growth), your $53k cash investment doubles in ~9 years — after that, you're playing with house money.
Negotiation context
- It's been on market 91 days — a 9% lower offer ($173k) is reasonable based on typical stale-listing flexibility.
Risks & watch-outs
- Watch-outs: built in 1936 — expect roof / HVAC / electrical / plumbing capex.
- Climate carrying-cost: moderate wind risk, 25% chance of damaging wind over 30y; extreme-heat days projected 7→16/yr by 2055 (HVAC capex compounding) — expect insurance premiums to compound above CPI over the hold.
Questions for the listing agent
- It's been on market 91 days. Have you received any prior offers? Is the seller open to a 9% concession, seller financing, or rate buy-down credit?
- Built in 1936 — when were the roof, HVAC, electrical panel, plumbing, and water heater last replaced?
- Why hasn't it sold? Are there any deal-killer items the seller is aware of (foundation, flood, title, zoning, code violations)?
- Is there a deadline driving the sale (1031 exchange, divorce, estate, relocation)? That informs how much negotiation room exists.
- What's the average days-on-market for RENTAL listings here right now (not sales)? A rising rental-DOM trend means longer vacancies and softer asking-rent achievability than the comps imply.
- What's the recent tenant-quality profile in this submarket — average credit score on applications, eviction rate, late-payment / NSF rate, and stable-employment percentage? A property-management company in the area should have these aggregated.
- How much new for-sale + rental construction is in the pipeline within 1–3 miles? Heavy new supply typically softens prices + rents 12–24 months out; constrained supply supports both.
Investment metrics
- 1% rule
- 1.17% ✓
- Cap rate
- 9.54%
- Cash-on-cash
- 11.58%
- DSCR
- 1.52
- GRM
- 7.1
CMA / ARV
- ARV (on-the-fly)
- $293,865
- Comps found
- 12
Show comp detail 12 sales within ~0.75 mi
| Address | Dist | Beds/Ba | Sqft | Sold | Price | $/sf | Match |
|---|---|---|---|---|---|---|---|
| 355 Arch St | 0.10mi | 3/2.5 | 1,531 (+2%) | 20mo | $344,000 | $225 | 70 |
| 626 Vine St | 0.11mi | 3/2.0 | 1,356 (-10%) | 11mo | $255,000 | $188 | 65 |
| 170 Royal Ct | 0.34mi | 3/2.0 | 1,365 (-9%) | 3mo | $235,000 | $172 | 62 |
| 250 Fairview St | 0.33mi | 3/2.0 | 1,380 (-8%) | 8mo | $210,000 | $152 | 60 |
| 1965 Hollis St | 0.72mi | 3/2.0 | 1,541 (+2%) | 2mo | $304,000 | $197 | 57 |
| 263 Arch St | 0.35mi | 3/3.0 | 1,672 (+11%) | 1mo | $325,500 | $195 | 57 |
| 166 Inglewood Ave | 0.42mi | 3/1.0 | 1,332 (-12%) | 7mo | $190,000 | $143 | 55 |
| 155 Cone Dr | 0.14mi | 4/1.5 (+1) | 1,296 (-14%) | 11mo | $225,000 | $174 | 54 |
| 1294 E Broad St | 0.57mi | 3/2.0 | 1,507 (0%) | 20mo | $410,000 | $272 | 53 |
| 366 Washington Dr | 0.70mi | 4/2.0 (+1) | 1,541 (+2%) | 10mo | $280,000 | $182 | 47 |
| 136 Herman St #C | 0.60mi | 3/3.0 | 1,450 (-4%) | 18mo | $327,500 | $226 | 42 |
| 231 S Poplar St | 0.58mi | 4/2.0 (+1) | 1,689 (+12%) | 9mo | $375,000 | $222 | 36 |
Match score weights: distance 35% · size 25% · config 20% · recency 20%. Top-matched comps best support the ARV.
Projected returns pro-forma
-3.0% appreciation · 3.86% rent growth · sell at horizon
- IRR
- 1.9%
- Equity multiple
- 1.07×
- Total profit
- $3,828
- Equity at exit
- $28,330
- IRR
- 12.3%
- Equity multiple
- 2.00×
- Total profit
- $53,455
- Equity at exit
- $16,428
Cash invested: $53,200 (down + closing). Projections, not guarantees.
Landlord ↔ Tenant lean methodology
- Overall (STATE)
- 90 Strongly Landlord-Friendly
- State Georgia
- 90 Strongly Landlord-Friendly · R+3
- County
- — inherits STATE
- City
- — inherits STATE
ZIP-level market 30601
- Rents YoY
- 3.9%
- Active inventory
- 115
- Price-to-rent
- 7.1×
Monthly cashflow live
- Estimated rent
- $2,215 high interval (Pro) →
- Mortgage (P&I)
- −$996
- Tax from tax record
- −$161 /mo · $1,936/yr
- Insurance
- −$79
- HOA
- −$0
- Vacancy / Maint / Mgmt
- −$465
- Net cashflow
- $513
Break-even live
UW: 25.0% down · 7.5% · 30yr · 1.5% tax · 5.0% vac · 8.0% maint · 8.0% mgmt
Financing live
Cash to close
- Down payment
- $47,500
- Closing costs
- $5,700
- Reserves months
- —
- Total cash needed
- —
Loan-product check · same deal, 3 products live
Conventional
25% down · 7.5% · 30yr
- Down + closing
- —
- Monthly P&I
- —
- Monthly cashflow
- —
- DSCR
- —
- Eligible?
- —
Personal DTI + credit; lowest rate.
DSCR
20% down · 8.5% · 30yr
- Down + closing
- —
- Monthly P&I
- —
- Monthly cashflow
- —
- DSCR
- —
- Eligible?
- —
No personal income docs; deal must DSCR.
Hard money
10% down · 12.0% · 12mo
- Down + closing
- —
- Monthly P&I
- —
- Monthly cashflow
- —
- DSCR
- —
- Eligible?
- —
Short-term bridge; refi at stabilization.
Rent comps 36 comps
| Address | Beds | Baths | Sqft | Rent | $/sqft | DOM | Units | Dist |
|---|---|---|---|---|---|---|---|---|
| 354 Arch St Athens, GA | 2.0 | 3.0 | 1848 | $1,695 | $0.92 | 43d | 1 | 0.12mi |
| 354 Arch St Unit 302 Athens, GA | 2.0 | 2.5 | 1800 | $1,695 | $0.94 | 43d | 1 | 0.12mi |
| 1734 E Broad St Unit A Athens, GA | 4.0 | 2.0 | 1500 | $2,060 | $1.37 | 43d | 1 | 0.22mi |
| 122 Head St Athens, GA | 4.0 | 4.5 | 1736 | $3,200 | $1.84 | 43d | 1 | 0.28mi |
| 123 Head St Athens, GA | 4.0 | 4.5 | 1736 | $3,000 | $1.73 | 13d | 1 | 0.28mi |
| 121 Head St Athens, GA | 4.0 | 4.5 | 1736 | $3,200 | $1.84 | 13d | 1 | 0.30mi |
| 129 N Peter St Athens, GA | 4.0 | 2.0 | 1335 | $2,600 | $1.95 | 21d | 1 | 0.46mi |
| 175 Arch St Athens, GA | 3.0 | 2.5 | 1484 | $2,250 | $1.52 | 43d | 1 | 0.48mi |
| 1295 E Broad St Unit C3 Athens, GA | 2.0 | 2.0 | 1531 | $2,200 | $1.44 | 43d | 1 | 0.54mi |
| 540 N Peter St Athens, GA | 4.0 | 2.0 | 1492 | $2,100 | $1.41 | 43d | 1 | 0.57mi |
| 75 Arch St Athens, GA | 2.0 | 2.0 | 1134 | $1,800 | $1.59 | 21d | 1 | 0.59mi |
| 290 Appleby Dr Athens, GA | 2.0 | 2.0–2.5 | 1206 | $1,625 | $1.35 | 13d | 2 | 0.60mi |
| 120 Hillside St Athens, GA | 3.0 | 2.0 | 1727 | $2,400 | $1.39 | 43d | 1 | 0.78mi |
| 160 Indiana Ave Athens, GA | 3.0 | 3.0 | 1050 | $1,950 | $1.86 | 43d | 1 | 0.78mi |
| 188 Williams St Unit 16 Athens, GA | 2.0 | 2.5 | 1072 | $1,500 | $1.40 | 43d | 1 | 0.91mi |
| 805 E Broad St Athens, GA | 4.0 | 4.0–4.5 | 1628 | $975 | $0.60 | 43d | 5 | 0.92mi |
| 428 First St Unit A Athens, GA | 3.0 | 3.0 | 1164 | $2,150 | $1.85 | 13d | 1 | 1.07mi |
| 490 Barnett Shoals Rd Athens, GA | 3.0 | 3.0 | 1444 | $2,212 | $1.53 | 13d | 1 | 1.13mi |
| 490 Barnett Shoals Rd Athens, GA | 2.0–3.0 | 2.0–3.0 | 1298 | $2,325 | $1.79 | 43d | 4 | 1.13mi |
| 265 Rosa Nell Howard St Athens, GA | 3.0 | 2.5 | 1254 | $2,100 | $1.67 | 43d | 1 | 1.15mi |
| 400 E Clayton St Unit 17 Athens, GA | 3.0 | 2.0 | 2000 | $705 | $0.35 | 43d | 1 | 1.18mi |
| 400 E Clayton St Unit 13 Athens, GA | 2.0 | 2.0 | 1100 | $1,950 | $1.77 | 21d | 1 | 1.18mi |
| 115 Berlin St Unit C12 Athens, GA | 2.0 | 2.0 | 1050 | $1,375 | $1.31 | 21d | 1 | 1.22mi |
| 270 Strickland Ave Athens, GA | 2.0 | 2.0–2.5 | 1120 | $1,395 | $1.25 | 44d | 2 | 1.24mi |
| 270 Strickland Ave Athens, GA | 2.0 | 2.0–2.5 | 1120 | $1,395 | $1.25 | 43d | 1 | 1.24mi |
| 492 N Thomas St Unit NT482 Athens, GA | 3.0 | 3.0 | 1500 | $2,900 | $1.93 | 43d | 1 | 1.25mi |
| 125 Berlin St Athens, GA | 2.0 | 2.0 | 1000 | $1,350 | $1.35 | 43d | 9 | 1.25mi |
| 600 N Thomas St Athens, GA | 3.0–5.0 | 3.0–5.0 | 1414 | $944 | $0.67 | 21d | 31 | 1.27mi |
| 145 North Ave Athens, GA | 2.0–3.0 | 2.5–3.0 | 1267 | $1,600 | $1.26 | 13d | 1 | 1.35mi |
| 194 Strickland Ave Athens, GA | 3.0 | 3.5 | 1728 | $2,100 | $1.22 | 21d | 1 | 1.41mi |
| 184 Strickland Ave Athens, GA | 4.0 | 4.5 | 1728 | $2,800 | $1.62 | 21d | 1 | 1.41mi |
| 980 S Lumpkin St Athens, GA | 3.0–4.0 | 3.0–4.0 | 1225 | $1,125 | $0.92 | 43d | 1 | 1.46mi |
| 105 Oak Hill Dr Athens, GA | 1.0–3.0 | 1.0–2.0 | 1097 | $1,809 | $1.65 | 13d | 13 | 1.47mi |
| 930 S Barnett Shoals Rd Unit 1606 Athens, GA | 2.0 | 2.5 | 1116 | $1,300 | $1.16 | 43d | 1 | 1.47mi |
| 1035 Barnett Shoals Rd Athens, GA | 2.0–3.0 | 2.5–3.0 | 1287 | $2,250 | $1.75 | 13d | 2 | 1.48mi |
| 1035 Barnett Shoals Rd Athens, GA | 3.0 | 3.0 | 1406 | $2,075 | $1.48 | 43d | 2 | 1.48mi |
Listing history 3 events
-
2026-04-23status Under Contract
-
2026-02-09price $190,000
-
2026-01-14$250,000 New
ⓘ Source: listings_history table (triggers on properties + properties_extension) + one-shot
backfill from property_details.listing_events for pre-trigger history.
Tax reassessment forecast GA · Resets to sale price
- Current annual tax
- $1,936 · $161/mo
- Projected year-2 tax
- $1,936 · $161/mo
- Expected delta
- $0/yr ($0/mo · 0.0%)
ⓘ Screening estimate from a state-policy table — verify with the county assessor before closing.
Climate risk First Street
- Flood 1/10 Low FEMA zone X (unshaded) · 0% chance over 30 yrs
- Wildfire 3/10 Moderate
- Heat 6/10 Major 7 d/yr ≥106°F today · 16 d/yr by 30 yrs out
- Wind 5/10 Major 25% chance of damaging wind over 30 yrs
- Air quality 3/10 Moderate 4 unhealthy d/yr today · 4 by 30 yrs out
Nearby sold comps map
Loading sold comps map…
Walkable amenities ~0.75 mi
Loading nearby amenities…
Taxation est. · year 1
- Rental income
- $26,586
- − Mortgage interest
- −$10,643
- − Property taxes
- −$1,936
- − Insurance
- −$950
- − Repairs & maintenance
- −$2,127
- − Management
- −$2,127
- − Depreciation
- −$5,527
- Taxable income
- $3,276
- Est. tax owed @ 24.0%
- −$786
- After-tax cash flow
- $5,374/yr
For passive investors: Depreciation is non-cash, so a rental often shows a tax loss while cash-flowing — sheltering income. Rental losses are passive: they offset passive income freely, and up to $25,000/yr can offset ordinary (W-2) income if you actively participate and your MAGI is under $100k (phasing out to $0 by $150k); unused losses carry forward. On sale, claimed depreciation is recaptured at up to 25%, and gains may owe capital-gains tax (a 1031 exchange can defer both). Figures are a year-1 estimate at your 24.0% rate — not tax advice; consult a CPA.
Schools (NCES district)
- District
- Clarke County
- NCES district ID
- 1301170
- Math proficiency
- 17% ▼ -15.00%
- Reading proficiency
- 21% ▼ -12.00%
- Median HH income
- $33,649
- Composite
- 15.51/100
- National rank
- #9302
- State rank
- #146 of 174 in GA
Livability — Athens-Clarke County unified government (balance)
No livability data for this city. (Only ~50 U.S. cities are tracked.)
Census & demographics
- Census place
- Athens-Clarke County unified government (balance), GA
- County
- Clarke County · 126,008 people
- City population
- 119,110
- Metro
- Athens-Clarke County, GA
- Population (ZIP)
- 25,899
- Household income
- $39,219
- Rent vs Own
- Severe rent burden
- 3108.0
Population outlook (Clarke County) Hauer SSP2
- Today (2025)
- 141,365 people
- By 2030
- 151,724 · +7.3%
- By 2040
- 168,541 · +19.2%
- By 2050
- 184,855 · +30.8%
- By 2075
- 221,736 · +56.9%
- By 2100
- 253,853 · +79.6%
Race, ethnicity, and origin ACS 2023
- Neighborhood character
- Diverse neighborhood (Simpson 0.66)
- Race & ethnicity
- White 44% Black 35% Hispanic / Latino 17% Two or more races 9% Asian 2%
- Hispanic origin (detail)
- Mexican 10% Dominican 1%
- Common ancestry
- Slovak 3% Italian 2% Romanian 1%
- Foreign-born
- 9% · Canada, Vietnam
- Languages at home
- 84% English-only · Spanish 12% German/W. Germanic 1% Other Indo-European 1%
Political lean MEDSL · Clarke
- 2024 margin
- Solid D (+38.3) · D 68.6% · R 30.4% · Other 1.0%
- 2008→2024 swing
- +7.0pp toward D · 2008: 31.3pp · 2024: 38.3pp
- All cycles
- 2024: D+38.3 2020: D+42.1 2016: D+38.0 2012: D+28.9 2008: D+31.3
Not yet ingested
- Civics
- —
Market trends
- HPI YoY
- ▼ -274.32%
- Current HPI
- 280.2956
- Rent YoY
- ▲ 3.86%
- Metro
- Athens-Clarke County, GA
- State GDP YoY
- ▲ 2.66%
- F500 in state
- 28
Industry mix (Fortune 500 HQ in GA)
| Industry | F500 HQs | Revenue |
|---|---|---|
| Paper / Packaging | 2 | $29B |
|
||
| Retail | 1 | $160B |
|
||
| Transportation / Logistics | 1 | $91B |
|
||
| Airlines | 1 | $62B |
|
||
| Consumer Goods | 1 | $47B |
|
||
| Utilities | 1 | $25B |
|
||
Price history
-24.0% since first listed3 events — show timeline
- 2026-04-23 Pending — GAMLS
- 2026-02-09 Price Changed $190,000 GAMLS
- 2026-01-14 Listed $250,000 GAMLS
Property tax history
+15.5%/yrLatest (2025): $1,936 · +5.6% YoY. Source: county tax records.
Cash-flow waterfall
monthlySold comps — $/sqft
last 12 mo · ≤1 miLoading sold comps…