1722 Rapids Dr · Temple, TX
Flood risk No data
- FEMA flood zone
- —
- Chance of flooding over 30 yrs
- —
- Est. flood insurance / yr
- —
Fire risk No data
- Est. fire insurance / yr
- —
Heat risk No data
- Hot days now (above threshold)
- —
- Hot days in 30 yrs
- —
Wind risk No data
- Chance of severe wind over 30 yrs
- —
Air-quality risk No data
- Unhealthy air days now
- —
- Unhealthy air days in 30 yrs
- —
Risk factors via First Street. Map © Google.
Why this score? — see what drove the D+ grade
The composite is a weighted blend of 9 inputs, each scored 0–100. Each bar is that input's sub-score; the figure is the points it added to the 100-point composite (weight × sub-score).
- ARV discount +12.9/15.0
- Cash flow +12.5/30.0
- Condition / age +4.0/5.0
- Livability +3.8/5.0
- DSCR +3.7/10.0
- 1% rule +3.6/10.0
- Schools +2.7/10.0
- Rent growth +2.3/5.0
- Appreciation +0.0/10.0
$254,785
🖨 Deal sheet (PDF) 📄 Offer letter ✓ Due diligence
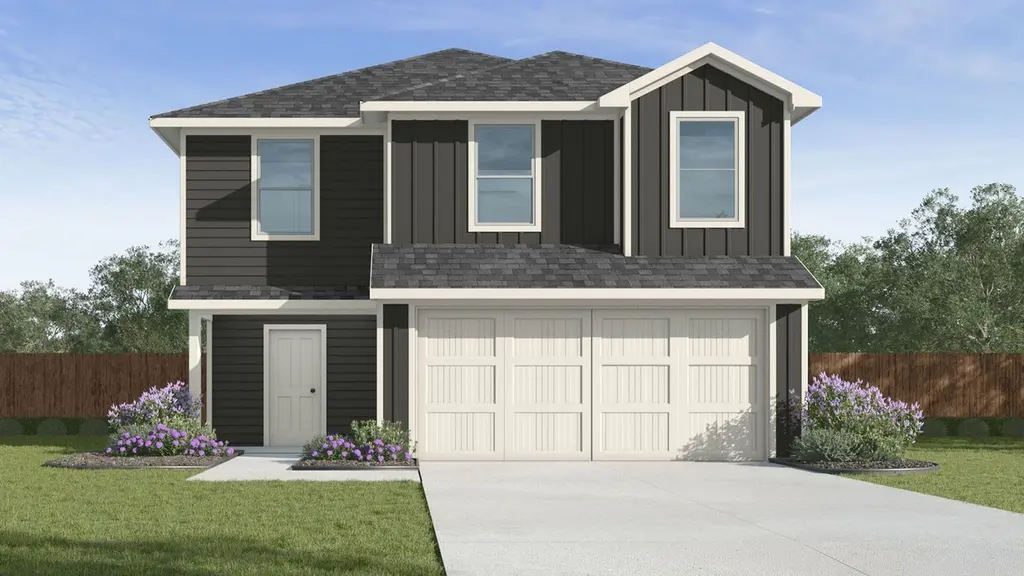
Listing remarks
Step into the stunning Franklin floorplan at Pepper Creek Crossing in Jarrell, Texas. Featuring 5 bedrooms, 2.5 bathrooms, and approximately 1,892 sq. ft. of meticulously crafted living space, this home is perfect for you. On the first floor, you'll find a spacious, open concept living area ideal for entertaining guests or enjoying family time. The beautifully designed kitchen is the heart of the home, showcasing a large island, sleek stainless-steel appliances, and generous counter space-perfect for cooking, serving, and gathering. A conveniently located half bath sits near the stairs for added ease. Upstairs, all five bedrooms are thoughtfully arranged alongside the laundry room for easy
Key facts
- Designed kitchen
- Large island
- Franklin floorplan
Tags
Property features AI
Finance
- Other: Address: 1722 Rapids Dr, Temple TX 76502; Listing provided by Zillow
- Financial info: List price $254,785
Exterior
- Home design: Spec home — Franklin plan
- Exterior features: Living area approximately 1,892
Interior
- Bedrooms: 5 bedrooms
- Bathrooms: 2 full baths and 1 half bath (2.5 total)
- Interior features: Active listing
Neighborhood map
What this means for you Summary
Snapshot
- This is a 5-bed/2.5-bath single-family listed at $255k. Condition is rated good.
Deal economics
- At list price, monthly cash flow is $-38 ($-460/yr) — negative.
- To cash-flow at today's rent, offer at most $249k (2.2% below list).
- To meet the 1% rule (rent ≥ 1% of price), the offer needs to be $218k (14.4% below list).
- Recommended offer: $218k (14.4% below list) — sets the bar for 1% rule.
- Cap rate 6.1% vs local median 3.6% in Temple — top-decile yield for the area; either an underpriced asset or a hidden risk that comps aren't pricing in. Stress-test before assuming the spread holds.
Location & tenants
- Location reads 75/100 on livability (#122 in TX, #3,814 nationally) — a middle-class / working-renter tenant base. Strengths: cost of living A+, housing A+, health & safety A+; Watch: schools C-, commute C-, crime D+.
- Temple ISD (urban): math 32% / reading 31% proficiency, ranked #590 of 826 in TX (top 71%) — families likely to look elsewhere, expect single-tenant / working-renter base with shorter leases; 66% free/reduced lunch — lower-income household profile, screen leases tightly.
- Market conditions: Rents soft (-0.8%/yr); 1118 active listings in the ZIP; 14 comparable units currently listed for rent nearby; rentals lingering (median 45d on market — plan ~5-8 weeks vacancy on turnover, expect pricing pressure); 50% of comp listings sitting > 30 days — soft ceiling on asking rent; solid renter incomes; 3,222 units permitted in Bell County in 2024 (246 in 5+ unit buildings).
- This rent runs 32% of the median local income ($82k/yr) — at the standard rent-burdened threshold; future hikes will face affordability resistance.
Forward outlook
- Local home prices are declining (-3.0%/yr); year-one equity from $2k of loan paydown is wiped out by about $8k of value loss. Plan a longer hold.
- Bell County population projected at +21% by 2050 — long-run rental-demand tailwind backs the buy-and-hold thesis.
Negotiation context
- It's been on market 32 days — a 3% lower offer ($247k) is reasonable based on typical stale-listing flexibility.
Questions for the listing agent
- What do current leases actually rent for vs. the listed asking? Can we see a recent rent roll and the last 12 months of T-12 income?
- It's been on market 32 days. Have you received any prior offers? Is the seller open to a 14% concession, seller financing, or rate buy-down credit?
- Is there a deadline driving the sale (1031 exchange, divorce, estate, relocation)? That informs how much negotiation room exists.
- Crime grade is D in this area — have there been break-ins, vandalism, or insurance claims at this property in the last 3 years? What carrier currently insures it and at what premium?
- The area grade is low — what's the realistic commute time and amenity access for the typical tenant pool here? Any planned neighborhood developments (good or bad) we should know about?
- What's the average days-on-market for RENTAL listings here right now (not sales)? A rising rental-DOM trend means longer vacancies and softer asking-rent achievability than the comps imply.
- What's the recent tenant-quality profile in this submarket — average credit score on applications, eviction rate, late-payment / NSF rate, and stable-employment percentage? A property-management company in the area should have these aggregated.
- How much new for-sale + rental construction is in the pipeline within 1–3 miles? Heavy new supply typically softens prices + rents 12–24 months out; constrained supply supports both.
Investment metrics
- 1% rule
- 0.86% ✗
- Cap rate
- 6.11%
- Cash-on-cash
- -0.64%
- DSCR
- 0.97
- GRM
- 9.7
CMA / ARV
- ARV (on-the-fly)
- $289,476
- Comps found
- 12
Show comp detail 12 sales within ~0.75 mi
| Address | Dist | Beds/Ba | Sqft | Sold | Price | $/sf | Match |
|---|---|---|---|---|---|---|---|
| 7429 Garden Glen Dr | 0.46mi | 4/2.0 (-1) | 1,882 (-0%) | 4mo | $279,499 | $149 | 67 |
| 7719 Krenek Tap Dr | 0.31mi | 4/3.0 (-1) | 2,043 (+8%) | 2mo | $309,900 | $152 | 64 |
| 2205 Koppe Tap Ln | 0.29mi | 4/3.0 (-1) | 2,043 (+8%) | 5mo | $305,900 | $150 | 62 |
| 8202 Dominik Dr | 0.51mi | 4/2.0 (-1) | 1,878 (-1%) | 8mo | $274,900 | $146 | 61 |
| 2313 Helena Dr | 0.44mi | 4/3.0 (-1) | 2,043 (+8%) | 3mo | $316,750 | $155 | 57 |
| 2213 Koppe Tap Ln | 0.30mi | 4/2.0 (-1) | 1,662 (-12%) | 3mo | $268,255 | $161 | 56 |
| 7824 Krenek Tap Dr | 0.37mi | 4/3.0 (-1) | 2,043 (+8%) | 8mo | $313,400 | $153 | 56 |
| 2303 Koppe Tap Ln | 0.33mi | 4/2.0 (-1) | 1,662 (-12%) | 4mo | $280,900 | $169 | 54 |
| 8109 Northgate Loop | 0.37mi | 4/2.0 (-1) | 1,690 (-11%) | 4mo | $245,000 | $145 | 54 |
| 1643 Hillside Dr | 0.27mi | 4/2.0 (-1) | 1,610 (-15%) | 4mo | $249,900 | $155 | 52 |
| 7823 Krenek Tap Dr | 0.35mi | 4/2.0 (-1) | 1,662 (-12%) | 5mo | $280,900 | $169 | 52 |
| 1211 Lilac Ledge Dr | 0.69mi | 4/2.0 (-1) | 1,820 (-4%) | 3mo | $260,000 | $143 | 52 |
Match score weights: distance 35% · size 25% · config 20% · recency 20%. Top-matched comps best support the ARV.
Projected returns pro-forma
-3.0% appreciation · 0.0% rent growth · sell at horizon
- IRR
- -20.8%
- Equity multiple
- 0.30×
- Total profit
- $-50,082
- Equity at exit
- $37,989
- IRR
- -22.9%
- Equity multiple
- 0.00×
- Total profit
- $-71,312
- Equity at exit
- $22,029
Cash invested: $71,340 (down + closing). Projections, not guarantees.
Landlord ↔ Tenant lean methodology
- Overall (STATE)
- 87 Strongly Landlord-Friendly
- State Texas
- 87 Strongly Landlord-Friendly · R+5
- County
- — inherits STATE
- City
- — inherits STATE
ZIP-level market 76502
- Rents YoY
- -0.8%
- Active inventory
- 1118
- Price-to-rent
- 9.7×
Monthly cashflow live
- Estimated rent
- $2,180 high interval (Pro) →
- Mortgage (P&I)
- −$1,336
- Tax est. 1.5%
- −$318 /mo · $3,822/yr
- Insurance
- −$106
- HOA
- −$0
- Vacancy / Maint / Mgmt
- −$458
- Net cashflow
- $-38
Break-even live
Sensitivity live
| Price | -10% $138 | -5% $50 | +0% $-38 | +5% $-126 | +10% $-214 |
|---|---|---|---|---|---|
| Rent | -10% $-211 | -5% $-124 | +0% $-38 | +5% $48 | +10% $134 |
| Rate | -1.0pp $90 | -0.5pp $27 | base $-38 | +0.5pp $-104 | +1.0pp $-171 |
UW: 25.0% down · 7.5% · 30yr · 1.5% tax · 5.0% vac · 8.0% maint · 8.0% mgmt
Financing live
Cash to close
- Down payment
- $63,696
- Closing costs
- $7,644
- Reserves months
- —
- Total cash needed
- —
Loan-product check · same deal, 3 products live
Conventional
25% down · 7.5% · 30yr
- Down + closing
- —
- Monthly P&I
- —
- Monthly cashflow
- —
- DSCR
- —
- Eligible?
- —
Personal DTI + credit; lowest rate.
DSCR
20% down · 8.5% · 30yr
- Down + closing
- —
- Monthly P&I
- —
- Monthly cashflow
- —
- DSCR
- —
- Eligible?
- —
No personal income docs; deal must DSCR.
Hard money
10% down · 12.0% · 12mo
- Down + closing
- —
- Monthly P&I
- —
- Monthly cashflow
- —
- DSCR
- —
- Eligible?
- —
Short-term bridge; refi at stabilization.
Rent comps 14 comps
| Address | Beds | Baths | Sqft | Rent | $/sqft | DOM | Units | Dist |
|---|---|---|---|---|---|---|---|---|
| 7809 Montclair Dr Temple, TX | 4.0 | 2.0 | 1818 | $1,875 | $1.03 | 24d | 1 | 0.30mi |
| 2231 Hornbeam St Temple, TX | 4.0 | 2.0 | 1639 | $2,123 | $1.30 | 22d | 1 | 0.74mi |
| 2204 Hornbeam St Temple, TX | 4.0 | 3.0 | 2012 | $2,123 | $1.06 | 44d | 1 | 0.74mi |
| 8515 Chena Ridge Dr Temple, TX | 4.0 | 2.0 | 1700 | $2,100 | $1.24 | 14d | 1 | 0.79mi |
| 8614 Glade Dr Temple, TX | 4.0 | 2.0 | 1552 | $3,200 | $2.06 | 44d | 1 | 0.85mi |
| 917 Hollyhock Dr Temple, TX | 4.0 | 2.0 | 1600 | $1,900 | $1.19 | 14d | 1 | 0.93mi |
| 8015 Pineridge Way Temple, TX | 4.0 | 2.0 | 1700 | $1,850 | $1.09 | 44d | 1 | 0.94mi |
| 1211 Fawn Lily Dr Temple, TX | 4.0 | 2.5 | 2077 | $2,145 | $1.03 | 14d | 1 | 0.98mi |
| 717 Hollyhock Dr Temple, TX | 4.0 | 3.0 | 2612 | $2,495 | $0.96 | 14d | 1 | 1.00mi |
| 1129 Stone Valley Rd Unit B Temple, TX | 4.0 | 2.0 | 1479 | $1,699 | $1.15 | 44d | 1 | 1.28mi |
| 8612 Cantera Ridge Rd Temple, TX | 4.0 | 2.0 | 1800 | $1,895 | $1.05 | 24d | 1 | 1.29mi |
| 1119 Stone Valley Rd Unit B Temple, TX | 4.0 | 2.0 | 1479 | $1,699 | $1.15 | 44d | 1 | 1.30mi |
| 1126 Stone Valley Rd Unit A Temple, TX | 4.0 | 2.0 | 1479 | $1,800 | $1.22 | 44d | 1 | 1.32mi |
| 1012 Ribeye Rd Temple, TX | 4.0 | 2.0 | 1612 | $1,850 | $1.15 | 44d | 1 | 1.32mi |
Listing history 16 events
-
2026-06-21days on market $254,785 Active 32 DOM
-
2026-06-18days on market $254,785 Active 29 DOM
-
2026-06-17days on market $254,785 Active 28 DOM
-
2026-06-16days on market $254,785 Active 27 DOM
-
2026-06-15days on market $254,785 Active 26 DOM
-
2026-06-14days on market $254,785 Active 24 DOM
-
2026-06-13days on market $254,785 Active 23 DOM
-
2026-06-09days on market $254,785 Active 20 DOM
-
2026-06-08days on market $254,785 Active 19 DOM
-
2026-06-07days on market $254,785 Active 18 DOM
-
2026-06-05days on market $254,785 Active 15 DOM
-
2026-06-03days on market $254,785 Active 14 DOM
-
2026-06-02days on market $254,785 Active 13 DOM
-
2026-06-01days on market $254,785 Active 12 DOM
-
2026-05-31days on market $254,785 Active 11 DOM
-
2026-05-30days on market $254,785 Active 10 DOM
ⓘ Source: listings_history table (triggers on properties + properties_extension) + one-shot
backfill from property_details.listing_events for pre-trigger history.
Nearby sold comps map
Loading sold comps map…
Walkable amenities ~0.75 mi
Loading nearby amenities…
Taxation est. · year 1
- Rental income
- $26,164
- − Mortgage interest
- −$14,272
- − Property taxes
- −$3,822
- − Insurance
- −$1,274
- − Repairs & maintenance
- −$2,093
- − Management
- −$2,093
- − Depreciation
- −$7,412
- Taxable loss
- −$4,802
- Est. tax savings @ 24.0%
- +$1,152
- After-tax cash flow
- $693/yr
For passive investors: Depreciation is non-cash, so a rental often shows a tax loss while cash-flowing — sheltering income. Rental losses are passive: they offset passive income freely, and up to $25,000/yr can offset ordinary (W-2) income if you actively participate and your MAGI is under $100k (phasing out to $0 by $150k); unused losses carry forward. On sale, claimed depreciation is recaptured at up to 25%, and gains may owe capital-gains tax (a 1031 exchange can defer both). Figures are a year-1 estimate at your 24.0% rate — not tax advice; consult a CPA.
Condition & rehab AI · 13 photos
This home is in good condition with a modern kitchen and well-maintained exterior. It has potential for further value increases through exterior painting and landscaping improvements.
Value-add opportunities
- Both Painting the exterior siding — Fresh paint can enhance curb appeal and property value.
- Both Landscaping improvements — Well-maintained landscaping can increase both resale and rental value.
- Both Adding smart home features — Smart home technology can increase both resale and rental value by making the home more attractive to tech-savvy buyers and renters.
Renovation cost estimate screening
Value-add ROI direction
- Both Painting the exterior siding — Fresh paint can enhance curb appeal and property value. ↑
- Both Landscaping improvements — Well-maintained landscaping can increase both resale and rental value. ↑
- Both Adding smart home features — Smart home technology can increase both resale and rental value by making the home more attractive to tech-savvy buyers and renters. ↑
ⓘ Cost ranges are severity-bucket heuristics (US national rule-of-thumb). Get contractor quotes + a written scope before underwriting a rehab budget.
Schools (NCES district)
- District
- Temple ISD
- NCES district ID
- 4842330
- Math proficiency
- 32% ▼ -8.00%
- Reading proficiency
- 31% ▼ -4.00%
- Median HH income
- $43,120
- Composite
- 26.8/100
- National rank
- #7123
- State rank
- #590 of 826 in TX
Livability — Temple
- Score
- 75/100
- State rank
- #122
- US rank
- #3814
Category grades
Schools grade is shown separately in the Schools card above.
Census & demographics
- Census place
- Temple, TX
- County
- Bell County · 345,090 people
- City population
- 96,587
- Metro
- Killeen-Temple, TX
- Population (ZIP)
- 52,669
- Household income
- $82,088
- Rent vs Own
- Severe rent burden
- 1890.0
Population outlook (Bell County) Hauer SSP2
- Today (2025)
- 371,114 people
- By 2030
- 389,104 · +4.8%
- By 2040
- 420,592 · +13.3%
- By 2050
- 447,779 · +20.7%
- By 2075
- 499,130 · +34.5%
- By 2100
- 505,680 · +36.3%
Race, ethnicity, and origin ACS 2023
- Neighborhood character
- Diverse neighborhood (Simpson 0.59)
- Race & ethnicity
- White 58% Hispanic / Latino 26% Two or more races 15% Black 9% Asian 3%
- Hispanic origin (detail)
- Mexican 21% Puerto Rican 2%
- Common ancestry
- Italian 2% Slovak 2% Serbian 1%
- Foreign-born
- 7% · Canada, South Korea, China
- Languages at home
- 86% English-only · Spanish 10% Other Indo-European 1% Korean 1%
Political lean MEDSL · Bell
- 2024 margin
- R (+16.2) · D 41.3% · R 57.6% · Other 1.1%
- 2008→2024 swing
- -6.5pp toward R · 2008: -9.8pp · 2024: -16.2pp
- All cycles
- 2024: R+16.2 2020: R+8.5 2016: R+15.1 2012: R+16.4 2008: R+9.8
Not yet ingested
- Civics
- —
Market trends
- HPI YoY
- ▼ -216.80%
- Current HPI
- 166.927
- Rent YoY
- ▼ -0.79%
- Metro
- Killeen-Temple, TX
- State GDP YoY
- ▲ 3.95%
- F500 in state
- 110
Industry mix (Fortune 500 HQ in TX)
| Industry | F500 HQs | Revenue |
|---|---|---|
| Energy | 16 | $1,198B |
|
||
| Technology | 5 | $198B |
|
||
| Engineering / Construction | 4 | $72B |
|
||
| Energy Services | 3 | $60B |
|
||
| Utilities | 3 | $41B |
|
||
| Healthcare | 2 | $330B |
|
||
Cash-flow waterfall
monthlySold comps — $/sqft
last 12 mo · ≤1 miLoading sold comps…