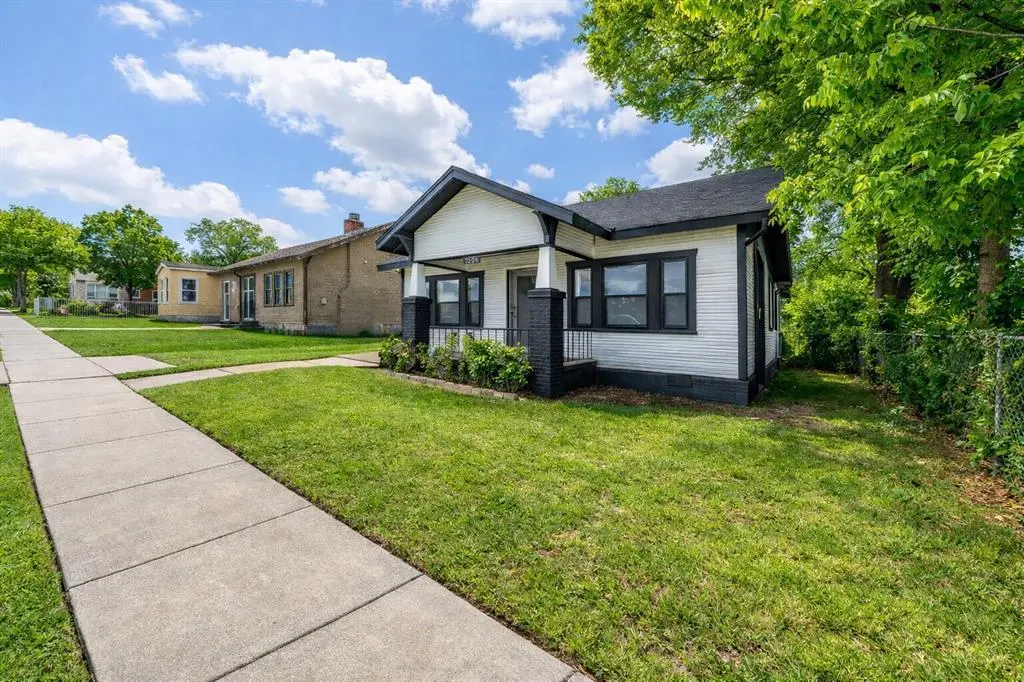
2628 Avenue G · Fort Worth, TX
Flood risk 1/10 · Minimal
- FEMA flood zone
- X (unshaded)
- Chance of flooding over 30 yrs
- 0.0%
- Est. flood insurance / yr
- $507 – $1,088
Fire risk 1/10 · Minimal
- Est. fire insurance / yr
- $1,222 – $2,270
Heat risk 8/10 · Major
- Hot days now (above 109°F)
- 7 days/yr
- Hot days in 30 yrs
- 23 days/yr
Wind risk 4/10 · Minor
- Chance of severe wind over 30 yrs
- 21.0%
Air-quality risk 3/10 · Minor
- Unhealthy air days now
- 3 days/yr
- Unhealthy air days in 30 yrs
- 4 days/yr
Risk factors via First Street. Map © Google.
Why this score? — see what drove the D grade
The composite is a weighted blend of 9 inputs, each scored 0–100. Each bar is that input's sub-score; the figure is the points it added to the 100-point composite (weight × sub-score).
- ARV discount +12.5/15.0
- Appreciation +10.0/10.0
- Cash flow +6.3/30.0
- Livability +4.0/5.0
- Rent growth +2.5/5.0
- Condition / age +2.5/5.0
- Schools +2.0/10.0
- 1% rule +1.9/10.0
- DSCR +0.6/10.0
$236,000
🖨 Deal sheet 📄 Offer letter ✓ Due diligence
Listing remarks MLS
Welcome to this charming three-bedroom, two-bath cottage with an additional two-bedroom loft and full bath upstairs. The living room features large windows for natural light and a beautiful enclosed fireplace that keeps the cozy charm of a traditional hearth. Enjoy new flooring throughout, a bright dining room with a chandelier, and a remodeled kitchen with granite countertops, new cabinets, a pantry, and a gas stove. A laundry room with washer dryer hookups adds convenience. Fresh interior paint makes the home move-in ready. With flexible space on both levels, this is a must-see property offering comfort, character, and room to grow.
Key facts
- Pantry
- Enclosed fireplace
- Remodeled kitchen
Tags
Neighborhood map
What this means for you Summary
Snapshot
- This is a 3-bed/1.0-bath single-family listed at $236k.
Deal economics
- At list price, monthly cash flow is $-416 ($-5k/yr) — negative.
- To cash-flow at today's rent, offer at most $163k (31.1% below list).
- To meet the 1% rule (rent ≥ 1% of price), the offer needs to be $162k (31.3% below list).
- Recommended offer: $162k (31.3% below list) — sets the bar for 1% rule.
Location & tenants
- Location reads 80/100 on livability (#49 in TX, #1,954 nationally) — a professional / high-income tenant draw. Strengths: amenities A+, cost of living A+, housing A+; Watch: schools D+, crime F.
- Fort Worth ISD (urban): math 18% / reading 28% proficiency, ranked #742 of 826 in TX (top 90%) — low school quality limits family demand, transient renter base, plan for 1-2y turnover; 73% free/reduced lunch — lower-income household profile, screen leases tightly.
- Market conditions: 99 active listings in the ZIP; 36 comparable units currently listed for rent nearby; rentals at typical pace (median 24d on market — plan ~3-4 weeks tenant-placement turnaround); 42% of comp listings sitting > 30 days — soft ceiling on asking rent; 18,938 units permitted in Tarrant County in 2024 (8,336 in 5+ unit buildings).
- This rent runs 43% of the median local income ($46k/yr) — at the standard rent-burdened threshold; future hikes will face affordability resistance.
Forward outlook
- In year one you build about $25k of equity ($2k loan paydown + $24k appreciation (10.0% local appreciation)).
- Tarrant County population projected at +41% by 2050 — long-run rental-demand tailwind backs the buy-and-hold thesis.
- By year 2, paydown + projected appreciation supports a ~$41k cash-out refi (75% LTV) — recoverable capital for the next deal without selling this one.
Negotiation context
- It's been on market 68 days — a 6% lower offer ($222k) is reasonable based on typical stale-listing flexibility.
Risks & watch-outs
- Watch-outs: built in 1925 — expect roof / HVAC / electrical / plumbing capex.
- Climate carrying-cost: extreme-heat days projected 7→23/yr by 2055 (HVAC capex compounding) — expect insurance premiums to compound above CPI over the hold.
Questions for the listing agent
- What do current leases actually rent for vs. the listed asking? Can we see a recent rent roll and the last 12 months of T-12 income?
- It's been on market 68 days. Have you received any prior offers? Is the seller open to a 31% concession, seller financing, or rate buy-down credit?
- Built in 1925 — when were the roof, HVAC, electrical panel, plumbing, and water heater last replaced?
- Why hasn't it sold? Are there any deal-killer items the seller is aware of (foundation, flood, title, zoning, code violations)?
- Is there a deadline driving the sale (1031 exchange, divorce, estate, relocation)? That informs how much negotiation room exists.
- Schools are D-rated, which usually means shorter tenancies and higher turnover. Who's the typical renter profile here, and what's been the actual vacancy rate?
- Crime grade is F in this area — have there been break-ins, vandalism, or insurance claims at this property in the last 3 years? What carrier currently insures it and at what premium?
- The area grade is low — what's the realistic commute time and amenity access for the typical tenant pool here? Any planned neighborhood developments (good or bad) we should know about?
- What's the average days-on-market for RENTAL listings here right now (not sales)? A rising rental-DOM trend means longer vacancies and softer asking-rent achievability than the comps imply.
- What's the recent tenant-quality profile in this submarket — average credit score on applications, eviction rate, late-payment / NSF rate, and stable-employment percentage? A property-management company in the area should have these aggregated.
- How much new for-sale + rental construction is in the pipeline within 1–3 miles? Heavy new supply typically softens prices + rents 12–24 months out; constrained supply supports both.
Investment metrics
- 1% rule
- 0.69% ✗
- Cap rate
- 4.18%
- Cash-on-cash
- -7.55%
- DSCR
- 0.66
- GRM
- 12.1
CMA / ARV
- ARV (median comp)
- $265,320
- List price
- $236,000
- Delta
- -11.05%
- Verdict
- UNDERPRICED
- Comps
- 20 within 1.0 mi
Show comp detail 12 sales within ~0.75 mi
| Address | Dist | Beds/Ba | Sqft | Sold | Price | $/sf | Match |
|---|---|---|---|---|---|---|---|
| 2612 Avenue H | 0.07mi | 3/1.0 | 1,349 (-6%) | 4mo | $105,000 | $78 | 82 |
| 2905 Avenue I | 0.32mi | 3/2.0 | 1,458 (+1%) | 10mo | $299,999 | $206 | 71 |
| 3009 Avenue H | 0.38mi | 3/2.0 | 1,400 (-3%) | 8mo | $265,000 | $189 | 67 |
| 3001 Avenue L | 0.46mi | 3/1.0 | 1,380 (-4%) | 10mo | $180,000 | $130 | 64 |
| 2508 Conner Ave | 0.63mi | 3/2.0 | 1,500 (+4%) | 3mo | $235,000 | $157 | 57 |
| 3301 Avenue H | 0.61mi | 3/2.0 | 1,501 (+4%) | 5mo | $289,000 | $193 | 56 |
| 2217 Christine Ave | 0.47mi | 3/2.0 | 1,245 (-14%) | 1mo | $279,999 | $225 | 51 |
| 2821 Burchill Rd S | 0.69mi | 3/1.0 | 1,296 (-10%) | 2mo | $168,000 | $130 | 49 |
| 3325 Avenue L | 0.72mi | 3/2.0 | 1,353 (-6%) | 5mo | $240,000 | $177 | 48 |
| 3225 Avenue M | 0.67mi | 3/2.0 | 1,589 (+10%) | 1mo | $234,999 | $148 | 46 |
| 2709 Bideker Ave | 0.74mi | 4/2.0 (+1) | 1,513 (+5%) | 8mo | $245,000 | $162 | 42 |
| 3331 Avenue L | 0.73mi | 3/2.0 | 1,633 (+13%) | 3mo | $216,750 | $133 | 37 |
Match score weights: distance 35% · size 25% · config 20% · recency 20%. Top-matched comps best support the ARV.
Projected returns pro-forma
10.0% appreciation · 3.0% rent growth · sell at horizon
- IRR
- 19.0%
- Equity multiple
- 2.55×
- Total profit
- $102,111
- Equity at exit
- $212,607
- IRR
- 17.5%
- Equity multiple
- 5.87×
- Total profit
- $321,658
- Equity at exit
- $458,496
Cash invested: $66,080 (down + closing). Projections, not guarantees.
Landlord ↔ Tenant lean methodology
- Overall (STATE)
- 87 Strongly Landlord-Friendly
- State Texas
- 87 Strongly Landlord-Friendly · R+5
- County
- — inherits STATE
- City
- — inherits STATE
ZIP-level market 76105
- Home prices YoY
- 14.2%
- Active inventory
- 99
- Price-to-rent
- 12.1×
Monthly cashflow live
- Estimated rent
- $1,621 high interval (Pro) →
- Mortgage (P&I)
- −$1,238
- Tax from tax record
- −$361 /mo · $4,329/yr
- Insurance
- −$98
- HOA
- −$0
- Vacancy / Maint / Mgmt
- −$340
- Net cashflow
- $-416
Break-even live
UW: 25.0% down · 7.5% · 30yr · 1.5% tax · 5.0% vac · 8.0% maint · 8.0% mgmt
Financing live
Cash to close
- Down payment
- $59,000
- Closing costs
- $7,080
- Reserves months
- —
- Total cash needed
- —
Loan-product check · same deal, 3 products live
Conventional
25% down · 7.5% · 30yr
- Down + closing
- —
- Monthly P&I
- —
- Monthly cashflow
- —
- DSCR
- —
- Eligible?
- —
Personal DTI + credit; lowest rate.
DSCR
20% down · 8.5% · 30yr
- Down + closing
- —
- Monthly P&I
- —
- Monthly cashflow
- —
- DSCR
- —
- Eligible?
- —
No personal income docs; deal must DSCR.
Hard money
10% down · 12.0% · 12mo
- Down + closing
- —
- Monthly P&I
- —
- Monthly cashflow
- —
- DSCR
- —
- Eligible?
- —
Short-term bridge; refi at stabilization.
Rent comps 36 comps
| Address | Beds | Baths | Sqft | Rent | $/sqft | DOM | Units | Dist |
|---|---|---|---|---|---|---|---|---|
| 2837 Avenue J Unit J Fort Worth, TX | 3.0 | 1.5 | 1000 | $1,455 | $1.46 | 24d | 1 | 0.30mi |
| 2839 Avenue J Unit J Fort Worth, TX | 3.0 | 1.5 | 1000 | $1,455 | $1.46 | 24d | 1 | 0.31mi |
| 2909 Avenue K Fort Worth, TX | 3.0 | 2.0 | 1490 | $700 | $0.47 | 43d | 1 | 0.38mi |
| 3100 Avenue G Unit 200 Fort Worth, TX | 2.0 | 1.0 | 1000 | $750 | $0.75 | 12d | 1 | 0.41mi |
| 2912 Avenue K Fort Worth, TX | 3.0 | 1.5 | 1200 | $1,600 | $1.33 | 43d | 1 | 0.41mi |
| 3100 Avenue G Unit G Fort Worth, TX | 2.0 | 1.0 | 1000 | $850 | $0.85 | 12d | 1 | 0.42mi |
| 3300 Avenue H Fort Worth, TX | 2.0 | 1.0 | 1050 | $1,150 | $1.10 | 43d | 1 | 0.60mi |
| 3302 Avenue H Unit 3300 Fort Worth, TX | 2.0 | 1.0 | 1050 | $1,150 | $1.10 | 43d | 1 | 0.60mi |
| 501A Parkdale Ave Fort Worth, TX | 2.0 | 1.0 | 950 | $1,500 | $1.58 | 43d | 1 | 0.62mi |
| 2640 Berryhill Dr Fort Worth, TX | 2.0 | 1.0 | 1478 | $1,299 | $0.88 | 24d | 1 | 0.74mi |
| 2825 Bideker Ave Fort Worth, TX | 3.0 | 1.0 | 900 | $1,500 | $1.67 | 24d | 1 | 0.76mi |
| 1601 Daniel St Fort Worth, TX | 3.0 | 2.0 | 1869 | $1,795 | $0.96 | 5d | 1 | 0.80mi |
| 2735 Purington Ave Unit 201 Fort Worth, TX | 2.0 | 1.0 | 1116 | $1,200 | $1.08 | 24d | 1 | 0.90mi |
| 2100 Belzise Ter Fort Worth, TX | 4.0 | 2.5 | 1869 | $2,045 | $1.09 | 5d | 1 | 0.91mi |
| 2108 Belzise Ter Fort Worth, TX | 4.0 | 2.5 | 1869 | $1,950 | $1.04 | 43d | 1 | 0.92mi |
| 2120 Belzise Ter Fort Worth, TX | 4.0 | 2.5 | 1869 | $1,945 | $1.04 | 24d | 1 | 0.93mi |
| 1605 E Morphy St Fort Worth, TX | 3.0 | 2.0 | 1090 | $1,425 | $1.31 | 2d | 1 | 0.93mi |
| 2124 Belzise Ter Fort Worth, TX | 4.0 | 2.5 | 1869 | $1,945 | $1.04 | 19d | 1 | 0.93mi |
| 2104 Daniel St Fort Worth, TX | 3.0 | 2.0 | 1440 | $1,675 | $1.16 | 43d | 1 | 0.96mi |
| 1516 E Maddox Ave Fort Worth, TX | 3.0 | 2.0 | 1485 | $1,895 | $1.28 | 22d | 1 | 0.98mi |
| 1501 Avenue E Fort Worth, TX | 4.0 | 2.5 | 1650 | $2,195 | $1.33 | 15d | 1 | 1.01mi |
| 1718 E Powell Ave Fort Worth, TX | 2.0 | 1.5 | 930 | $1,655 | $1.78 | 43d | 1 | 1.12mi |
| 3731 Avenue M Unit M Fort Worth, TX | 3.0 | 2.0 | 1425 | $1,900 | $1.33 | 22d | 1 | 1.14mi |
| 3140 View St Fort Worth, TX | 3.0 | 1.0 | 1578 | $2,000 | $1.27 | 43d | 1 | 1.14mi |
| 1601 E Leuda St Fort Worth, TX | 3.0 | 2.0 | 1197 | $1,750 | $1.46 | 43d | 1 | 1.19mi |
| 3816 Avenue N Fort Worth, TX | 3.0 | 1.0 | 1108 | $1,550 | $1.40 | 5d | 1 | 1.23mi |
| 3921 Avenue H Unit H Fort Worth, TX | 3.0 | 2.0 | 1064 | $1,550 | $1.46 | 6d | 1 | 1.24mi |
| 1521 E Cannon St Fort Worth, TX | 2.0 | 2.0 | 1140 | $1,600 | $1.40 | 43d | 1 | 1.24mi |
| 912 Clairemont Ave Fort Worth, TX | 2.0 | 1.0 | 936 | $1,300 | $1.39 | 43d | 1 | 1.28mi |
| 1327 E Baltimore Ave Fort Worth, TX | 3.0 | 2.0 | 1426 | $1,650 | $1.16 | 24d | 1 | 1.29mi |
| 612 Luxton St Unit 202 Fort Worth, TX | 2.0 | 1.0 | 900 | $1,095 | $1.22 | 43d | 1 | 1.33mi |
| 2701 Vogt St Fort Worth, TX | 3.0 | 2.0 | 1090 | $1,475 | $1.35 | 14d | 1 | 1.37mi |
| 1608 E Robert St Fort Worth, TX | 3.0 | 2.0 | 1028 | $1,525 | $1.48 | 6d | 1 | 1.40mi |
| 1228 E Leuda St Fort Worth, TX | 3.0 | 2.0 | 1388 | $2,100 | $1.51 | 43d | 1 | 1.40mi |
| 2705 Belzise Ter Fort Worth, TX | 2.0 | 2.0 | 1160 | $1,450 | $1.25 | 43d | 1 | 1.42mi |
| 1429 E Robert St Fort Worth, TX | 3.0 | 2.0 | 1050 | $1,350 | $1.29 | 22d | 1 | 1.46mi |
Listing history 16 events
-
2026-06-18days on market $236,000 Active 68 DOM
-
2026-06-17days on market $236,000 Active 67 DOM
-
2026-06-16days on market $236,000 Active 66 DOM
-
2026-06-15days on market $236,000 Active 65 DOM
-
2026-06-13days on market $236,000 Active 63 DOM
-
2026-06-09days on market $236,000 Active 59 DOM
-
2026-06-08days on market $236,000 Active 58 DOM
-
2026-06-07days on market $236,000 Active 57 DOM
-
2026-06-04days on market $236,000 Active 54 DOM
-
2026-06-03days on market $236,000 Active 53 DOM
-
2026-06-02days on market $236,000 Active 52 DOM
-
2026-06-01days on market $236,000 Active 51 DOM
-
2026-05-31days on market $236,000 Active 50 DOM
-
2026-04-10$239,000 Active 648-char remark
Show marketing remark (648 chars)
Welcome to this charming three-bedroom, two-bath cottage with an additional two-bedroom loft and full bath upstairs. The living room features large windows for natural light and a beautiful enclosed fireplace that keeps the cozy charm of a traditional hearth. Enjoy new flooring throughout, a bright dining room with a chandelier, and a remodeled kitchen with granite countertops, new cabinets, a pantry, and a gas stove. A laundry room with washer dryer hookups adds convenience. Fresh interior paint makes the home move-in ready. With flexible space on both levels, this is a must-see property offering comfort, character, and room to grow.
-
2024-02-02soldstatus
-
2019-01-17soldstatus
ⓘ Source: listings_history table (triggers on properties + properties_extension) + one-shot
backfill from property_details.listing_events for pre-trigger history.
Tax reassessment forecast TX · Resets to sale price
- Current annual tax
- $4,329 · $361/mo
- Projected year-2 tax
- $4,329 · $361/mo
- Expected delta
- $0/yr ($0/mo · 0.0%)
ⓘ Screening estimate from a state-policy table — verify with the county assessor before closing.
Climate risk First Street
- Flood 1/10 Low FEMA zone X (unshaded) · 0% chance over 30 yrs
- Wildfire 1/10 Low
- Heat 8/10 Severe 7 d/yr ≥109°F today · 23 d/yr by 30 yrs out
- Wind 4/10 Moderate 21% chance of damaging wind over 30 yrs
- Air quality 3/10 Moderate 3 unhealthy d/yr today · 4 by 30 yrs out
Nearby sold comps map
Loading sold comps map…
Walkable amenities ~0.75 mi
Loading nearby amenities…
Taxation est. · year 1
- Rental income
- $19,456
- − Mortgage interest
- −$13,220
- − Property taxes
- −$4,329
- − Insurance
- −$1,180
- − Repairs & maintenance
- −$1,557
- − Management
- −$1,557
- − Depreciation
- −$6,865
- Taxable loss
- −$9,251
- Est. tax savings @ 24.0%
- +$2,220
- After-tax cash flow
- $-2,770/yr
For passive investors: Depreciation is non-cash, so a rental often shows a tax loss while cash-flowing — sheltering income. Rental losses are passive: they offset passive income freely, and up to $25,000/yr can offset ordinary (W-2) income if you actively participate and your MAGI is under $100k (phasing out to $0 by $150k); unused losses carry forward. On sale, claimed depreciation is recaptured at up to 25%, and gains may owe capital-gains tax (a 1031 exchange can defer both). Figures are a year-1 estimate at your 24.0% rate — not tax advice; consult a CPA.
Schools (NCES district)
- District
- Fort Worth ISD
- NCES district ID
- 4819700
- Math proficiency
- 18% ▼ -16.00%
- Reading proficiency
- 28% ▼ -6.00%
- Median HH income
- $42,109
- Composite
- 19.61/100
- National rank
- #8753
- State rank
- #742 of 826 in TX
Livability — Fort Worth
- Score
- 80/100
- State rank
- #49
- US rank
- #1954
Category grades
Schools grade is shown separately in the Schools card above.
Census & demographics
- Census place
- Fort Worth, TX
- County
- Tarrant County · 2,033,669 people
- City population
- 911,619
- Metro
- Dallas-Fort Worth-Arlington, TX
- Population (ZIP)
- 22,228
- Household income
- $45,770
- Rent vs Own
- Severe rent burden
- 884.0
Population outlook (Tarrant County) Hauer SSP2
- Today (2025)
- 2,380,417 people
- By 2030
- 2,578,900 · +8.3%
- By 2040
- 2,974,995 · +25.0%
- By 2050
- 3,350,489 · +40.8%
- By 2075
- 4,216,909 · +77.2%
- By 2100
- 4,741,527 · +99.2%
Race, ethnicity, and origin ACS 2023
- Neighborhood character
- Majority Hispanic (63%)
- Race & ethnicity
- Hispanic / Latino 63% Black 29% Two or more races 24% White 6%
- Hispanic origin (detail)
- Mexican 57%
- Foreign-born
- 28% · Canada
- Languages at home
- 44% English-only · Spanish 55% Other Indo-European 1%
Political lean MEDSL · Tarrant
- 2024 margin
- Lean R (+5.1) · D 46.7% · R 51.9% · Other 1.4%
- 2008→2024 swing
- +6.6pp toward D · 2008: -11.7pp · 2024: -5.1pp
- All cycles
- 2024: R+5.1 2020: D+0.2 2016: R+8.7 2012: R+15.7 2008: R+11.7
Not yet ingested
- Civics
- —
Market trends
- HPI YoY
- ▲ 27.33%
- Current HPI
- 219.2657
- Rent YoY
- —
- Metro
- Dallas-Fort Worth-Arlington, TX
- State GDP YoY
- ▲ 3.95%
- F500 in state
- 110
Industry mix (Fortune 500 HQ in TX)
| Industry | F500 HQs | Revenue |
|---|---|---|
| Energy | 16 | $1,198B |
|
||
| Technology | 5 | $198B |
|
||
| Engineering / Construction | 4 | $72B |
|
||
| Energy Services | 3 | $60B |
|
||
| Utilities | 3 | $41B |
|
||
| Healthcare | 2 | $330B |
|
||
Price history
3 events — show timeline
- 2026-04-10 Listed $239,000 NTREIS
- 2024-02-02 Sold (Public Records) — Public Records
- 2019-01-17 Sold (Public Records) — Public Records
Property tax history
+10.9%/yrLatest (2025): $4,329 · +231.3% YoY. Source: county tax records.
Cash-flow waterfall
monthlySold comps — $/sqft
last 12 mo · ≤1 miLoading sold comps…