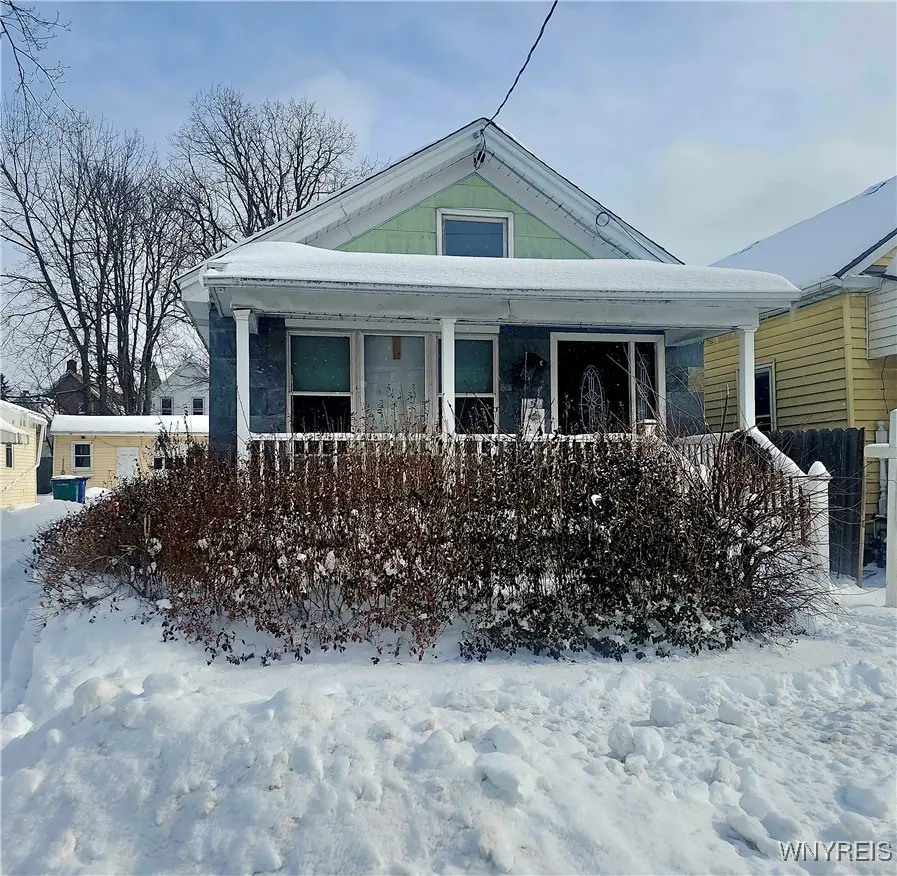
45 Kail St · Buffalo, NY
Flood risk 5/10 · Moderate
- FEMA flood zone
- X (unshaded)
- Chance of flooding over 30 yrs
- 0.62%
- Est. flood insurance / yr
- $507 – $1,088
Fire risk 1/10 · Minimal
- Est. fire insurance / yr
- $691 – $1,283
Heat risk 3/10 · Minor
- Hot days now (above 92°F)
- 7 days/yr
- Hot days in 30 yrs
- 15 days/yr
Wind risk 1/10 · Minimal
- Chance of severe wind over 30 yrs
- —
Air-quality risk 4/10 · Minor
- Unhealthy air days now
- 4 days/yr
- Unhealthy air days in 30 yrs
- 9 days/yr
Risk factors via First Street. Map © Google.
Why this score? — see what drove the B grade
The composite is a weighted blend of 9 inputs, each scored 0–100. Each bar is that input's sub-score; the figure is the points it added to the 100-point composite (weight × sub-score).
- Cash flow +30.0/30.0
- 1% rule +10.0/10.0
- DSCR +10.0/10.0
- ARV discount +7.5/15.0
- Rent growth +4.5/5.0
- Livability +3.9/5.0
- Schools +3.3/10.0
- Condition / age +2.5/5.0
- Appreciation +0.0/10.0
$55,000
🖨 Deal sheet (PDF) 📄 Offer letter ✓ Due diligence
Listing remarks MLS
Seller began remodeling with an open concept in mind. Roof is one yr old. New HWT. Some new windows. A complete rehab at a great price in Black Rock. Seller will remove all building materials and debris before closing.
Key facts
- Open concept
- Complete rehab
- New hwt
Tags
Neighborhood map
What this means for you Summary
Snapshot
- This is a 2-bed/1.0-bath single-family listed at $55k.
Deal economics
- At list price, monthly cash flow is $662 ($8k/yr) — positive.
- The deal already cash-flows at list — no discount required.
- Meets the 1% rule at list price ($1k rent vs $55k).
- Recommended offer: $48k (12.0% below list) — sets the bar for market timing.
- Cap rate 20.7% vs local median 8.0% in Buffalo — top-decile yield for the area; either an underpriced asset or a hidden risk that comps aren't pricing in. Stress-test before assuming the spread holds.
Location & tenants
- Location reads 77/100 on livability (#195 in NY, #3,011 nationally) — a middle-class / working-renter tenant base. Strengths: commute A+, housing A+, health & safety A+; Watch: crime F, employment D-.
- Buffalo City School District (urban): math 41% / reading 40% proficiency, ranked #535 of 590 in NY (top 91%) — families likely to look elsewhere, expect single-tenant / working-renter base with shorter leases; 75% free/reduced lunch — lower-income household profile, screen leases tightly.
- Market conditions: Rents rising fast (+8.2%/yr); 199 active listings in the ZIP; 40 comparable units currently listed for rent nearby; rentals at typical pace (median 25d on market — plan ~3-4 weeks tenant-placement turnaround); 45% of comp listings sitting > 30 days — soft ceiling on asking rent; lower-income renter base — watch delinquency; 1,244 units permitted in Erie County in 2024 (563 in 5+ unit buildings).
- This rent runs 38% of the median local income ($40k/yr) — at the standard rent-burdened threshold; future hikes will face affordability resistance.
Forward outlook
- Local home prices are declining (-3.0%/yr); year-one equity from $380 of loan paydown is wiped out by about $2k of value loss. Plan a longer hold.
- At projected returns (-3.0% appreciation + 8.0% rent growth), your $15k cash investment doubles in ~3 years — after that, you're playing with house money.
Negotiation context
- It's been on market 133 days — a 12% lower offer ($48k) is reasonable based on typical stale-listing flexibility.
- 2 sale attempts with the ask held roughly flat each time — persistent listings suggest the price (not the market) is what's stuck; bring a comps-based counter.
Risks & watch-outs
- Watch-outs: built in 1900 — expect roof / HVAC / electrical / plumbing capex.
- Climate carrying-cost: moderate flood risk — expect insurance premiums to compound above CPI over the hold.
Questions for the listing agent
- It's been on market 133 days. Have you received any prior offers? Is the seller open to a 12% concession, seller financing, or rate buy-down credit?
- Built in 1900 — when were the roof, HVAC, electrical panel, plumbing, and water heater last replaced?
- Why hasn't it sold? Are there any deal-killer items the seller is aware of (foundation, flood, title, zoning, code violations)?
- Is there a deadline driving the sale (1031 exchange, divorce, estate, relocation)? That informs how much negotiation room exists.
- Crime grade is F in this area — have there been break-ins, vandalism, or insurance claims at this property in the last 3 years? What carrier currently insures it and at what premium?
- What's the average days-on-market for RENTAL listings here right now (not sales)? A rising rental-DOM trend means longer vacancies and softer asking-rent achievability than the comps imply.
- What's the recent tenant-quality profile in this submarket — average credit score on applications, eviction rate, late-payment / NSF rate, and stable-employment percentage? A property-management company in the area should have these aggregated.
- How much new for-sale + rental construction is in the pipeline within 1–3 miles? Heavy new supply typically softens prices + rents 12–24 months out; constrained supply supports both.
Investment metrics
- 1% rule
- 2.28% ✓
- Cap rate
- 20.73%
- Cash-on-cash
- 51.56%
- DSCR
- 3.29
- GRM
- 3.7
CMA / ARV
- ARV (median comp)
- $137,137
- List price
- $55,000
- Delta
- -59.89%
- Verdict
- UNDERPRICED
- Comps
- 20 within 1.0 mi
Show comp detail 3 sales within ~0.75 mi
| Address | Dist | Beds/Ba | Sqft | Sold | Price | $/sf | Match |
|---|---|---|---|---|---|---|---|
| 35 Howell St | 0.42mi | 3/1.0 (+1) | 818 (0%) | 13mo | $185,000 | $226 | 65 |
| 139 Howell St | 0.40mi | 2/1.0 | 743 (-9%) | 19mo | $140,000 | $188 | 50 |
| 123 Hawley St | 0.52mi | 3/1.0 (+1) | 930 (+14%) | 13mo | $191,000 | $205 | 37 |
Match score weights: distance 35% · size 25% · config 20% · recency 20%. Top-matched comps best support the ARV.
Projected returns pro-forma
-3.0% appreciation · 8.0% rent growth · sell at horizon
- IRR
- 54.8%
- Equity multiple
- 3.59×
- Total profit
- $39,842
- Equity at exit
- $8,201
- IRR
- 61.7%
- Equity multiple
- 8.73×
- Total profit
- $119,050
- Equity at exit
- $4,755
Cash invested: $15,400 (down + closing). Projections, not guarantees.
Landlord ↔ Tenant lean methodology
- Overall (STATE)
- 15 Strongly Tenant-Friendly
- State New York
- 15 Strongly Tenant-Friendly · D+10
- County
- — inherits STATE
- City
- — inherits STATE
ZIP-level market 14207
- Home prices YoY
- -18.9%
- Rents YoY
- 8.2%
- Active inventory
- 199
- Price-to-rent
- 3.7×
Monthly cashflow live
- Estimated rent
- $1,253 high interval (Pro) →
- Mortgage (P&I)
- −$288
- Tax from tax record
- −$17 /mo · $202/yr
- Insurance
- −$23
- HOA
- −$0
- Vacancy / Maint / Mgmt
- −$263
- Net cashflow
- $662
Break-even live
Sensitivity live
| Price | -10% $693 | -5% $677 | +0% $662 | +5% $646 | +10% $631 |
|---|---|---|---|---|---|
| Rent | -10% $563 | -5% $612 | +0% $662 | +5% $711 | +10% $761 |
| Rate | -1.0pp $689 | -0.5pp $676 | base $662 | +0.5pp $647 | +1.0pp $633 |
UW: 25.0% down · 7.5% · 30yr · 1.5% tax · 5.0% vac · 8.0% maint · 8.0% mgmt
Financing live
Cash to close
- Down payment
- $13,750
- Closing costs
- $1,650
- Reserves months
- —
- Total cash needed
- —
Loan-product check · same deal, 3 products live
Conventional
25% down · 7.5% · 30yr
- Down + closing
- —
- Monthly P&I
- —
- Monthly cashflow
- —
- DSCR
- —
- Eligible?
- —
Personal DTI + credit; lowest rate.
DSCR
20% down · 8.5% · 30yr
- Down + closing
- —
- Monthly P&I
- —
- Monthly cashflow
- —
- DSCR
- —
- Eligible?
- —
No personal income docs; deal must DSCR.
Hard money
10% down · 12.0% · 12mo
- Down + closing
- —
- Monthly P&I
- —
- Monthly cashflow
- —
- DSCR
- —
- Eligible?
- —
Short-term bridge; refi at stabilization.
Rent comps 40 comps
| Address | Beds | Baths | Sqft | Rent | $/sqft | DOM | Units | Dist |
|---|---|---|---|---|---|---|---|---|
| 68 Peter St Buffalo, NY | 2.0 | 1.0 | 900 | $900 | $1.00 | 24d | 1 | 0.32mi |
| 155 Germain St Apt 1 Buffalo, NY | 2.0 | 1.0 | 1000 | $1,000 | $1.00 | 11d | 1 | 0.32mi |
| 215 Thompson St Buffalo, NY | 1.0 | 1.0 | 700 | $800 | $1.14 | 4d | 1 | 0.37mi |
| 72 Reservation St Unit 2 Buffalo, NY | 3.0 | 1.0 | 950 | $1,150 | $1.21 | 24d | 1 | 0.48mi |
| 1920 Niagara St Unit 1 Buffalo, NY | 2.0 | 1.0 | 695 | $999 | $1.44 | 45d | 1 | 0.50mi |
| 336 East St Buffalo, NY | 1.0 | 1.0 | 795 | $1,000 | $1.26 | 15d | 1 | 0.51mi |
| 356 Hertel Ave Buffalo, NY | 2.0 | 1.5 | 800 | $2,300 | $2.88 | 3d | 1 | 0.58mi |
| 2099 Niagara St Unit A Buffalo, NY | 2.0 | 1.0 | 1000 | $1,197 | $1.20 | 45d | 1 | 0.63mi |
| 46 Hawley St #1 Buffalo, NY | 2.0 | 1.0 | 900 | $1,300 | $1.44 | 45d | 1 | 0.64mi |
| 100 Forest Ave Buffalo, NY | 2.0–4.0 | 2.0–4.0 | 1304 | $640 | $0.49 | 3d | 14 | 0.64mi |
| 68 Laforce Pl Unit U Buffalo, NY | 2.0 | 1.0 | 900 | $1,099 | $1.22 | 45d | 1 | 0.75mi |
| 293 Grote St Buffalo, NY | 1.0–2.0 | 1.0–2.0 | 817 | $2,345 | $2.87 | 3d | 1 | 0.75mi |
| 118 Rano St Buffalo, NY | 3.0 | 1.0 | 1050 | $1,200 | $1.14 | 22d | 1 | 0.76mi |
| 1558 Elmwood Ave Unit 4 Buffalo, NY | 2.0 | 1.0 | 800 | $1,100 | $1.38 | 45d | 1 | 0.77mi |
| 37 Holmes St Buffalo, NY | 1.0 | 1.0 | 900 | $1,095 | $1.22 | 15d | 1 | 0.85mi |
| 15 Ontario St Unit 1 Buffalo, NY | 3.0 | 1.0 | 1000 | $1,500 | $1.50 | 3d | 1 | 0.86mi |
| 57 Abbottsford Pl Buffalo, NY | 2.0 | 1.0 | 1000 | $1,550 | $1.55 | 24d | 1 | 0.89mi |
| 309 Bird Ave Unit 1 Buffalo, NY | 3.0 | 1.0 | 1100 | $2,200 | $2.00 | 45d | 1 | 0.91mi |
| 30 Abbottsford Pl Buffalo, NY | 1.0 | 1.0 | 600 | $1,100 | $1.83 | 3d | 1 | 0.93mi |
| 1485 Niagara St Buffalo, NY | 1.0–2.0 | 1.0 | 925 | $2,174 | $2.35 | 3d | 1 | 0.93mi |
| 865 Richmond Ave Unit Rear Buffalo, NY | 2.0 | 1.0 | 850 | $1,100 | $1.29 | 45d | 1 | 1.02mi |
| 1116 Elmwood Ave Buffalo, NY | 1.0 | 1.0 | 700 | $995 | $1.42 | 45d | 1 | 1.11mi |
| 163 W Delavan Ave Buffalo, NY | 3.0 | 1.0 | 1000 | $1,500 | $1.50 | 24d | 1 | 1.12mi |
| 239 Crowley Ave Buffalo, NY | 2.0 | 1.0 | 966 | $1,025 | $1.06 | 4d | 1 | 1.12mi |
| 466 W Delavan Ave Unit 3 Buffalo, NY | 1.0 | 1.0 | 800 | $1,350 | $1.69 | 45d | 1 | 1.23mi |
| 1015 Elmwood Ave Unit 2 Buffalo, NY | 1.0 | 1.0 | 900 | $1,400 | $1.56 | 45d | 1 | 1.26mi |
| 1015 Elmwood Ave Unit 3 Buffalo, NY | 2.0 | 2.0 | 1000 | $1,400 | $1.40 | 45d | 1 | 1.26mi |
| 257 Lafayette Ave Unit 317 Buffalo, NY | 2.0 | 1.0 | 897 | $1,400 | $1.56 | 24d | 1 | 1.28mi |
| 257 Lafayette Ave Apt 319 Buffalo, NY | 2.0 | 1.0 | 900 | $1,395 | $1.55 | 24d | 1 | 1.28mi |
| 116 Bidwell Pkwy Buffalo, NY | 1.0 | 1.0 | 550 | $1,375 | $2.50 | 4d | 3 | 1.29mi |
| 2002 Delaware Ave Unit 3 Buffalo, NY | 1.0 | 1.0 | 675 | $1,125 | $1.67 | 45d | 1 | 1.32mi |
| 2002 Delaware Ave Unit 4 Buffalo, NY | 2.0 | 1.0 | 725 | $1,250 | $1.72 | 45d | 1 | 1.32mi |
| 134 Philadelphia St Buffalo, NY | 3.0 | 1.0 | 871 | $1,100 | $1.26 | 4d | 1 | 1.33mi |
| 15 Beatrice Ave Buffalo, NY | 2.0 | 1.0 | 950 | $1,150 | $1.21 | 15d | 1 | 1.33mi |
| 1998 Delaware Ave Unit 5 Buffalo, NY | 1.0 | 1.0 | 675 | $1,125 | $1.67 | 24d | 1 | 1.33mi |
| 1998 Delaware Ave Unit 3 Buffalo, NY | 1.0 | 1.0 | 675 | $1,125 | $1.67 | 45d | 1 | 1.33mi |
| 2022 Delaware Ave Unit 5 Buffalo, NY | 2.0 | 1.0 | 725 | $1,250 | $1.72 | 45d | 1 | 1.33mi |
| 1982 Delaware Ave Unit 5 Buffalo, NY | 2.0 | 1.0 | 725 | $1,250 | $1.72 | 45d | 1 | 1.33mi |
| 136 Parkdale Ave Unit 1 Buffalo, NY | 1.0 | 1.0 | 900 | $900 | $1.00 | 45d | 1 | 1.33mi |
| 196 Auburn Ave Buffalo, NY | 3.0 | 1.0 | 1000 | $1,300 | $1.30 | 45d | 1 | 1.33mi |
Listing history 17 events
-
2026-06-18days on market $55,000 Active 133 DOM
-
2026-06-17days on market $55,000 Active 132 DOM
-
2026-06-16days on market $55,000 Active 131 DOM
-
2026-06-15days on market $55,000 Active 130 DOM
-
2026-06-13days on market $55,000 Active 128 DOM
-
2026-06-13days on market $55,000 Active 127 DOM
-
2026-06-10days on market $55,000 Active 125 DOM
-
2026-06-09days on market $55,000 Active 124 DOM
-
2026-06-08days on market $55,000 Active 123 DOM
-
2026-06-07days on market $55,000 Active 122 DOM
-
2026-06-03days on market $55,000 Active 118 DOM
-
2026-06-02days on market $55,000 Active 117 DOM
-
2026-06-01days on market $55,000 Active 116 DOM
-
2026-05-31days on market $55,000 Active 115 DOM
-
2026-02-05$55,000 Active 218-char remark
Show marketing remark (218 chars)
Seller began remodeling with an open concept in mind. Roof is one yr old. New HWT. Some new windows. A complete rehab at a great price in Black Rock. Seller will remove all building materials and debris before closing.
-
2025-09-29historical
-
2025-07-07$55,000 Active
ⓘ Source: listings_history table (triggers on properties + properties_extension) + one-shot
backfill from property_details.listing_events for pre-trigger history.
Tax reassessment forecast NY · Partial reset (capped growth)
- Current annual tax
- $202 · $17/mo
- Projected year-2 tax
- $566 · $47/mo
- Expected delta
- +$364/yr (+$30/mo · 180.3%)
ⓘ Screening estimate from a state-policy table — verify with the county assessor before closing.
Climate risk First Street
- Flood 5/10 Major FEMA zone X (unshaded) · 62% chance over 30 yrs
- Wildfire 1/10 Low
- Heat 3/10 Moderate 7 d/yr ≥92°F today · 15 d/yr by 30 yrs out
- Wind 1/10 Low
- Air quality 4/10 Moderate 4 unhealthy d/yr today · 9 by 30 yrs out
Nearby sold comps map
Loading sold comps map…
Walkable amenities ~0.75 mi
Loading nearby amenities…
Taxation est. · year 1
- Rental income
- $15,036
- − Mortgage interest
- −$3,081
- − Property taxes
- −$202
- − Insurance
- −$275
- − Repairs & maintenance
- −$1,203
- − Management
- −$1,203
- − Depreciation
- −$1,600
- Taxable income
- $7,473
- Est. tax owed @ 24.0%
- −$1,793
- After-tax cash flow
- $6,147/yr
For passive investors: Depreciation is non-cash, so a rental often shows a tax loss while cash-flowing — sheltering income. Rental losses are passive: they offset passive income freely, and up to $25,000/yr can offset ordinary (W-2) income if you actively participate and your MAGI is under $100k (phasing out to $0 by $150k); unused losses carry forward. On sale, claimed depreciation is recaptured at up to 25%, and gains may owe capital-gains tax (a 1031 exchange can defer both). Figures are a year-1 estimate at your 24.0% rate — not tax advice; consult a CPA.
Schools (NCES district)
- District
- Buffalo City School District
- NCES district ID
- 3605850
- Math proficiency
- 41% ▲ 11.00%
- Reading proficiency
- 40% ▲ 7.00%
- Median HH income
- $31,665
- Composite
- 33.17/100
- National rank
- #5544
- State rank
- #535 of 590 in NY
Livability — Buffalo
- Score
- 77/100
- State rank
- #195
- US rank
- #3011
Category grades
Schools grade is shown separately in the Schools card above.
Census & demographics
- Census place
- Buffalo, NY
- County
- Erie County · 714,559 people
- City population
- 440,021
- Metro
- Buffalo-Cheektowaga, NY
- Population (ZIP)
- 26,327
- Household income
- $39,753
- Rent vs Own
- Severe rent burden
- 2177.0
Population outlook (Erie County) Hauer SSP2
- Today (2025)
- 933,037 people
- By 2030
- 935,181 · +0.2%
- By 2040
- 928,531 · -0.5%
- By 2050
- 905,725 · -2.9%
- By 2075
- 834,037 · -10.6%
- By 2100
- 708,033 · -24.1%
Race, ethnicity, and origin ACS 2023
- Neighborhood character
- Highly diverse neighborhood (Simpson 0.74)
- Race & ethnicity
- White 40% Hispanic / Latino 23% Black 16% Asian 15% Two or more races 14%
- Hispanic origin (detail)
- Puerto Rican 18% Dominican 2%
- Common ancestry
- Romanian 8% Portuguese 1% Arab 1%
- Foreign-born
- 19% · Philippines, Canada, India
- Languages at home
- 65% English-only · Spanish 14% Other Asian/Pacific 10% Other Indo-European 5%
Political lean MEDSL · Erie
- 2024 margin
- Lean D (+9.7) · D 54.8% · R 45.2%
- 2008→2024 swing
- -7.9pp toward R · 2008: 17.5pp · 2024: 9.7pp
- All cycles
- 2024: D+9.7 2020: D+14.7 2016: D+4.8 2012: D+15.6 2008: D+17.5
Not yet ingested
- Civics
- —
Market trends
- HPI YoY
- ▼ -54.42%
- Current HPI
- 233.0902
- Rent YoY
- ▲ 8.19%
- Metro
- Buffalo-Cheektowaga, NY
- State GDP YoY
- ▲ 2.60%
- F500 in state
- 92
Industry mix (Fortune 500 HQ in NY)
| Industry | F500 HQs | Revenue |
|---|---|---|
| Financial Services | 10 | $950B |
|
||
| Consumer Goods | 9 | $162B |
|
||
| Insurance | 4 | $225B |
|
||
| Telecommunications | 2 | $144B |
|
||
| Pharmaceuticals | 2 | $112B |
|
||
| Media / Entertainment | 2 | $69B |
|
||
Price history
+0.0% since first listed3 events — show timeline
- 2026-02-05 Listed $55,000 WNYREIS
- 2025-09-29 Listing Removed — WNYREIS
- 2025-07-07 Listed $55,000 WNYREIS
Property tax history
+5.3%/yrLatest (2025): $202 · +0.0% YoY. Source: county tax records.
Cash-flow waterfall
monthlySold comps — $/sqft
last 12 mo · ≤1 miLoading sold comps…