8114 E 36th St · Indianapolis city (balance), IN
Flood risk 3/10 · Minor
- FEMA flood zone
- X (shaded)
- Chance of flooding over 30 yrs
- 0.2%
- Est. flood insurance / yr
- $507 – $1,088
Fire risk 1/10 · Minimal
- Est. fire insurance / yr
- $717 – $1,331
Heat risk 3/10 · Minor
- Hot days now (above 101°F)
- 7 days/yr
- Hot days in 30 yrs
- 18 days/yr
Wind risk 2/10 · Minimal
- Chance of severe wind over 30 yrs
- 1.0%
Air-quality risk 3/10 · Minor
- Unhealthy air days now
- 3 days/yr
- Unhealthy air days in 30 yrs
- 4 days/yr
Risk factors via First Street. Map © Google.
Why this score? — see what drove the D grade
The composite is a weighted blend of 9 inputs, each scored 0–100. Each bar is that input's sub-score; the figure is the points it added to the 100-point composite (weight × sub-score).
- Cash flow +13.8/30.0
- ARV discount +9.1/15.0
- 1% rule +4.8/10.0
- DSCR +4.2/10.0
- Rent growth +4.2/5.0
- Livability +2.5/5.0
- Condition / age +2.5/5.0
- Schools +1.4/10.0
- Appreciation +0.0/10.0
$159,900
🖨 Deal sheet (PDF) 📄 Offer letter ✓ Due diligence
Listing remarks MLS
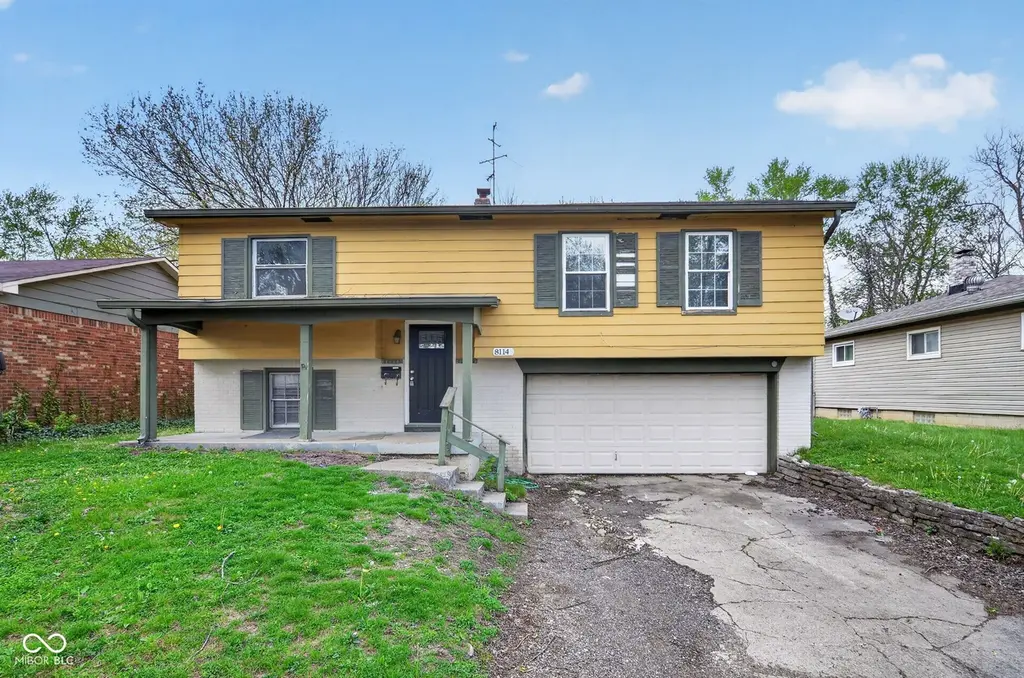
Welcome to this charming single-story ranch home located on the east side of Indianapolis. Built in 1964, this detached residence offers a classic layout with comfortable living spaces and great potential for customization. Situated on a spacious lot in an established neighborhood, the property provides a peaceful residential setting while remaining conveniently close to schools, shopping, dining, and major roadways. This home is ideal for buyers seeking a solid investment opportunity or a place to make their own. With its traditional design and functional floor plan, it offers a great foundation for updates and modern touches. Whether you're a first-time homebuyer or an investor, this property presents excellent value and potential in a well-connected location.
Key facts
- Spacious lot
- 7,187 sq ft lot
- 2 garage spots
Tags
Neighborhood map
What this means for you Summary
Snapshot
- This is a 3-bed/1.5-bath single-family listed at $160k.
Deal economics
- At list price, monthly cash flow is $16 ($188/yr) — positive.
- The deal already cash-flows at list — no discount required.
- To meet the 1% rule (rent ≥ 1% of price), the offer needs to be $156k (2.4% below list).
- Recommended offer: $155k (3.0% below list) — sets the bar for market timing.
- Cap rate 6.4% vs local median 4.4% in Indianapolis city (balance) — top-decile yield for the area; either an underpriced asset or a hidden risk that comps aren't pricing in. Stress-test before assuming the spread holds.
Location & tenants
- Location reads: area grade D — affects rentability + tenant quality, not the cash-flow math above.
- Indianapolis Public Schools (urban): math 14% / reading 20% proficiency, ranked #286 of 301 in IN (top 95%) — low school quality limits family demand, transient renter base, plan for 1-2y turnover; 77% free/reduced lunch — lower-income household profile, screen leases tightly.
- Zoned schools: Center For Inquiry School 27 (math 25% / reading 29%, grade F, #737 of 994 statewide, top 76%, 525 students, 51% FRL); H L Harshman Middle School (math 3% / reading 16%, grade F, #316 of 330 statewide, top 96%, 549 students, 84% FRL).
- Market conditions: Rents rising fast (+6.8%/yr); 153 active listings in the ZIP; 4 comparable units currently listed for rent nearby; rentals at typical pace (median 17d on market — plan ~3-4 weeks tenant-placement turnaround); 1,906 units permitted in Marion County in 2024 (621 in 5+ unit buildings).
- This rent runs 37% of the median local income ($50k/yr) — at the standard rent-burdened threshold; future hikes will face affordability resistance.
Forward outlook
- Local home prices are declining (-3.0%/yr); year-one equity from $1k of loan paydown is wiped out by about $5k of value loss. Plan a longer hold.
- Marion County population projected at +18% by 2050 — long-run rental-demand tailwind backs the buy-and-hold thesis.
Negotiation context
- It's been on market 53 days — a 3% lower offer ($155k) is reasonable based on typical stale-listing flexibility.
- 3 sale attempts since 10y ago; this cycle's ask has dropped $60k (27%) from the opening price — seller is motivated, your offer sets the floor, not the list.
- Current owner paid $49k; list at $160k implies a 226% gain — meaningful room to come down on a strong offer.
Questions for the listing agent
- It's been on market 53 days. Have you received any prior offers? Is the seller open to a 3% concession, seller financing, or rate buy-down credit?
- Built in 1962 — when were the roof, HVAC, electrical panel, plumbing, and water heater last replaced?
- Is there a deadline driving the sale (1031 exchange, divorce, estate, relocation)? That informs how much negotiation room exists.
- The area grade is low — what's the realistic commute time and amenity access for the typical tenant pool here? Any planned neighborhood developments (good or bad) we should know about?
- What's the average days-on-market for RENTAL listings here right now (not sales)? A rising rental-DOM trend means longer vacancies and softer asking-rent achievability than the comps imply.
- What's the recent tenant-quality profile in this submarket — average credit score on applications, eviction rate, late-payment / NSF rate, and stable-employment percentage? A property-management company in the area should have these aggregated.
- How much new for-sale + rental construction is in the pipeline within 1–3 miles? Heavy new supply typically softens prices + rents 12–24 months out; constrained supply supports both.
Investment metrics
- 1% rule
- 0.98% ✗
- Cap rate
- 6.41%
- Cash-on-cash
- 0.42%
- DSCR
- 1.02
- GRM
- 8.5
CMA / ARV
- ARV (median comp)
- $165,986
- List price
- $159,900
- Delta
- -3.67%
- Verdict
- FAIR
- Comps
- 20 within 1.0 mi
Show comp detail 12 sales within ~0.75 mi
| Address | Dist | Beds/Ba | Sqft | Sold | Price | $/sf | Match |
|---|---|---|---|---|---|---|---|
| 3607 Wellington Ave | 0.28mi | 3/1.5 | 2,134 (-6%) | 5mo | $163,000 | $76 | 73 |
| 3537 Cecil Ave | 0.10mi | 3/1.5 | 1,960 (-14%) | 1mo | $165,000 | $84 | 72 |
| 3541 Alpine Pl | 0.31mi | 4/3.0 (+1) | 2,276 (+0%) | 12mo | $221,500 | $97 | 64 |
| 3544 Cecil Ave | 0.08mi | 4/1.5 (+1) | 1,960 (-14%) | 6mo | $175,000 | $89 | 64 |
| 3976 Marseille Rd | 0.67mi | 3/2.0 | 2,206 (-3%) | 1mo | $195,000 | $88 | 61 |
| 7919 Penway St | 0.24mi | 4/2.0 (+1) | 2,000 (-12%) | 2mo | $175,000 | $88 | 61 |
| 3449 Seine Ct | 0.65mi | 4/1.5 (+1) | 2,160 (-5%) | 2mo | $195,000 | $90 | 55 |
| 7602 Penway St | 0.53mi | 4/2.0 (+1) | 2,080 (-8%) | 3mo | $235,000 | $113 | 51 |
| 7514 Ruskin Pl | 0.62mi | 4/2.5 (+1) | 2,240 (-1%) | 12mo | $190,000 | $85 | 50 |
| 8309 E 41st Pl | 0.73mi | 4/2.0 (+1) | 2,200 (-3%) | 7mo | $240,000 | $109 | 48 |
| 3675 Dubarry Rd | 0.54mi | 4/2.0 (+1) | 2,035 (-10%) | 4mo | $215,000 | $106 | 47 |
| 3949 Chateau Dr | 0.67mi | 4/2.0 (+1) | 1,998 (-12%) | 9mo | $250,000 | $125 | 34 |
Match score weights: distance 35% · size 25% · config 20% · recency 20%. Top-matched comps best support the ARV.
Projected returns pro-forma
-3.0% appreciation · 6.76% rent growth · sell at horizon
- IRR
- -11.1%
- Equity multiple
- 0.58×
- Total profit
- $-18,693
- Equity at exit
- $23,842
- IRR
- 3.3%
- Equity multiple
- 1.28×
- Total profit
- $12,548
- Equity at exit
- $13,825
Cash invested: $44,772 (down + closing). Projections, not guarantees.
Landlord ↔ Tenant lean methodology
- Overall (STATE)
- 90 Strongly Landlord-Friendly
- State Indiana
- 90 Strongly Landlord-Friendly · R+11
- County
- — inherits STATE
- City
- — inherits STATE
ZIP-level market 46226
- Rents YoY
- 6.8%
- Active inventory
- 153
- Price-to-rent
- 8.5×
Monthly cashflow live
- Estimated rent
- $1,560 medium interval (Pro) →
- Mortgage (P&I)
- −$839
- Tax from tax record
- −$312 /mo · $3,742/yr
- Insurance
- −$67
- HOA
- −$0
- Vacancy / Maint / Mgmt
- −$328
- Net cashflow
- $16
Break-even live
Sensitivity live
| Price | -10% $106 | -5% $61 | +0% $16 | +5% $-30 | +10% $-75 |
|---|---|---|---|---|---|
| Rent | -10% $-108 | -5% $-46 | +0% $16 | +5% $77 | +10% $139 |
| Rate | -1.0pp $96 | -0.5pp $56 | base $16 | +0.5pp $-26 | +1.0pp $-68 |
UW: 25.0% down · 7.5% · 30yr · 1.5% tax · 5.0% vac · 8.0% maint · 8.0% mgmt
Financing live
Cash to close
- Down payment
- $39,975
- Closing costs
- $4,797
- Reserves months
- —
- Total cash needed
- —
Loan-product check · same deal, 3 products live
Conventional
25% down · 7.5% · 30yr
- Down + closing
- —
- Monthly P&I
- —
- Monthly cashflow
- —
- DSCR
- —
- Eligible?
- —
Personal DTI + credit; lowest rate.
DSCR
20% down · 8.5% · 30yr
- Down + closing
- —
- Monthly P&I
- —
- Monthly cashflow
- —
- DSCR
- —
- Eligible?
- —
No personal income docs; deal must DSCR.
Hard money
10% down · 12.0% · 12mo
- Down + closing
- —
- Monthly P&I
- —
- Monthly cashflow
- —
- DSCR
- —
- Eligible?
- —
Short-term bridge; refi at stabilization.
Rent comps 4 comps
| Address | Beds | Baths | Sqft | Rent | $/sqft | DOM | Units | Dist |
|---|---|---|---|---|---|---|---|---|
| 8513 E 37th Pl Indianapolis, IN | 4.0 | 1.5 | 1645 | $1,525 | $0.93 | 0d | 1 | 0.43mi |
| 3644 Celtic Dr Indianapolis, IN | 4.0 | 1.5 | 1637 | $1,500 | $0.92 | 16d | 1 | 1.09mi |
| 3722 Ireland Dr Indianapolis, IN | 3.0 | 2.0 | 1682 | $1,700 | $1.01 | 46d | 1 | 1.19mi |
| 9513 Baker Ct Indianapolis, IN | 4.0 | 2.0 | 1702 | $1,825 | $1.07 | 9d | 1 | 1.43mi |
Listing history 22 events
-
2026-06-21days on market $159,900 Active 53 DOM
-
2026-06-18days on market $159,900 Active 50 DOM
-
2026-06-17days on market $159,900 Active 49 DOM
-
2026-06-16days on market $159,900 Active 48 DOM
-
2026-06-15days on market $159,900 Active 47 DOM
-
2026-06-13days on market $159,900 Active 45 DOM
-
2026-06-13pricedays on market $159,900 Active 44 DOM
-
2026-06-09days on market $219,900 Active 41 DOM
-
2026-06-08days on market $219,900 Active 40 DOM
-
2026-06-07days on market $219,900 Active 39 DOM
-
2026-06-03days on market $219,900 Active 35 DOM
-
2026-06-02days on market $219,900 Active 34 DOM
-
2026-06-01days on market $219,900 Active 33 DOM
-
2026-05-31days on market $219,900 Active 32 DOM
-
2026-05-19status Active 775-char remark
Show marketing remark (775 chars)
Welcome to this charming single-story ranch home located on the east side of Indianapolis. Built in 1964, this detached residence offers a classic layout with comfortable living spaces and great potential for customization. Situated on a spacious lot in an established neighborhood, the property provides a peaceful residential setting while remaining conveniently close to schools, shopping, dining, and major roadways. This home is ideal for buyers seeking a solid investment opportunity or a place to make their own. With its traditional design and functional floor plan, it offers a great foundation for updates and modern touches. Whether you're a first-time homebuyer or an investor, this property presents excellent value and potential in a well-connected location.
-
2026-05-07status Pending 775-char remark
Show marketing remark (775 chars)
Welcome to this charming single-story ranch home located on the east side of Indianapolis. Built in 1964, this detached residence offers a classic layout with comfortable living spaces and great potential for customization. Situated on a spacious lot in an established neighborhood, the property provides a peaceful residential setting while remaining conveniently close to schools, shopping, dining, and major roadways. This home is ideal for buyers seeking a solid investment opportunity or a place to make their own. With its traditional design and functional floor plan, it offers a great foundation for updates and modern touches. Whether you're a first-time homebuyer or an investor, this property presents excellent value and potential in a well-connected location.
-
2026-04-17$219,900 Active 775-char remark
Show marketing remark (775 chars)
Welcome to this charming single-story ranch home located on the east side of Indianapolis. Built in 1964, this detached residence offers a classic layout with comfortable living spaces and great potential for customization. Situated on a spacious lot in an established neighborhood, the property provides a peaceful residential setting while remaining conveniently close to schools, shopping, dining, and major roadways. This home is ideal for buyers seeking a solid investment opportunity or a place to make their own. With its traditional design and functional floor plan, it offers a great foundation for updates and modern touches. Whether you're a first-time homebuyer or an investor, this property presents excellent value and potential in a well-connected location.
-
2016-10-24soldstatus $49,000 Sold 225-char remark
Show marketing remark (225 chars)
DRASTICALLY REDUCED!!!!SELLING A NICE 3 BED - BI-LEVEL 2CAR GARAGE hardwoods fireplace updated kitchenREFINISHED HARDWOOD FLOORSUPDATED KITCHEN UPDATED BATHROOMS BEAUTIFUL HOMEFAMILY ROOM MAIN LEVELBONUS/GAME ROOM LOWER LEVEL
-
2016-09-21price $65,900 225-char remark
Show marketing remark (225 chars)
DRASTICALLY REDUCED!!!!SELLING A NICE 3 BED - BI-LEVEL 2CAR GARAGE hardwoods fireplace updated kitchenREFINISHED HARDWOOD FLOORSUPDATED KITCHEN UPDATED BATHROOMS BEAUTIFUL HOMEFAMILY ROOM MAIN LEVELBONUS/GAME ROOM LOWER LEVEL
-
2016-08-02price $75,900 225-char remark
Show marketing remark (225 chars)
DRASTICALLY REDUCED!!!!SELLING A NICE 3 BED - BI-LEVEL 2CAR GARAGE hardwoods fireplace updated kitchenREFINISHED HARDWOOD FLOORSUPDATED KITCHEN UPDATED BATHROOMS BEAUTIFUL HOMEFAMILY ROOM MAIN LEVELBONUS/GAME ROOM LOWER LEVEL
-
2016-07-23$81,900 Active 225-char remark
Show marketing remark (225 chars)
DRASTICALLY REDUCED!!!!SELLING A NICE 3 BED - BI-LEVEL 2CAR GARAGE hardwoods fireplace updated kitchenREFINISHED HARDWOOD FLOORSUPDATED KITCHEN UPDATED BATHROOMS BEAUTIFUL HOMEFAMILY ROOM MAIN LEVELBONUS/GAME ROOM LOWER LEVEL
-
2002-05-03soldstatus $83,790
ⓘ Source: listings_history table (triggers on properties + properties_extension) + one-shot
backfill from property_details.listing_events for pre-trigger history.
Tax reassessment forecast IN · Partial reset (capped growth)
- Current annual tax
- $3,742 · $312/mo
- Projected year-2 tax
- $3,742 · $312/mo
- Expected delta
- $0/yr ($0/mo · 0.0%)
ⓘ Screening estimate from a state-policy table — verify with the county assessor before closing.
Climate risk First Street
- Flood 3/10 Moderate FEMA zone X (shaded) · 20% chance over 30 yrs
- Wildfire 1/10 Low
- Heat 3/10 Moderate 7 d/yr ≥101°F today · 18 d/yr by 30 yrs out
- Wind 2/10 Low 100% chance of damaging wind over 30 yrs
- Air quality 3/10 Moderate 3 unhealthy d/yr today · 4 by 30 yrs out
Nearby sold comps map
Loading sold comps map…
Walkable amenities ~0.75 mi
Loading nearby amenities…
Taxation est. · year 1
- Rental income
- $18,724
- − Mortgage interest
- −$8,957
- − Property taxes
- −$3,742
- − Insurance
- −$800
- − Repairs & maintenance
- −$1,498
- − Management
- −$1,498
- − Depreciation
- −$4,652
- Taxable loss
- −$2,422
- Est. tax savings @ 24.0%
- +$581
- After-tax cash flow
- $769/yr
For passive investors: Depreciation is non-cash, so a rental often shows a tax loss while cash-flowing — sheltering income. Rental losses are passive: they offset passive income freely, and up to $25,000/yr can offset ordinary (W-2) income if you actively participate and your MAGI is under $100k (phasing out to $0 by $150k); unused losses carry forward. On sale, claimed depreciation is recaptured at up to 25%, and gains may owe capital-gains tax (a 1031 exchange can defer both). Figures are a year-1 estimate at your 24.0% rate — not tax advice; consult a CPA.
Schools (NCES district)
- District
- Indianapolis Public Schools
- NCES district ID
- 1804770
- Math proficiency
- 14% ▼ -7.00%
- Reading proficiency
- 20% ▼ -3.00%
- Median HH income
- $32,034
- Composite
- 13.69/100
- National rank
- #9499
- State rank
- #286 of 301 in IN
Livability — Indianapolis city (balance)
No livability data for this city. (Only ~50 U.S. cities are tracked.)
Census & demographics
- Census place
- Indianapolis city (balance), IN
- County
- Marion County · 998,460 people
- City population
- 881,119
- Metro
- Indianapolis-Carmel-Anderson, IN
- Population (ZIP)
- 47,099
- Household income
- $50,325
- Rent vs Own
- Severe rent burden
- 2742.0
Population outlook (Marion County) Hauer SSP2
- Today (2025)
- 1,025,572 people
- By 2030
- 1,065,727 · +3.9%
- By 2040
- 1,141,577 · +11.3%
- By 2050
- 1,208,920 · +17.9%
- By 2075
- 1,367,288 · +33.3%
- By 2100
- 1,438,201 · +40.2%
Race, ethnicity, and origin ACS 2023
- Neighborhood character
- Diverse neighborhood (Simpson 0.62)
- Race & ethnicity
- Black 53% White 25% Hispanic / Latino 17% Two or more races 9% Asian 2%
- Hispanic origin (detail)
- Mexican 11%
- Common ancestry
- Lithuanian 1% Italian 1% Romanian 1%
- Foreign-born
- 11% · Canada
- Languages at home
- 86% English-only · Spanish 10% French/Haitian/Cajun 1% Other Asian/Pacific 1%
Political lean MEDSL · Marion
- 2024 margin
- Strong D (+27.7) · D 63.0% · R 35.3% · Other 1.7%
- 2008→2024 swing
- -0.7pp no change · 2008: 28.4pp · 2024: 27.7pp
- All cycles
- 2024: D+27.7 2020: D+29.1 2016: D+22.8 2012: D+22.2 2008: D+28.4
Not yet ingested
- Civics
- —
Market trends
- HPI YoY
- ▼ -218.85%
- Current HPI
- 239.43
- Rent YoY
- ▲ 6.76%
- Metro
- Indianapolis-Carmel-Anderson, IN
- State GDP YoY
- ▲ 2.90%
- F500 in state
- 18
Industry mix (Fortune 500 HQ in IN)
| Industry | F500 HQs | Revenue |
|---|---|---|
| Industrial Machinery | 2 | $37B |
|
||
| Healthcare | 1 | $177B |
|
||
| Pharmaceuticals | 1 | $45B |
|
||
| Metals / Steel | 1 | $18B |
|
||
| Agriculture | 1 | $17B |
|
||
| Packaging | 1 | $12B |
|
||
Price history
+162.4% since first listed8 events — show timeline
- 2026-05-19 Relisted — MIBOR as Distributed by MLS Grid
- 2026-05-07 Pending — MIBOR as Distributed by MLS Grid
- 2026-04-17 Listed $219,900 MIBOR as Distributed by MLS Grid
- 2016-10-24 Sold (MLS) $49,000 MIBOR as Distributed by MLS Grid
- 2016-09-21 Price Changed $65,900 MIBOR as Distributed by MLS Grid
- 2016-08-02 Price Changed $75,900 MIBOR as Distributed by MLS Grid
- 2016-07-23 Listed $81,900 MIBOR as Distributed by MLS Grid
- 2002-05-03 Sold (Public Records) $83,790 Public Records
Property tax history
+12.3%/yrLatest (2025): $3,742 · +27.3% YoY. Source: county tax records.
Cash-flow waterfall
monthlySold comps — $/sqft
last 12 mo · ≤1 miLoading sold comps…