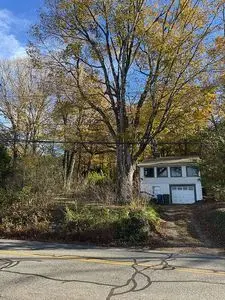
271 Lake Rd · Andover, CT
Flood risk No data
- FEMA flood zone
- —
- Chance of flooding over 30 yrs
- —
- Est. flood insurance / yr
- —
Fire risk No data
- Est. fire insurance / yr
- —
Heat risk No data
- Hot days now (above threshold)
- —
- Hot days in 30 yrs
- —
Wind risk No data
- Chance of severe wind over 30 yrs
- —
Air-quality risk No data
- Unhealthy air days now
- —
- Unhealthy air days in 30 yrs
- —
Risk factors via First Street. Map © Google.
Why this score? — see what drove the D+ grade
The composite is a weighted blend of 9 inputs, each scored 0–100. Each bar is that input's sub-score; the figure is the points it added to the 100-point composite (weight × sub-score).
- Cash flow +21.2/30.0
- DSCR +6.8/10.0
- Schools +5.6/10.0
- 1% rule +5.2/10.0
- Rent growth +2.5/5.0
- Livability +2.5/5.0
- Condition / age +2.5/5.0
- ARV discount +0.0/15.0
- Appreciation +0.0/10.0
$255,000
🖨 Deal sheet 📄 Offer letter ✓ Due diligence
Listing remarks
Large east facing deck with views of the lake. Large windows face north toward Andover lake from an enclosed front porch. Original wood floors in spacious living room with beautiful field stone fireplace and center chimney. Kitchen has newer laminate flooring and exposed field stone chimney with sliding glass doors that open out to the deck. Full bath -tub/shower and elongated energy efficient toilet. Rear bedroom has 2 closets and other bedroom has one. Stairs lead to second floor updated open loft with large closet and eaves for storage. Exposed field stone center chimney offers a cozy spacious area. Perfect starter home that is in & acirc; & euro; & oelig; move in & acir
Key facts
- Original wood floors
- East facing deck
- Views of the lake
Tags
Neighborhood map
What this means for you Summary
Snapshot
- This is a 2-bed/1.0-bath single-family listed at $255k.
Deal economics
- At list price, monthly cash flow is $368 ($4k/yr) — positive.
- The deal already cash-flows at list — no discount required.
- Meets the 1% rule at list price ($3k rent vs $255k).
- Recommended offer: $251k (1.5% below list) — sets the bar for market timing.
Location & tenants
- Location reads: area grade D — affects rentability + tenant quality, not the cash-flow math above.
- Regional School District 08 (rural): math 54% / reading 65% proficiency, ranked #34 of 153 in CT (top 22%) — acceptable for families but not a draw, mixed tenant base, ~2y average lease; only 6% free/reduced lunch — higher-income household profile.
- Market conditions: 14 active listings in the ZIP; 1 comparable units currently listed for rent nearby; 1,867 units permitted in Capitol Planning Region in 2024 (1,399 in 5+ unit buildings).
Forward outlook
- Local home prices are declining (-3.0%/yr); year-one equity from $2k of loan paydown is wiped out by about $8k of value loss. Plan a longer hold.
Negotiation context
- It's been on market 24 days — a 2% lower offer ($251k) is reasonable based on typical stale-listing flexibility.
Risks & watch-outs
- Watch-outs: built in 1950 — expect roof / HVAC / electrical / plumbing capex.
Questions for the listing agent
- Built in 1950 — when were the roof, HVAC, electrical panel, plumbing, and water heater last replaced?
- Is there a deadline driving the sale (1031 exchange, divorce, estate, relocation)? That informs how much negotiation room exists.
- The area grade is low — what's the realistic commute time and amenity access for the typical tenant pool here? Any planned neighborhood developments (good or bad) we should know about?
- What's the average days-on-market for RENTAL listings here right now (not sales)? A rising rental-DOM trend means longer vacancies and softer asking-rent achievability than the comps imply.
- What's the recent tenant-quality profile in this submarket — average credit score on applications, eviction rate, late-payment / NSF rate, and stable-employment percentage? A property-management company in the area should have these aggregated.
- How much new for-sale + rental construction is in the pipeline within 1–3 miles? Heavy new supply typically softens prices + rents 12–24 months out; constrained supply supports both.
Investment metrics
- 1% rule
- 1.02% ✓
- Cap rate
- 8.03%
- Cash-on-cash
- 6.19%
- DSCR
- 1.28
- GRM
- 8.2
CMA / ARV
- ARV (on-the-fly)
- $198,432
- Comps found
- 3
Show comp detail 3 sales within ~0.75 mi
| Address | Dist | Beds/Ba | Sqft | Sold | Price | $/sf | Match |
|---|---|---|---|---|---|---|---|
| 277 lake Rd | 0.04mi | 2/1.0 | 943 (+11%) | 4mo | $140,000 | $148 | 76 |
| 233 Lake Rd | 0.19mi | 2/1.5 | 860 (+1%) | 13mo | $310,000 | $360 | 76 |
| 239 Lake Rd | 0.16mi | 2/1.0 | 942 (+11%) | 5mo | $220,500 | $234 | 70 |
Match score weights: distance 35% · size 25% · config 20% · recency 20%. Top-matched comps best support the ARV.
Projected returns pro-forma
-3.0% appreciation · 3.0% rent growth · sell at horizon
- IRR
- -6.8%
- Equity multiple
- 0.75×
- Total profit
- $-17,885
- Equity at exit
- $38,021
- IRR
- 2.8%
- Equity multiple
- 1.20×
- Total profit
- $14,582
- Equity at exit
- $22,048
Cash invested: $71,400 (down + closing). Projections, not guarantees.
Landlord ↔ Tenant lean methodology
- Overall (STATE)
- 27 Tenant-Leaning
- State Connecticut
- 27 Tenant-Leaning · D+7
- County
- — inherits STATE
- City
- — inherits STATE
ZIP-level market 06232
- Home prices YoY
- -4.2%
- Active inventory
- 14
- Price-to-rent
- 8.2×
Monthly cashflow live
- Estimated rent
- $2,600 medium interval (Pro) →
- Mortgage (P&I)
- −$1,337
- Tax from tax record
- −$242 /mo · $2,909/yr
- Insurance
- −$106
- HOA
- −$0
- Vacancy / Maint / Mgmt
- −$546
- Net cashflow
- $368
Break-even live
UW: 25.0% down · 7.5% · 30yr · 1.5% tax · 5.0% vac · 8.0% maint · 8.0% mgmt
Financing live
Cash to close
- Down payment
- $63,750
- Closing costs
- $7,650
- Reserves months
- —
- Total cash needed
- —
Loan-product check · same deal, 3 products live
Conventional
25% down · 7.5% · 30yr
- Down + closing
- —
- Monthly P&I
- —
- Monthly cashflow
- —
- DSCR
- —
- Eligible?
- —
Personal DTI + credit; lowest rate.
DSCR
20% down · 8.5% · 30yr
- Down + closing
- —
- Monthly P&I
- —
- Monthly cashflow
- —
- DSCR
- —
- Eligible?
- —
No personal income docs; deal must DSCR.
Hard money
10% down · 12.0% · 12mo
- Down + closing
- —
- Monthly P&I
- —
- Monthly cashflow
- —
- DSCR
- —
- Eligible?
- —
Short-term bridge; refi at stabilization.
Rent comps 1 comps
| Address | Beds | Baths | Sqft | Rent | $/sqft | DOM | Units | Dist |
|---|---|---|---|---|---|---|---|---|
| 277 Lake Rd Andover, CT | 2.0 | 1.0 | 943 | $2,600 | $2.76 | 10d | 1 | 0.04mi |
Listing history 16 events
-
2026-06-18days on market $255,000 Active 24 DOM
-
2026-06-17days on market $255,000 Active 23 DOM
-
2026-06-16days on market $255,000 Active 22 DOM
-
2026-06-15days on market $255,000 Active 21 DOM
-
2026-06-13days on market $255,000 Active 19 DOM
-
2026-06-12days on market $255,000 Active 18 DOM
-
2026-06-10days on market $255,000 Active 16 DOM
-
2026-06-09days on market $255,000 Active 15 DOM
-
2026-06-08days on market $255,000 Active 14 DOM
-
2026-06-07days on market $255,000 Active 13 DOM
-
2026-06-07days on market $255,000 Active 12 DOM
-
2026-06-03days on market $255,000 Active 9 DOM
-
2026-06-02days on market $255,000 Active 8 DOM
-
2026-06-01days on market $255,000 Active 7 DOM
-
2026-05-31days on market $255,000 Active 6 DOM
-
2026-05-26$255,000 Active
ⓘ Source: listings_history table (triggers on properties + properties_extension) + one-shot
backfill from property_details.listing_events for pre-trigger history.
Tax reassessment forecast CT · Partial reset (capped growth)
- Current annual tax
- $2,909 · $242/mo
- Projected year-2 tax
- $4,183 · $349/mo
- Expected delta
- +$1,274/yr (+$106/mo · 43.8%)
ⓘ Screening estimate from a state-policy table — verify with the county assessor before closing.
Nearby sold comps map
Loading sold comps map…
Walkable amenities ~0.75 mi
Loading nearby amenities…
Taxation est. · year 1
- Rental income
- $31,200
- − Mortgage interest
- −$14,284
- − Property taxes
- −$2,909
- − Insurance
- −$1,275
- − Repairs & maintenance
- −$2,496
- − Management
- −$2,496
- − Depreciation
- −$7,418
- Taxable income
- $322
- Est. tax owed @ 24.0%
- −$77
- After-tax cash flow
- $4,340/yr
For passive investors: Depreciation is non-cash, so a rental often shows a tax loss while cash-flowing — sheltering income. Rental losses are passive: they offset passive income freely, and up to $25,000/yr can offset ordinary (W-2) income if you actively participate and your MAGI is under $100k (phasing out to $0 by $150k); unused losses carry forward. On sale, claimed depreciation is recaptured at up to 25%, and gains may owe capital-gains tax (a 1031 exchange can defer both). Figures are a year-1 estimate at your 24.0% rate — not tax advice; consult a CPA.
Schools (NCES district)
- District
- Regional School District 08
- NCES district ID
- 0903750
- Math proficiency
- 54% ▼ -6.00%
- Reading proficiency
- 65% ▼ -6.00%
- Median HH income
- $106,389
- Composite
- 56.01/100
- National rank
- #1190
- State rank
- #34 of 153 in CT
Livability — Andover
No livability data for this city. (Only ~50 U.S. cities are tracked.)
Census & demographics
- Population (ZIP)
- 3,148
Population outlook (Capitol County) Hauer SSP2
- By 2040
- 1,063,519
Race, ethnicity, and origin ACS 2023
- Neighborhood character
- Predominantly White (94%)
- Race & ethnicity
- White 94% Two or more races 3% Asian 2%
- Common ancestry
- Romanian 7% Italian 3% Lithuanian 3%
- Foreign-born
- 5% · Canada
- Languages at home
- 95% English-only · Russian/Polish/Slavic 2% Other Asian/Pacific 1% Other Indo-European 1%
Political lean MEDSL · Capitol
- 2024 margin
- Strong D (+21.9) · D 60.1% · R 38.2% · Other 1.7%
- All cycles
- 2024: D+21.9
Not yet ingested
- Civics
- —
Market trends
- HPI YoY
- ▼ -10.24%
- Current HPI
- 233.0983
- Rent YoY
- —
- Metro
- —
- State GDP YoY
- ▲ 1.06%
- F500 in state
- 38
Industry mix (Fortune 500 HQ in CT)
| Industry | F500 HQs | Revenue |
|---|---|---|
| Industrial Machinery | 4 | $38B |
|
||
| Insurance | 3 | $71B |
|
||
| Financial Services | 2 | $25B |
|
||
| Transportation / Logistics | 2 | $18B |
|
||
| Healthcare | 1 | $247B |
|
||
| Telecommunications | 1 | $55B |
|
||
Price history
1 event — show timeline
- 2026-05-26 Listed $255,000 FSBO.com
Property tax history
-1.0%/yrLatest (2023): $2,909 · -1.9% YoY. Source: county tax records.
Cash-flow waterfall
monthlySold comps — $/sqft
last 12 mo · ≤1 miLoading sold comps…