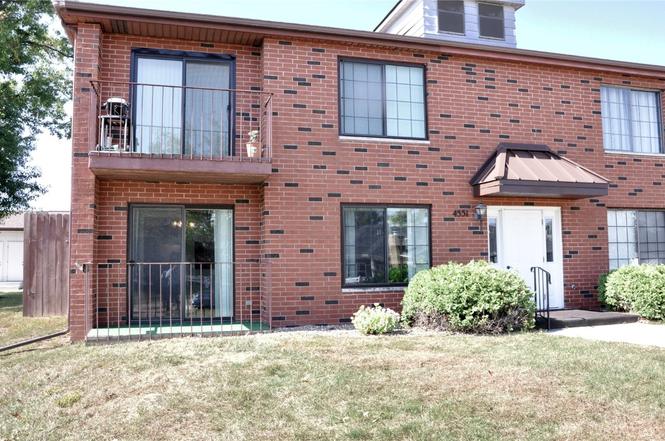
4551 Maureen Dr #33 · Cedar Rapids, IA
Flood risk 1/10 · Minimal
- FEMA flood zone
- X (unshaded)
- Chance of flooding over 30 yrs
- 0.0%
- Est. flood insurance / yr
- $507 – $1,088
Fire risk 4/10 · Minor
- Est. fire insurance / yr
- $902 – $1,676
Heat risk 3/10 · Minor
- Hot days now (above 103°F)
- 7 days/yr
- Hot days in 30 yrs
- 15 days/yr
Wind risk 2/10 · Minimal
- Chance of severe wind over 30 yrs
- —
Air-quality risk 2/10 · Minimal
- Unhealthy air days now
- 1 days/yr
- Unhealthy air days in 30 yrs
- 2 days/yr
Risk factors via First Street. Map © Google.
Why this score? — see what drove the D+ grade
The composite is a weighted blend of 9 inputs, each scored 0–100. Each bar is that input's sub-score; the figure is the points it added to the 100-point composite (weight × sub-score).
- Cash flow +13.7/30.0
- ARV discount +7.5/15.0
- 1% rule +6.5/10.0
- Schools +5.8/10.0
- Rent growth +5.0/5.0
- DSCR +4.1/10.0
- Livability +3.9/5.0
- Condition / age +2.5/5.0
- Appreciation +0.0/10.0
$89,500
🖨 Deal sheet (PDF) 📄 Offer letter ✓ Due diligence
Listing remarks
Wonderful lower-level condo with 2 bedrooms and 2 bathrooms. New kitchen floor 2025’. Spacious living room. Formal dining area. Dishwasher, range, and refrigerator included but are not warranted. The patio is perfect for a grill. 2 large storage closets. Detached garage with more storage. Not all condos offer extra storage but this one does next to front door. You'll appreciate the private garage with opener, both front and rear entrances, low utilities, and there is plenty of parking space behind the building. Easy access to shopping and dining. H. O. A. dues cover lawn maintenance, snow removal, water and garbage. Pets need to be approved by the H. O. A. No rentals. Executive Estate
Key facts
- Patio for grill
- Formal dining area
- New kitchen floor
Tags
Neighborhood map
What this means for you Summary
Snapshot
- This is a 2-bed/2.0-bath condo listed at $90k.
Deal economics
- At list price, monthly cash flow is $6 ($77/yr) — positive.
- The deal already cash-flows at list — no discount required.
- Meets the 1% rule at list price ($1k rent vs $90k).
- Recommended offer: $79k (12.0% below list) — sets the bar for market timing.
- Cap rate 6.4% vs local median 3.5% in Cedar Rapids — top-decile yield for the area; either an underpriced asset or a hidden risk that comps aren't pricing in. Stress-test before assuming the spread holds.
Location & tenants
- Location reads 78/100 on livability (#134 in IA, #2,474 nationally) — a middle-class / working-renter tenant base. Strengths: cost of living A+, housing A+, health & safety A+; Watch: crime C-, commute F.
- Marion Independent School District (suburban): math 68% / reading 70% proficiency, ranked #158 of 289 in IA (top 55%) — acceptable for families but not a draw, mixed tenant base, ~2y average lease.
- Zoned schools: Vernon Middle School (math 66% / reading 65%, grade A-, #153 of 246 statewide, top 62%, 668 students, 40% FRL); Marion High School (math 69% / reading 80%, grade B+, #89 of 336 statewide, top 30%, 722 students, 28% FRL).
- Market conditions: Rents rising fast (+14.7%/yr); 236 active listings in the ZIP; 8 comparable units currently listed for rent nearby; rentals lingering (median 45d on market — plan ~5-8 weeks vacancy on turnover, expect pricing pressure); 50% of comp listings sitting > 30 days — soft ceiling on asking rent; 1,023 units permitted in Linn County in 2024 (456 in 5+ unit buildings).
- This rent is only 16% of the median local income ($75k/yr) — well below the 30% rent-burden line; pricing power to push rent on renewal without tenant pushback.
Forward outlook
- Local home prices are declining (-3.0%/yr); year-one equity from $619 of loan paydown is wiped out by about $3k of value loss. Plan a longer hold.
- Linn County population projected at +16% by 2050 — long-run rental-demand tailwind backs the buy-and-hold thesis.
Negotiation context
- It's been on market 149 days — a 12% lower offer ($79k) is reasonable based on typical stale-listing flexibility.
- 2 sale attempts; this cycle's ask has dropped $9k (9%) from the opening price — seller is motivated, your offer sets the floor, not the list.
Questions for the listing agent
- It's been on market 149 days. Have you received any prior offers? Is the seller open to a 12% concession, seller financing, or rate buy-down credit?
- Built in 1978 — when were the roof, HVAC, electrical panel, plumbing, and water heater last replaced?
- What does the HOA fee cover, when was the last increase, and are there any pending special assessments or reserve-fund shortfalls?
- Any open or pending special assessments — roof, HVAC, plumbing, elevator, façade? What's the per-unit balance and payoff schedule, and is the seller paying it off at close or rolling it to the buyer?
- Why hasn't it sold? Are there any deal-killer items the seller is aware of (foundation, flood, title, zoning, code violations)?
- Is there a deadline driving the sale (1031 exchange, divorce, estate, relocation)? That informs how much negotiation room exists.
- Schools are B-rated — typically a magnet for longer-tenancy family renters. What's the average tenant stay here, and is there a school-zone premium baked into asking?
- The area grade is low — what's the realistic commute time and amenity access for the typical tenant pool here? Any planned neighborhood developments (good or bad) we should know about?
- What's the average days-on-market for RENTAL listings here right now (not sales)? A rising rental-DOM trend means longer vacancies and softer asking-rent achievability than the comps imply.
- What's the recent tenant-quality profile in this submarket — average credit score on applications, eviction rate, late-payment / NSF rate, and stable-employment percentage? A property-management company in the area should have these aggregated.
- How much new apartment / multifamily construction is in the pipeline within 1–3 miles? Heavy new supply (>2% of stock underway) typically softens rents 12–24 months out; light construction supports rent growth.
Investment metrics
- 1% rule
- 1.15% ✓
- Cap rate
- 6.38%
- Cash-on-cash
- 0.31%
- DSCR
- 1.01
- GRM
- 7.3
CMA / ARV
No comps found within radius.
Projected returns pro-forma
-3.0% appreciation · 8.0% rent growth · sell at horizon
- IRR
- -8.7%
- Equity multiple
- 0.66×
- Total profit
- $-8,549
- Equity at exit
- $13,345
- IRR
- 7.5%
- Equity multiple
- 1.73×
- Total profit
- $18,264
- Equity at exit
- $7,738
Cash invested: $25,060 (down + closing). Projections, not guarantees.
Landlord ↔ Tenant lean methodology
- Overall (STATE)
- 83 Strongly Landlord-Friendly
- State Iowa
- 83 Strongly Landlord-Friendly · R+6
- County
- — inherits STATE
- City
- — inherits STATE
ZIP-level market 52403
- Rents YoY
- 14.7%
- Active inventory
- 236
- Price-to-rent
- 7.3×
Monthly cashflow live
- Estimated rent
- $1,025 high interval (Pro) →
- Mortgage (P&I)
- −$469
- Tax est. 1.5%
- −$112 /mo · $1,342/yr
- Insurance
- −$37
- HOA
- −$185
- Vacancy / Maint / Mgmt
- −$215
- Net cashflow
- $6
Break-even live
Sensitivity live
| Price | -10% $68 | -5% $37 | +0% $6 | +5% $-25 | +10% $-55 |
|---|---|---|---|---|---|
| Rent | -10% $-75 | -5% $-34 | +0% $6 | +5% $47 | +10% $87 |
| Rate | -1.0pp $51 | -0.5pp $29 | base $6 | +0.5pp $-17 | +1.0pp $-40 |
UW: 25.0% down · 7.5% · 30yr · 1.5% tax · 5.0% vac · 8.0% maint · 8.0% mgmt
Financing live
Cash to close
- Down payment
- $22,375
- Closing costs
- $2,685
- Reserves months
- —
- Total cash needed
- —
Loan-product check · same deal, 3 products live
Conventional
25% down · 7.5% · 30yr
- Down + closing
- —
- Monthly P&I
- —
- Monthly cashflow
- —
- DSCR
- —
- Eligible?
- —
Personal DTI + credit; lowest rate.
DSCR
20% down · 8.5% · 30yr
- Down + closing
- —
- Monthly P&I
- —
- Monthly cashflow
- —
- DSCR
- —
- Eligible?
- —
No personal income docs; deal must DSCR.
Hard money
10% down · 12.0% · 12mo
- Down + closing
- —
- Monthly P&I
- —
- Monthly cashflow
- —
- DSCR
- —
- Eligible?
- —
Short-term bridge; refi at stabilization.
Rent comps 8 comps
| Address | Beds | Baths | Sqft | Rent | $/sqft | DOM | Units | Dist |
|---|---|---|---|---|---|---|---|---|
| 1020 Twixt Town Rd Marion, IA | 1.0 | 1.0 | 1230 | $825 | $0.67 | 14d | 1 | 0.33mi |
| 127 Southview Dr Marion, IA | 2.0 | 1.0 | 1230 | $950 | $0.77 | 44d | 1 | 0.37mi |
| 345 Marion Blvd Marion, IA | 2.0 | 1.0–2.0 | 680 | $2,600 | $3.82 | 14d | 1 | 0.42mi |
| 4341 1st Ave SE Cedar Rapids, IA | 2.0 | 1.0 | 610 | $1,000 | $1.64 | 44d | 1 | 0.57mi |
| 400 Lindale Dr Marion, IA | 3.0 | 2.0 | 942 | $1,092 | $1.16 | 14d | 1 | 0.60mi |
| 253 38th Street Dr SE Cedar Rapids, IA | 2.0 | 1.0 | 757 | $799 | $1.06 | 44d | 1 | 0.86mi |
| 1501 Grand Ave Marion, IA | 2.0 | 1.0 | 800 | $868 | $1.08 | 44d | 1 | 1.29mi |
| 306 29th Street Dr SE Cedar Rapids, IA | 2.0 | 1.0 | 1100 | $850 | $0.77 | 22d | 1 | 1.40mi |
HOA detail condo
- Monthly dues
- $185 · $2,220/yr
- Likely covers
- watertrashsnow removal
- Assessments
- None detected in remarks — confirm with the listing agent.
Listing history 6 events
-
2026-03-17status Pending
-
2026-02-21status Active
-
2026-02-06status Pending
-
2025-11-21price $89,500
-
2025-10-16price $95,000
-
2025-10-04$98,500 Active
ⓘ Source: listings_history table (triggers on properties + properties_extension) + one-shot
backfill from property_details.listing_events for pre-trigger history.
Climate risk First Street
- Flood 1/10 Low FEMA zone X (unshaded) · 0% chance over 30 yrs
- Wildfire 4/10 Moderate
- Heat 3/10 Moderate 7 d/yr ≥103°F today · 15 d/yr by 30 yrs out
- Wind 2/10 Low
- Air quality 2/10 Low 1 unhealthy d/yr today · 2 by 30 yrs out
Nearby sold comps map
Loading sold comps map…
Walkable amenities ~0.75 mi
Loading nearby amenities…
Taxation est. · year 1
- Rental income
- $12,302
- − Mortgage interest
- −$5,013
- − Property taxes
- −$1,342
- − Insurance
- −$448
- − Repairs & maintenance
- −$984
- − Management
- −$984
- − HOA
- −$2,220
- − Depreciation
- −$2,604
- Taxable loss
- −$1,293
- Est. tax savings @ 24.0%
- +$310
- After-tax cash flow
- $387/yr
For passive investors: Depreciation is non-cash, so a rental often shows a tax loss while cash-flowing — sheltering income. Rental losses are passive: they offset passive income freely, and up to $25,000/yr can offset ordinary (W-2) income if you actively participate and your MAGI is under $100k (phasing out to $0 by $150k); unused losses carry forward. On sale, claimed depreciation is recaptured at up to 25%, and gains may owe capital-gains tax (a 1031 exchange can defer both). Figures are a year-1 estimate at your 24.0% rate — not tax advice; consult a CPA.
Schools (NCES district)
- District
- Marion Independent School District
- NCES district ID
- 1918690
- Math proficiency
- 68% ▼ -6.00%
- Reading proficiency
- 70% ▲ 2.00%
- Median HH income
- $49,541
- Composite
- 58.49/100
- National rank
- #997
- State rank
- #158 of 289 in IA
Livability — Cedar Rapids
- Score
- 78/100
- State rank
- #134
- US rank
- #2474
Category grades
Schools grade is shown separately in the Schools card above.
Census & demographics
- Census place
- Cedar Rapids, IA
- County
- Linn County · 179,860 people
- City population
- 137,154
- Metro
- Cedar Rapids, IA
- Population (ZIP)
- 22,551
- Household income
- $74,703
- Rent vs Own
- Severe rent burden
- 452.0
Population outlook (Linn County) Hauer SSP2
- Today (2025)
- 239,589 people
- By 2030
- 248,587 · +3.8%
- By 2040
- 264,817 · +10.5%
- By 2050
- 278,685 · +16.3%
- By 2075
- 311,754 · +30.1%
- By 2100
- 336,773 · +40.6%
Race, ethnicity, and origin ACS 2023
- Neighborhood character
- Predominantly White (85%)
- Race & ethnicity
- White 85% Black 7% Two or more races 5% Hispanic / Latino 3%
- Common ancestry
- Italian 3% Slovak 3% Portuguese 3%
- Foreign-born
- 3% · Canada
- Languages at home
- 95% English-only · Spanish 3% Other Indo-European 1%
Political lean MEDSL · Linn
- 2024 margin
- Lean D (+9.9) · D 54.2% · R 44.3% · Other 1.4%
- 2008→2024 swing
- -11.6pp toward R · 2008: 21.5pp · 2024: 9.9pp
- All cycles
- 2024: D+9.9 2020: D+13.7 2016: D+9.0 2012: D+17.6 2008: D+21.5
Not yet ingested
- Civics
- —
Market trends
- HPI YoY
- ▼ -170.15%
- Current HPI
- 196.1114
- Rent YoY
- ▲ 14.67%
- Metro
- Cedar Rapids, IA
- State GDP YoY
- ▲ 2.48%
- F500 in state
- 4
Industry mix (Fortune 500 HQ in IA)
| Industry | F500 HQs | Revenue |
|---|---|---|
| Financial Services | 1 | $16B |
|
||
| Retail / Convenience | 1 | $15B |
|
||
Price history
-9.1% since first listed6 events — show timeline
- 2026-03-17 Pending — CRAAR, CDRMLS
- 2026-02-21 Relisted — CRAAR, CDRMLS
- 2026-02-06 Pending — CRAAR, CDRMLS
- 2025-11-21 Price Changed $89,500 CRAAR, CDRMLS
- 2025-10-16 Price Changed $95,000 CRAAR, CDRMLS
- 2025-10-04 Listed $98,500 CRAAR, CDRMLS
Cash-flow waterfall
monthlySold comps — $/sqft
last 12 mo · ≤1 miLoading sold comps…