 Multi-family
3089 Little Rock Rd · Rose Bud, AR
Flood risk 1/10 · Minimal
- FEMA flood zone
- X (unshaded)
- Chance of flooding over 30 yrs
- 0.0%
- Est. flood insurance / yr
- $507 – $1,088
Fire risk 5/10 · Moderate
- Est. fire insurance / yr
- $1,499 – $2,785
Heat risk 5/10 · Moderate
- Hot days now (above 107°F)
- 7 days/yr
- Hot days in 30 yrs
- 19 days/yr
Wind risk 3/10 · Minor
- Chance of severe wind over 30 yrs
- 6.0%
Air-quality risk 2/10 · Minimal
- Unhealthy air days now
- 0 days/yr
- Unhealthy air days in 30 yrs
- 1 days/yr
Risk factors via First Street. Map © Google.
Why this score? — see what drove the B+ grade
The composite is a weighted blend of 9 inputs, each scored 0–100. Each bar is that input's sub-score; the figure is the points it added to the 100-point composite (weight × sub-score).
- Cash flow +30.0/30.0
- 1% rule +10.0/10.0
- DSCR +10.0/10.0
- Appreciation +8.0/10.0
- ARV discount +7.5/15.0
- Livability +3.1/5.0
- Schools +2.9/10.0
- Rent growth +2.5/5.0
- Condition / age +2.2/5.0
$299,000
🖨 Deal sheet (PDF) 📄 Offer letter ✓ Due diligence
Multi-family units
County records classify this as Multi-Family (5+ Unit). Listing-text estimate: 1 unit. estimate disagrees with records
5+ unit building — per-unit beds/baths from public records are typically unavailable; the breakdown below (if shown) is an estimate from the listing text.
Listing remarks MLS
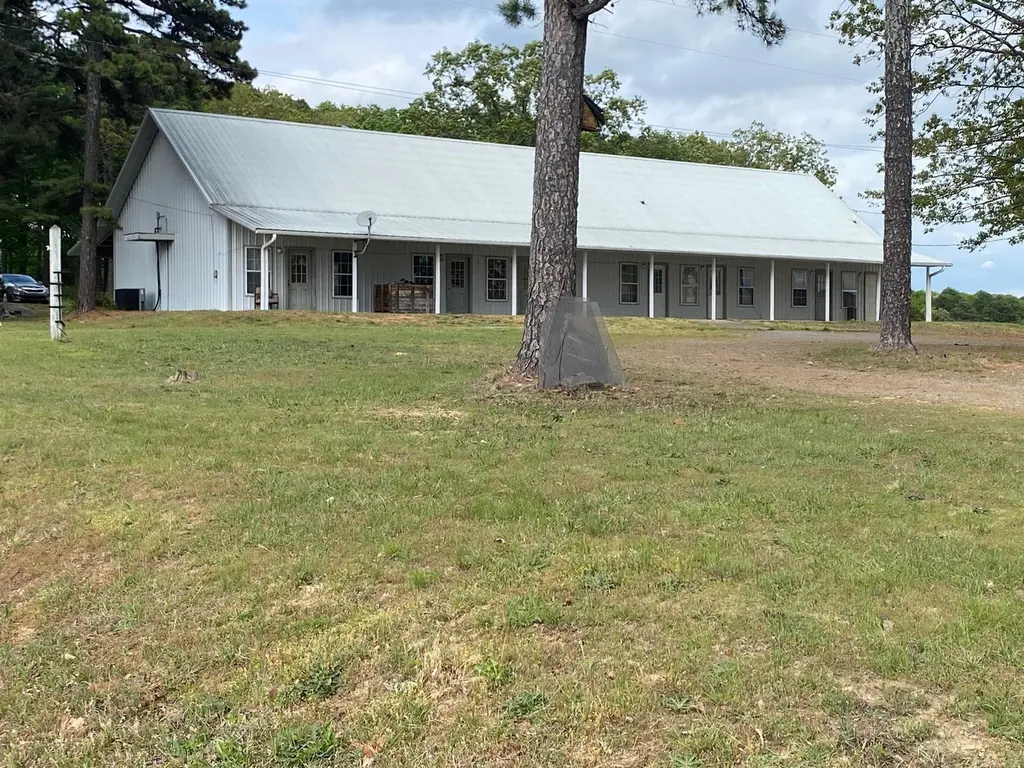
This building is approx. 3000 sq. ft with 5 units currently rented and another 3 spaces currently being used by the owner. This is designed to be 12 one bedroom units with shared bathrooms. The property does have room and electrical for additional RV hookups desired. The Warehouse next to it is also listed see MLS 498887. This is highway frontage property and has endless potential and possibilities! Don't miss out; call today!
Key facts
- 1.7 acre lot
- 4 parking spots
- Built 1997
Neighborhood map
What this means for you Summary
Snapshot
- This is a 11-bed/?-bath multifamily listed at $299k. Condition is rated fair.
Deal economics
- At list price, monthly cash flow is $3k ($33k/yr) — positive.
- The deal already cash-flows at list — no discount required.
- Meets the 1% rule at list price ($6k rent vs $299k).
- Recommended offer: $281k (6.0% below list) — sets the bar for market timing.
Location & tenants
- Location reads 61/100 on livability (#252 in AR) — a middle-class / working-renter tenant base. Strengths: cost of living A+, housing A; Watch: crime D+, schools D, amenities F.
- Rose Bud School District (rural): math 33% / reading 35% proficiency, ranked #121 of 238 in AR (top 51%) — families likely to look elsewhere, expect single-tenant / working-renter base with shorter leases.
- Market conditions: 20 active listings in the ZIP; 13 units permitted in Cleburne County in 2024 (0 in 5+ unit buildings).
Forward outlook
- In year one you build about $20k of equity ($2k loan paydown + $18k appreciation (6.1% local appreciation)).
- Cleburne County population projected at -18% by 2050 — secular population decline; favor cash flow + early exit over multi-decade hold.
- At projected returns (6.1% appreciation + 3.0% rent growth), your $84k cash investment doubles in ~2 years — after that, you're playing with house money.
- By year 2, paydown + projected appreciation supports a ~$32k cash-out refi (75% LTV) — recoverable capital for the next deal without selling this one.
Negotiation context
- It's been on market 62 days — a 6% lower offer ($281k) is reasonable based on typical stale-listing flexibility.
Risks & watch-outs
- Climate carrying-cost: moderate wildfire risk; extreme-heat days projected 7→19/yr by 2055 (HVAC capex compounding) — expect insurance premiums to compound above CPI over the hold.
Questions for the listing agent
- It's been on market 62 days. Have you received any prior offers? Is the seller open to a 6% concession, seller financing, or rate buy-down credit?
- Have any recent inspections been done? Can we get a copy of the seller's disclosures and any deferred-maintenance estimates?
- Why hasn't it sold? Are there any deal-killer items the seller is aware of (foundation, flood, title, zoning, code violations)?
- Is there a deadline driving the sale (1031 exchange, divorce, estate, relocation)? That informs how much negotiation room exists.
- Schools are D-rated, which usually means shorter tenancies and higher turnover. Who's the typical renter profile here, and what's been the actual vacancy rate?
- Crime grade is D in this area — have there been break-ins, vandalism, or insurance claims at this property in the last 3 years? What carrier currently insures it and at what premium?
- What's the average days-on-market for RENTAL listings here right now (not sales)? A rising rental-DOM trend means longer vacancies and softer asking-rent achievability than the comps imply.
- What's the recent tenant-quality profile in this submarket — average credit score on applications, eviction rate, late-payment / NSF rate, and stable-employment percentage? A property-management company in the area should have these aggregated.
- How much new apartment / multifamily construction is in the pipeline within 1–3 miles? Heavy new supply (>2% of stock underway) typically softens rents 12–24 months out; light construction supports rent growth.
Investment metrics
- 1% rule
- 2.04% ✓
- Cap rate
- 17.32%
- Cash-on-cash
- 39.40%
- DSCR
- 2.75
- GRM
- 4.1
CMA / ARV
No comps found within radius.
Projected returns pro-forma
6.08% appreciation · 3.0% rent growth · sell at horizon
- IRR
- 49.3%
- Equity multiple
- 4.14×
- Total profit
- $262,852
- Equity at exit
- $189,415
- IRR
- 46.2%
- Equity multiple
- 8.60×
- Total profit
- $635,905
- Equity at exit
- $344,754
Cash invested: $83,720 (down + closing). Projections, not guarantees.
Landlord ↔ Tenant lean methodology
- Overall (STATE)
- 92 Strongly Landlord-Friendly
- State Arkansas
- 92 Strongly Landlord-Friendly · R+14
- County
- — inherits STATE
- City
- — inherits STATE
ZIP-level market 72137
- Home prices YoY
- 2.4%
- Active inventory
- 20
- Price-to-rent
- 32.7×
Monthly cashflow live
- Estimated rent
- $6,095 medium interval (Pro) →
- Mortgage (P&I)
- −$1,568
- Tax est. 1.5%
- −$374 /mo · $4,485/yr
- Insurance
- −$125
- HOA
- −$0
- Vacancy / Maint / Mgmt
- −$1,280
- Net cashflow
- $2,749
Break-even live
Sensitivity live
| Price | -10% $2,955 | -5% $2,852 | +0% $2,749 | +5% $2,645 | +10% $2,542 |
|---|---|---|---|---|---|
| Rent | -10% $2,267 | -5% $2,508 | +0% $2,749 | +5% $2,989 | +10% $3,230 |
| Rate | -1.0pp $2,899 | -0.5pp $2,825 | base $2,749 | +0.5pp $2,671 | +1.0pp $2,592 |
8-unit breakdown (identical units grouped — click to expand)
| Units | Beds | Baths | Est. rent |
|---|---|---|---|
| 8× units | 1 | 1 | $6,096 |
| #1 | 1 | 1 | $762 |
| #2 | 1 | 1 | $762 |
| #3 | 1 | 1 | $762 |
| #4 | 1 | 1 | $762 |
| #5 | 1 | 1 | $762 |
| #6 | 1 | 1 | $762 |
| #7 | 1 | 1 | $762 |
| #8 | 1 | 1 | $762 |
| Total (8 units) | $6,095 | ||
UW: 25.0% down · 7.5% · 30yr · 1.5% tax · 5.0% vac · 8.0% maint · 8.0% mgmt
Financing live
Cash to close
- Down payment
- $74,750
- Closing costs
- $8,970
- Reserves months
- —
- Total cash needed
- —
Loan-product check · same deal, 3 products live
Conventional
25% down · 7.5% · 30yr
- Down + closing
- —
- Monthly P&I
- —
- Monthly cashflow
- —
- DSCR
- —
- Eligible?
- —
Personal DTI + credit; lowest rate.
DSCR
20% down · 8.5% · 30yr
- Down + closing
- —
- Monthly P&I
- —
- Monthly cashflow
- —
- DSCR
- —
- Eligible?
- —
No personal income docs; deal must DSCR.
Hard money
10% down · 12.0% · 12mo
- Down + closing
- —
- Monthly P&I
- —
- Monthly cashflow
- —
- DSCR
- —
- Eligible?
- —
Short-term bridge; refi at stabilization.
Listing history 18 events
-
2026-06-21days on market $299,000 Active 62 DOM
-
2026-06-19days on market $299,000 Active 60 DOM
-
2026-06-18days on market $299,000 Active 59 DOM
-
2026-06-17days on market $299,000 Active 58 DOM
-
2026-06-16days on market $299,000 Active 57 DOM
-
2026-06-15days on market $299,000 Active 56 DOM
-
2026-06-14days on market $299,000 Active 54 DOM
-
2026-06-12days on market $299,000 Active 53 DOM
-
2026-06-09days on market $299,000 Active 50 DOM
-
2026-06-08days on market $299,000 Active 49 DOM
-
2026-06-07days on market $299,000 Active 48 DOM
-
2026-06-05days on market $299,000 Active 45 DOM
-
2026-06-03days on market $299,000 Active 44 DOM
-
2026-06-02days on market $299,000 Active 43 DOM
-
2026-06-01days on market $299,000 Active 42 DOM
-
2026-05-31days on market $299,000 Active 41 DOM
-
2026-05-30days on market $299,000 Active 40 DOM
-
2026-04-20$299,000 New Listing 430-char remark
Show marketing remark (430 chars)
This building is approx. 3000 sq. ft with 5 units currently rented and another 3 spaces currently being used by the owner. This is designed to be 12 one bedroom units with shared bathrooms. The property does have room and electrical for additional RV hookups desired. The Warehouse next to it is also listed see MLS 498887. This is highway frontage property and has endless potential and possibilities! Don't miss out; call today!
ⓘ Source: listings_history table (triggers on properties + properties_extension) + one-shot
backfill from property_details.listing_events for pre-trigger history.
Climate risk First Street
- Flood 1/10 Low FEMA zone X (unshaded) · 0% chance over 30 yrs
- Wildfire 5/10 Major
- Heat 5/10 Major 7 d/yr ≥107°F today · 19 d/yr by 30 yrs out
- Wind 3/10 Moderate 6% chance of damaging wind over 30 yrs
- Air quality 2/10 Low 0 unhealthy d/yr today · 1 by 30 yrs out
Nearby sold comps map
Loading sold comps map…
Walkable amenities ~0.75 mi
Loading nearby amenities…
Taxation est. · year 1
- Rental income
- $73,140
- − Mortgage interest
- −$16,749
- − Property taxes
- −$4,485
- − Insurance
- −$1,495
- − Repairs & maintenance
- −$5,851
- − Management
- −$5,851
- − Depreciation
- −$8,698
- Taxable income
- $30,011
- Est. tax owed @ 24.0%
- −$7,203
- After-tax cash flow
- $25,782/yr
For passive investors: Depreciation is non-cash, so a rental often shows a tax loss while cash-flowing — sheltering income. Rental losses are passive: they offset passive income freely, and up to $25,000/yr can offset ordinary (W-2) income if you actively participate and your MAGI is under $100k (phasing out to $0 by $150k); unused losses carry forward. On sale, claimed depreciation is recaptured at up to 25%, and gains may owe capital-gains tax (a 1031 exchange can defer both). Figures are a year-1 estimate at your 24.0% rate — not tax advice; consult a CPA.
Condition & rehab AI · 13 photos
This multi-family property has fair condition with cosmetic repairs needed. Painting the exterior and improving landscaping would significantly enhance its value.
Repairs flagged
- Minor Siding — Weathered appearance
- Minor Landscaping — Sparse and uneven
Value-add opportunities
- Both Paint exterior — Enhances curb appeal and resale value
- Both Landscaping — Improves curb appeal and rental value
Renovation cost estimate screening
| Repair item | Severity | Est. cost |
|---|---|---|
| Siding · Weathered appearance | Minor | $500–3,000 |
| Landscaping · Sparse and uneven | Minor | $500–3,000 |
| Total estimated repair cost · 2 items | $1,000–6,000 |
Value-add ROI direction
- Both Paint exterior — Enhances curb appeal and resale value ↑
- Both Landscaping — Improves curb appeal and rental value ↑
ⓘ Cost ranges are severity-bucket heuristics (US national rule-of-thumb). Get contractor quotes + a written scope before underwriting a rehab budget.
Schools (NCES district)
- District
- Rose Bud School District
- NCES district ID
- 0512000
- Math proficiency
- 33% ▼ -12.00%
- Reading proficiency
- 35% ▼ -11.00%
- Median HH income
- $45,264
- Composite
- 29.07/100
- National rank
- #6600
- State rank
- #121 of 238 in AR
Livability — Rose Bud
- Score
- 61/100
- State rank
- #252
- US rank
- #18154
Category grades
Schools grade is shown separately in the Schools card above.
Census & demographics
- Population (ZIP)
- 2,151
Population outlook (Cleburne County) Hauer SSP2
- Today (2025)
- 24,198 people
- By 2030
- 23,324 · -3.6%
- By 2040
- 21,566 · -10.9%
- By 2050
- 19,916 · -17.7%
- By 2075
- 16,744 · -30.8%
- By 2100
- 13,303 · -45.0%
Race, ethnicity, and origin ACS 2023
- Neighborhood character
- Predominantly White (89%)
- Race & ethnicity
- White 89% Hispanic / Latino 7% Two or more races 4%
- Hispanic origin (detail)
- Mexican 7%
- Common ancestry
- Italian 2% Slovak 1% Romanian 1%
- Foreign-born
- 4% · Canada
- Languages at home
- 92% English-only · Spanish 8%
Political lean MEDSL · Cleburne
- 2024 margin
- Solid R (+67.9) · D 15.2% · R 83.2% · Other 1.6%
- 2008→2024 swing
- -23.7pp toward R · 2008: -44.2pp · 2024: -67.9pp
- All cycles
- 2024: R+67.9 2020: R+65.8 2016: R+61.4 2012: R+52.2 2008: R+44.2
Not yet ingested
- Civics
- —
Market trends
- HPI YoY
- ▲ 6.08%
- Current HPI
- 260.507
- Rent YoY
- —
- Metro
- —
- State GDP YoY
- ▲ 3.80%
- F500 in state
- 10
Industry mix (Fortune 500 HQ in AR)
| Industry | F500 HQs | Revenue |
|---|---|---|
| Retail | 1 | $681B |
|
||
| Food / Agriculture | 1 | $53B |
|
||
| Retail / Energy | 1 | $22B |
|
||
| Transportation / Logistics | 1 | $12B |
|
||
| Energy | 1 | $4B |
|
||
Price history
1 event — show timeline
- 2026-04-20 Listed $299,000 CARMLS
Cash-flow waterfall
monthlySold comps — $/sqft
last 12 mo · ≤1 miLoading sold comps…