 Duplex
224 NE 111th St · Miami Shores, FL
Flood risk 3/10 · Minor
- FEMA flood zone
- X (unshaded)
- Chance of flooding over 30 yrs
- 0.12%
- Est. flood insurance / yr
- $507 – $1,088
Fire risk 1/10 · Minimal
- Est. fire insurance / yr
- $947 – $1,759
Heat risk 10/10 · Severe
- Hot days now (above 104°F)
- 6 days/yr
- Hot days in 30 yrs
- 24 days/yr
Wind risk 10/10 · Severe
- Chance of severe wind over 30 yrs
- 99.0%
Air-quality risk 2/10 · Minimal
- Unhealthy air days now
- 1 days/yr
- Unhealthy air days in 30 yrs
- 2 days/yr
Risk factors via First Street. Map © Google.
Why this score? — see what drove the C+ grade
The composite is a weighted blend of 9 inputs, each scored 0–100. Each bar is that input's sub-score; the figure is the points it added to the 100-point composite (weight × sub-score).
- Cash flow +26.5/30.0
- DSCR +9.1/10.0
- ARV discount +7.5/15.0
- 1% rule +6.7/10.0
- Schools +4.2/10.0
- Livability +4.0/5.0
- Condition / age +2.5/5.0
- Rent growth +2.3/5.0
- Appreciation +0.0/10.0
$675,000
🖨 Deal sheet (PDF) 📄 Offer letter ✓ Due diligence
Multi-family units
County records classify this as Multi-Family (2-4 Unit). Listing-text estimate: 2 units. confirmed
Listing remarks
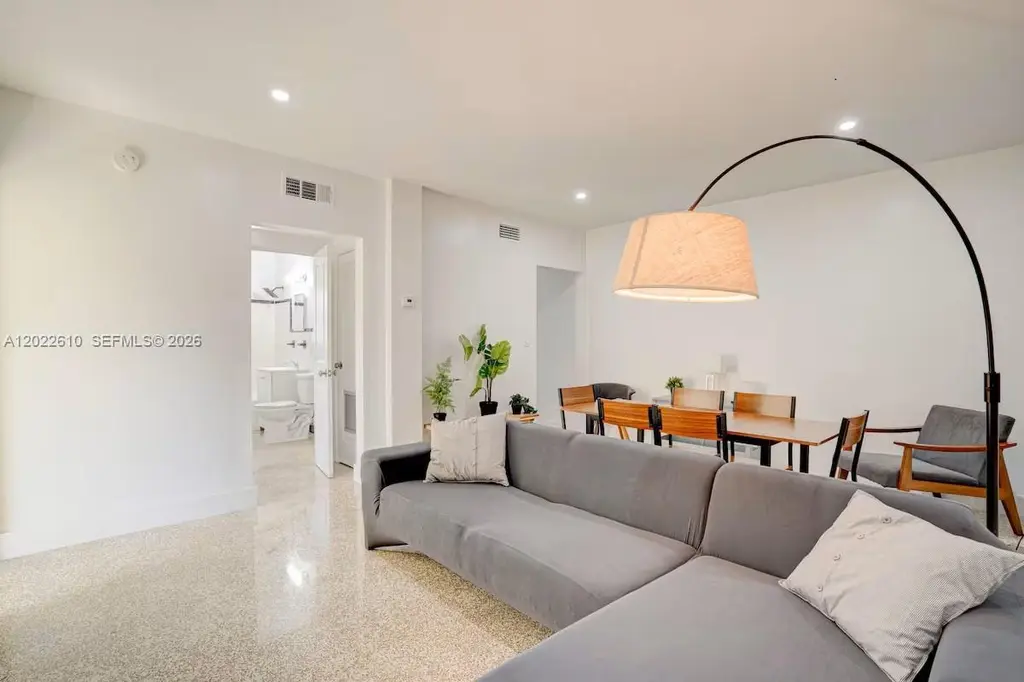
Fully furnished and fully renovated duplex featuring two 3BD/1BA units with polished terrazzo floors throughout. Currently used as a high-performing Airbnb and excellent income potential. Both units share a washer/dryer located at the back of the property. Major upgrades completed in 2025 include new roof, electrical, plumbing, appliances, and two new A/C systems. Located directly across from Barry University, ideal for student housing, short-term, or long-term rentals. A perfect turnkey investment or owner-occupant opportunity!
Key facts
- Fully renovated
- New plumbing
- New electrical
Tags
Property features AI
Finance
- Financial info: Total annual rent: $84,234; Operating expenses: $64,072; One unit reported actual rent of $3,979 (month-to-month); Rent includes electricity for rental units
Exterior
- Parking: Total of 4 parking spaces
- Utilities: Cable available; Septic tank
- Home design: Multifamily property (4 units)
- Construction: Block construction; Shingle roof; Resale property
- Exterior features: Less than quarter-acre lot; On-street parking available
Interior
- Bedrooms: Four 3-bedroom units
- Flooring: Terrazzo
- Bathrooms: Each unit has 1 full bathroom
- Heating & cooling: Central heating; Central air conditioning
- Interior features: Terrazzo flooring; Updated/Remodeled condition
Neighborhood map
What this means for you Summary
Snapshot
- This is a 2 × 3-bed/1.0-bath units multifamily listed at $675k.
Deal economics
- At list price, monthly cash flow is $2k ($22k/yr) — positive. Per door: $897/mo.
- The deal already cash-flows at list — no discount required.
- Meets the 1% rule at list price ($8k rent vs $675k).
- Recommended offer: $665k (1.5% below list) — sets the bar for market timing.
Location & tenants
- Location reads 80/100 on livability (#130 in FL, #1,936 nationally) — a professional / high-income tenant draw. Strengths: commute A+, employment A+, housing A+; Watch: crime D, amenities F, cost of living F.
- Miami-Dade (suburban): math 45% / reading 54% proficiency, ranked #40 of 73 in FL (top 55%) — families likely to look elsewhere, expect single-tenant / working-renter base with shorter leases; 64% free/reduced lunch — lower-income household profile, screen leases tightly.
- Zoned schools: Hubert O. Sibley K-8 Academy (math 17% / reading 30%, grade F, #2,061 of 2,144 statewide, top 96%, 660 students, 73% FRL); Horace Mann Middle School (math 23% / reading 31%, grade F, #497 of 571 statewide, top 88%, 528 students, 76% FRL); Miami Edison Senior High School (math 19% / reading 15%, grade F, #597 of 667 statewide, top 90%, 623 students, 72% FRL).
- Zoned-school proficiency averages 22% at this address vs 50% district-wide (-27 pts) — the specific schools serving this property underperform the Miami-Dade average; the district grade overstates school quality for this exact location.
- Market conditions: Rents soft (-0.7%/yr); 340 active listings in the ZIP; 10,051 units permitted in Miami-Dade County in 2024 (7,758 in 5+ unit buildings).
- At $7,865/mo this rent would consume 162% of the median local household income ($58k/yr) (locally 3226% of renters already pay >50% of income on rent) — very limited rent-growth headroom before tenants either downsize or default.
Forward outlook
- Local home prices are declining (-3.0%/yr); year-one equity from $5k of loan paydown is wiped out by about $20k of value loss. Plan a longer hold.
- Miami-Dade County population projected at +28% by 2050 — long-run rental-demand tailwind backs the buy-and-hold thesis.
Negotiation context
- It's been on market 18 days — a 2% lower offer ($665k) is reasonable based on typical stale-listing flexibility.
- 4 sale attempts since 6y ago with the ask held roughly flat each time — persistent listings suggest the price (not the market) is what's stuck; bring a comps-based counter.
- Current owner paid $92k; list at $675k implies a 630% gain — meaningful room to come down on a strong offer.
Risks & watch-outs
- Watch-outs: built in 1947 — expect roof / HVAC / electrical / plumbing capex.
- Climate carrying-cost: severe wind risk, 99% chance of damaging wind over 30y; extreme-heat days projected 6→24/yr by 2055 (HVAC capex compounding) — expect insurance premiums to compound above CPI over the hold.
Questions for the listing agent
- Can we see the unit-by-unit rent roll, current vacancy, and any below-market leases? What's the average tenancy length?
- What capital expenditures (roof, boiler, parking lot, exteriors) have been made in the last 5 years, and what's planned in the next 2?
- Built in 1947 — when were the roof, HVAC, electrical panel, plumbing, and water heater last replaced?
- Is there a deadline driving the sale (1031 exchange, divorce, estate, relocation)? That informs how much negotiation room exists.
- Schools are A-rated — typically a magnet for longer-tenancy family renters. What's the average tenant stay here, and is there a school-zone premium baked into asking?
- Crime grade is D in this area — have there been break-ins, vandalism, or insurance claims at this property in the last 3 years? What carrier currently insures it and at what premium?
- What's the average days-on-market for RENTAL listings here right now (not sales)? A rising rental-DOM trend means longer vacancies and softer asking-rent achievability than the comps imply.
- What's the recent tenant-quality profile in this submarket — average credit score on applications, eviction rate, late-payment / NSF rate, and stable-employment percentage? A property-management company in the area should have these aggregated.
- How much new apartment / multifamily construction is in the pipeline within 1–3 miles? Heavy new supply (>2% of stock underway) typically softens rents 12–24 months out; light construction supports rent growth.
Investment metrics
- 1% rule
- 1.17% ✓
- Cap rate
- 9.48%
- Cash-on-cash
- 11.39%
- DSCR
- 1.51
- GRM
- 7.2
CMA / ARV
No comps found within radius.
Projected returns pro-forma
-3.0% appreciation · 0.0% rent growth · sell at horizon
- IRR
- -2.6%
- Equity multiple
- 0.90×
- Total profit
- $-18,191
- Equity at exit
- $100,645
- IRR
- 3.5%
- Equity multiple
- 1.22×
- Total profit
- $42,093
- Equity at exit
- $58,362
Cash invested: $189,000 (down + closing). Projections, not guarantees.
Landlord ↔ Tenant lean methodology
- Overall (STATE)
- 87 Strongly Landlord-Friendly
- State Florida
- 87 Strongly Landlord-Friendly · R+3
- County
- — inherits STATE
- City
- — inherits STATE
ZIP-level market 33161
- Rents YoY
- -0.7%
- Active inventory
- 340
- Price-to-rent
- 14.3×
Monthly cashflow live
- Estimated rent
- $7,865 medium interval (Pro) →
- Mortgage (P&I)
- −$3,540
- Tax from tax record
- −$598 /mo · $7,178/yr
- Insurance
- −$281
- HOA
- −$0
- Vacancy / Maint / Mgmt
- −$1,652
- Net cashflow
- $1,794
Break-even live
Sensitivity live
| Price | -10% $2,176 | -5% $1,985 | +0% $1,794 | +5% $1,603 | +10% $1,412 |
|---|---|---|---|---|---|
| Rent | -10% $1,173 | -5% $1,483 | +0% $1,794 | +5% $2,105 | +10% $2,415 |
| Rate | -1.0pp $2,134 | -0.5pp $1,966 | base $1,794 | +0.5pp $1,619 | +1.0pp $1,441 |
2-unit breakdown (identical units grouped — click to expand)
| Units | Beds | Baths | Est. rent |
|---|---|---|---|
| 2× units | 3 | 1 | $7,864 |
| #1 | 3 | 1 | $3,932 |
| #2 | 3 | 1 | $3,932 |
| Total (2 units) | $7,865 | ||
UW: 25.0% down · 7.5% · 30yr · 1.5% tax · 5.0% vac · 8.0% maint · 8.0% mgmt
Financing live
Cash to close
- Down payment
- $168,750
- Closing costs
- $20,250
- Reserves months
- —
- Total cash needed
- —
Loan-product check · same deal, 3 products live
Conventional
25% down · 7.5% · 30yr
- Down + closing
- —
- Monthly P&I
- —
- Monthly cashflow
- —
- DSCR
- —
- Eligible?
- —
Personal DTI + credit; lowest rate.
DSCR
20% down · 8.5% · 30yr
- Down + closing
- —
- Monthly P&I
- —
- Monthly cashflow
- —
- DSCR
- —
- Eligible?
- —
No personal income docs; deal must DSCR.
Hard money
10% down · 12.0% · 12mo
- Down + closing
- —
- Monthly P&I
- —
- Monthly cashflow
- —
- DSCR
- —
- Eligible?
- —
Short-term bridge; refi at stabilization.
Listing history 11 events
-
2026-06-21days on market $675,000 Active 18 DOM
-
2026-06-18days on market $675,000 Active 15 DOM
-
2026-06-17days on market $675,000 Active 14 DOM
-
2026-06-16days on market $675,000 Active 13 DOM
-
2026-06-15days on market $675,000 Active 12 DOM
-
2026-06-13days on market $675,000 Active 10 DOM
-
2026-06-09days on market $675,000 Active 6 DOM
-
2026-06-08days on market $675,000 Active 5 DOM
-
2026-06-07days on market $675,000 Active 4 DOM
-
2026-06-04remarks 534-char remark
-
2026-06-04$675,000 Active 1 DOM
ⓘ Source: listings_history table (triggers on properties + properties_extension) + one-shot
backfill from property_details.listing_events for pre-trigger history.
Tax reassessment forecast FL · Resets to sale price
- Current annual tax
- $7,178 · $598/mo
- Projected year-2 tax
- $7,178 · $598/mo
- Expected delta
- $0/yr ($0/mo · -0.0%)
ⓘ Screening estimate from a state-policy table — verify with the county assessor before closing.
Climate risk First Street
- Flood 3/10 Moderate FEMA zone X (unshaded) · 12% chance over 30 yrs
- Wildfire 1/10 Low
- Heat 10/10 Extreme 6 d/yr ≥104°F today · 24 d/yr by 30 yrs out
- Wind 10/10 Extreme 99% chance of damaging wind over 30 yrs
- Air quality 2/10 Low 1 unhealthy d/yr today · 2 by 30 yrs out
Nearby sold comps map
Loading sold comps map…
Walkable amenities ~0.75 mi
Loading nearby amenities…
Taxation est. · year 1
- Rental income
- $94,380
- − Mortgage interest
- −$37,810
- − Property taxes
- −$7,178
- − Insurance
- −$3,375
- − Repairs & maintenance
- −$7,550
- − Management
- −$7,550
- − Depreciation
- −$19,636
- Taxable income
- $11,279
- Est. tax owed @ 24.0%
- −$2,707
- After-tax cash flow
- $18,823/yr
For passive investors: Depreciation is non-cash, so a rental often shows a tax loss while cash-flowing — sheltering income. Rental losses are passive: they offset passive income freely, and up to $25,000/yr can offset ordinary (W-2) income if you actively participate and your MAGI is under $100k (phasing out to $0 by $150k); unused losses carry forward. On sale, claimed depreciation is recaptured at up to 25%, and gains may owe capital-gains tax (a 1031 exchange can defer both). Figures are a year-1 estimate at your 24.0% rate — not tax advice; consult a CPA.
Schools (NCES district)
- District
- Miami-Dade
- NCES district ID
- 1200390
- Math proficiency
- 45% ▼ -16.00%
- Reading proficiency
- 54% ▼ -5.00%
- Median HH income
- $43,928
- Composite
- 41.76/100
- National rank
- #3397
- State rank
- #40 of 73 in FL
Livability — Miami Shores
- Score
- 80/100
- State rank
- #130
- US rank
- #1936
Category grades
Schools grade is shown separately in the Schools card above.
Census & demographics
- County
- Miami-Dade County · 2,697,751 people
- City population
- 99,437
- Metro
- Miami-Fort Lauderdale-Pompano Beach, FL
- Population (ZIP)
- 54,814
- Household income
- $58,325
- Rent vs Own
- Severe rent burden
- 3226.0
Population outlook (Miami-Dade County) Hauer SSP2
- Today (2025)
- 3,126,439 people
- By 2030
- 3,325,765 · +6.4%
- By 2040
- 3,697,561 · +18.3%
- By 2050
- 4,012,134 · +28.3%
- By 2075
- 4,605,612 · +47.3%
- By 2100
- 4,866,598 · +55.7%
Race, ethnicity, and origin ACS 2023
- Neighborhood character
- Diverse neighborhood (Simpson 0.58)
- Race & ethnicity
- Black 56% Hispanic / Latino 31% Two or more races 18% White 8% Asian 2%
- Hispanic origin (detail)
- Puerto Rican 4% Cuban 7% Dominican 4% Salvadoran 1%
- Common ancestry
- Hispanic 35% Estonian 1% Lithuanian 1%
- Foreign-born
- 51% · Canada, Jamaica, Dominican Republic
- Languages at home
- 25% English-only · French/Haitian/Cajun 41% Spanish 30% Other Indo-European 2%
Political lean MEDSL · Miami-Dade
- 2024 margin
- R (+11.4) · D 43.9% · R 55.4%
- 2008→2024 swing
- -27.6pp toward R · 2008: 16.1pp · 2024: -11.4pp
- All cycles
- 2024: R+11.4 2020: D+7.3 2016: D+29.6 2012: D+23.7 2008: D+16.1
Not yet ingested
- Civics
- —
Market trends
- HPI YoY
- ▼ -492.86%
- Current HPI
- 630.6932
- Rent YoY
- ▼ -0.73%
- Metro
- Miami-Fort Lauderdale-Pompano Beach, FL
- State GDP YoY
- ▲ 3.28%
- F500 in state
- 36
Industry mix (Fortune 500 HQ in FL)
| Industry | F500 HQs | Revenue |
|---|---|---|
| Industrial Technology | 2 | $29B |
|
||
| Insurance | 2 | $17B |
|
||
| Retail | 1 | $60B |
|
||
| Technology Distribution | 1 | $58B |
|
||
| Homebuilding | 1 | $35B |
|
||
| Technology Manufacturing | 1 | $35B |
|
||
Price history
+1507.1% since first listed14 events — show timeline
- 2026-05-21 Listed $675,000 MARMLS
- 2026-03-10 Listing Removed — MARMLS
- 2026-01-06 Price Changed $750,000 MARMLS
- 2025-10-29 Price Changed $775,000 MARMLS
- 2025-09-11 Listed $800,000 MARMLS
- 2020-09-16 Listing Removed — MARMLS
- 2020-09-15 Relisted — MARMLS
- 2020-07-08 Listed $370,000 MARMLS
- 2012-12-26 Sold (MLS) $92,500 MARMLS
- 2012-12-21 Sold (Public Records) $92,500 Public Records
- 2012-09-10 Sold (Public Records) $107,000 Public Records
- 2004-06-08 Sold (Public Records) $160,000 Public Records
- 1993-10-29 Sold (Public Records) $65,000 Public Records
- 1979-08-01 Sold (Public Records) $42,000 Public Records
Property tax history
+6.4%/yrLatest (2025): $7,178 · +7.0% YoY. Source: county tax records.
Cash-flow waterfall
monthlySold comps — $/sqft
last 12 mo · ≤1 miLoading sold comps…