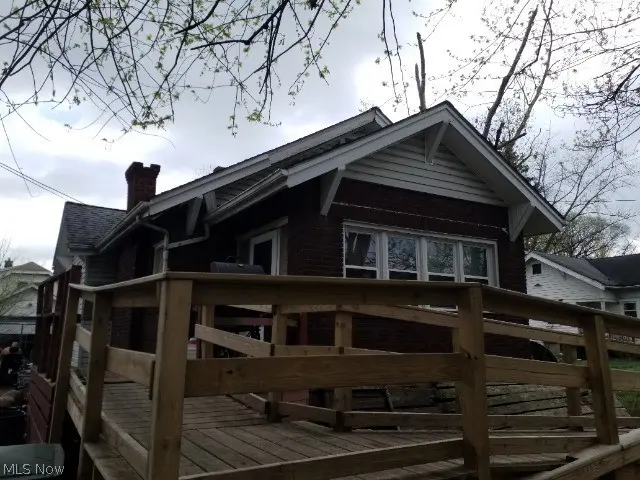
3307 Hillman St · Youngstown, OH
Flood risk 3/10 · Minor
- FEMA flood zone
- X (unshaded)
- Chance of flooding over 30 yrs
- 0.2%
- Est. flood insurance / yr
- $473 – $860
Fire risk 1/10 · Minimal
- Est. fire insurance / yr
- $713 – $1,323
Heat risk 2/10 · Minimal
- Hot days now (above 97°F)
- 7 days/yr
- Hot days in 30 yrs
- 16 days/yr
Wind risk 1/10 · Minimal
- Chance of severe wind over 30 yrs
- —
Air-quality risk 2/10 · Minimal
- Unhealthy air days now
- 1 days/yr
- Unhealthy air days in 30 yrs
- 2 days/yr
Risk factors via First Street. Map © Google.
Why this score? — see what drove the B grade
The composite is a weighted blend of 9 inputs, each scored 0–100. Each bar is that input's sub-score; the figure is the points it added to the 100-point composite (weight × sub-score).
- Cash flow +30.0/30.0
- 1% rule +10.0/10.0
- DSCR +10.0/10.0
- ARV discount +7.5/15.0
- Appreciation +4.6/10.0
- Livability +4.0/5.0
- Rent growth +2.5/5.0
- Condition / age +2.5/5.0
- Schools +0.9/10.0
$34,900
🖨 Deal sheet (PDF) 📄 Offer letter ✓ Due diligence
Listing remarks
No wholesalers. No Seller financing. No low ball offers. Unlock the potential of this value-add BRRRR opportunity! Currently owner occupied, this property offers a solid foundation for investors looking to renovate, refinance, and generate long-term cash flow! Featuring 2 bedrooms and 1 bathroom, the home includes a spacious living area, a functional kitchen ready for modernization, and a full basement that provides ample storage space and additional value-add possibilities. The exterior is built with durable brick siding, complemented by vinyl windows and a younger roof, helping reduce major capital expenditure concerns. While the property does require a full cosmetic renovation, the core
Key facts
- Functional kitchen
- Vinyl windows
- Solid foundation
Tags
Property features AI
Exterior
- Parking: Detached garage with driveway (1 garage space)
- Utilities: Public water; Public sewer
- Home design: 2-story home; Asphalt/fiberglass roof
- Construction: Built per public records; Brick exterior; Asphalt/Fiberglass roof; Full basement foundation
- Exterior features: Brick construction
Interior
- Bedrooms: Total of 6 rooms (bedrooms included)
- Bathrooms: 1 full bathroom (main level)
- Heating & cooling: Forced air heating
- Interior features: Full basement; Fireplace (1)
- Laundry & utility: Laundry in basement
Neighborhood map
What this means for you Summary
Snapshot
- This is a 2-bed/1.0-bath single-family listed at $35k.
Deal economics
- At list price, monthly cash flow is $658 ($8k/yr) — positive.
- The deal already cash-flows at list — no discount required.
- Meets the 1% rule at list price ($1k rent vs $35k).
- Recommended offer: $34k (3.0% below list) — sets the bar for market timing.
- Cap rate 28.9% vs local median 7.0% in Youngstown — top-decile yield for the area; either an underpriced asset or a hidden risk that comps aren't pricing in. Stress-test before assuming the spread holds.
Location & tenants
- Location reads 81/100 on livability (#99 in OH, #1,506 nationally) — a professional / high-income tenant draw. Strengths: amenities A+, commute A+, cost of living A+; Watch: crime F, employment F.
- Youngstown City (urban): math 8% / reading 17% proficiency, ranked #649 of 656 in OH (top 99%) — low school quality limits family demand, transient renter base, plan for 1-2y turnover; 88% free/reduced lunch — lower-income household profile, screen leases tightly.
- Market conditions: 35 active listings in the ZIP; 1 comparable units currently listed for rent nearby; lower-income renter base — watch delinquency; 147 units permitted in Mahoning County in 2024 (0 in 5+ unit buildings).
- At $1,100/mo this rent would consume 51% of the median local household income ($26k/yr) (locally 17% of renters already pay >50% of income on rent) — very limited rent-growth headroom before tenants either downsize or default.
Forward outlook
- Local home prices are declining (-0.8%/yr); year-one equity from $241 of loan paydown is wiped out by about $289 of value loss. Plan a longer hold.
- Mahoning County population projected at -14% by 2050 — secular population decline; favor cash flow + early exit over multi-decade hold.
- At projected returns (-0.8% appreciation + 3.0% rent growth), your $10k cash investment doubles in ~2 years — after that, you're playing with house money.
Negotiation context
- It's been on market 42 days — a 3% lower offer ($34k) is reasonable based on typical stale-listing flexibility.
Risks & watch-outs
- Watch-outs: built in 1927 — expect roof / HVAC / electrical / plumbing capex.
Questions for the listing agent
- It's been on market 42 days. Have you received any prior offers? Is the seller open to a 3% concession, seller financing, or rate buy-down credit?
- Built in 1927 — when were the roof, HVAC, electrical panel, plumbing, and water heater last replaced?
- Is there a deadline driving the sale (1031 exchange, divorce, estate, relocation)? That informs how much negotiation room exists.
- Crime grade is F in this area — have there been break-ins, vandalism, or insurance claims at this property in the last 3 years? What carrier currently insures it and at what premium?
- What's the average days-on-market for RENTAL listings here right now (not sales)? A rising rental-DOM trend means longer vacancies and softer asking-rent achievability than the comps imply.
- What's the recent tenant-quality profile in this submarket — average credit score on applications, eviction rate, late-payment / NSF rate, and stable-employment percentage? A property-management company in the area should have these aggregated.
- How much new for-sale + rental construction is in the pipeline within 1–3 miles? Heavy new supply typically softens prices + rents 12–24 months out; constrained supply supports both.
Investment metrics
- 1% rule
- 3.15% ✓
- Cap rate
- 28.93%
- Cash-on-cash
- 80.83%
- DSCR
- 4.60
- GRM
- 2.6
CMA / ARV
- ARV (on-the-fly)
- $101,964
- Comps found
- 12
Show comp detail 12 sales within ~0.75 mi
| Address | Dist | Beds/Ba | Sqft | Sold | Price | $/sf | Match |
|---|---|---|---|---|---|---|---|
| 3412 Hudson Ave | 0.17mi | 3/1.5 (+1) | 1,716 (-2%) | 2mo | $60,250 | $35 | 79 |
| 3135 Idlewood Ave | 0.10mi | 3/1.5 (+1) | 1,788 (+2%) | 14mo | $67,000 | $37 | 74 |
| 442 Ferndale Ave | 0.29mi | 3/2.0 (+1) | 1,773 (+1%) | 16mo | $77,000 | $43 | 62 |
| 512 Ferndale Ave | 0.43mi | 3/1.0 (+1) | 1,859 (+6%) | 11mo | $108,000 | $58 | 56 |
| 123 Prestwick Dr | 0.48mi | 3/1.5 (+1) | 1,671 (-5%) | 8mo | $194,500 | $116 | 56 |
| 537 W Ravenwood Ave | 0.47mi | 3/1.0 (+1) | 1,592 (-9%) | 11mo | $40,000 | $25 | 48 |
| 4018 Windsor Rd | 0.56mi | 3/2.5 (+1) | 1,910 (+9%) | 4mo | $265,000 | $139 | 45 |
| 4005 Hudson Dr | 0.44mi | 3/1.5 (+1) | 1,564 (-11%) | 15mo | $190,000 | $121 | 41 |
| 4021 Howard St | 0.54mi | 3/1.5 (+1) | 1,889 (+8%) | 21mo | $122,000 | $65 | 38 |
| 3033 Glenwood Ave | 0.61mi | 3/1.0 (+1) | 1,554 (-12%) | 11mo | $65,000 | $42 | 38 |
| 119 E Philadelphia Ave | 0.54mi | 3/1.0 (+1) | 1,552 (-12%) | 19mo | $23,000 | $15 | 34 |
| 4302 Helena Ave | 0.73mi | 3/1.5 (+1) | 1,560 (-11%) | 17mo | $123,000 | $79 | 26 |
Match score weights: distance 35% · size 25% · config 20% · recency 20%. Top-matched comps best support the ARV.
Projected returns pro-forma
-0.83% appreciation · 3.0% rent growth · sell at horizon
- IRR
- 82.5%
- Equity multiple
- 5.05×
- Total profit
- $39,567
- Equity at exit
- $8,714
- IRR
- 84.5%
- Equity multiple
- 10.37×
- Total profit
- $91,556
- Equity at exit
- $9,400
Cash invested: $9,772 (down + closing). Projections, not guarantees.
Landlord ↔ Tenant lean methodology
- Overall (STATE)
- 73 Landlord-Friendly
- State Ohio
- 73 Landlord-Friendly · R+6
- County
- — inherits STATE
- City
- — inherits STATE
ZIP-level market 44507
- Home prices YoY
- -0.3%
- Active inventory
- 35
- Price-to-rent
- 2.6×
Monthly cashflow live
- Estimated rent
- $1,100 medium interval (Pro) →
- Mortgage (P&I)
- −$183
- Tax from tax record
- −$13 /mo · $158/yr
- Insurance
- −$15
- HOA
- −$0
- Vacancy / Maint / Mgmt
- −$231
- Net cashflow
- $658
Break-even live
Sensitivity live
| Price | -10% $678 | -5% $668 | +0% $658 | +5% $648 | +10% $638 |
|---|---|---|---|---|---|
| Rent | -10% $571 | -5% $615 | +0% $658 | +5% $702 | +10% $745 |
| Rate | -1.0pp $676 | -0.5pp $667 | base $658 | +0.5pp $649 | +1.0pp $640 |
UW: 25.0% down · 7.5% · 30yr · 1.5% tax · 5.0% vac · 8.0% maint · 8.0% mgmt
Financing live
Cash to close
- Down payment
- $8,725
- Closing costs
- $1,047
- Reserves months
- —
- Total cash needed
- —
Loan-product check · same deal, 3 products live
Conventional
25% down · 7.5% · 30yr
- Down + closing
- —
- Monthly P&I
- —
- Monthly cashflow
- —
- DSCR
- —
- Eligible?
- —
Personal DTI + credit; lowest rate.
DSCR
20% down · 8.5% · 30yr
- Down + closing
- —
- Monthly P&I
- —
- Monthly cashflow
- —
- DSCR
- —
- Eligible?
- —
No personal income docs; deal must DSCR.
Hard money
10% down · 12.0% · 12mo
- Down + closing
- —
- Monthly P&I
- —
- Monthly cashflow
- —
- DSCR
- —
- Eligible?
- —
Short-term bridge; refi at stabilization.
Rent comps 1 comps
| Address | Beds | Baths | Sqft | Rent | $/sqft | DOM | Units | Dist |
|---|---|---|---|---|---|---|---|---|
| 158 Beechwood Dr Youngstown, OH | 3.0 | 1.5 | 1438 | $1,100 | $0.76 | 15d | 1 | 1.10mi |
Listing history 12 events
-
2026-06-10days on market $34,900 Active 42 DOM
-
2026-06-09days on market $34,900 Active 41 DOM
-
2026-06-08days on market $34,900 Active 40 DOM
-
2026-06-07pricedays on market $34,900 Active 39 DOM
-
2026-06-03days on market $35,900 Active 35 DOM
-
2026-06-02days on market $35,900 Active 34 DOM
-
2026-06-01days on market $35,900 Active 33 DOM
-
2026-05-31days on market $35,900 Active 32 DOM
-
2026-05-30days on market $35,900 Active 31 DOM
-
2026-05-21price $36,900
-
2026-05-14price $37,900
-
2026-04-29$39,000 Active
ⓘ Source: listings_history table (triggers on properties + properties_extension) + one-shot
backfill from property_details.listing_events for pre-trigger history.
Tax reassessment forecast OH · Partial reset (capped growth)
- Current annual tax
- $158 · $13/mo
- Projected year-2 tax
- $351 · $29/mo
- Expected delta
- +$193/yr (+$16/mo · 122.0%)
ⓘ Screening estimate from a state-policy table — verify with the county assessor before closing.
Climate risk First Street
- Flood 3/10 Moderate FEMA zone X (unshaded) · 20% chance over 30 yrs
- Wildfire 1/10 Low
- Heat 2/10 Low 7 d/yr ≥97°F today · 16 d/yr by 30 yrs out
- Wind 1/10 Low
- Air quality 2/10 Low 1 unhealthy d/yr today · 2 by 30 yrs out
Nearby sold comps map
Loading sold comps map…
Walkable amenities ~0.75 mi
Loading nearby amenities…
Taxation est. · year 1
- Rental income
- $13,200
- − Mortgage interest
- −$1,955
- − Property taxes
- −$158
- − Insurance
- −$174
- − Repairs & maintenance
- −$1,056
- − Management
- −$1,056
- − Depreciation
- −$1,015
- Taxable income
- $7,785
- Est. tax owed @ 24.0%
- −$1,868
- After-tax cash flow
- $6,031/yr
For passive investors: Depreciation is non-cash, so a rental often shows a tax loss while cash-flowing — sheltering income. Rental losses are passive: they offset passive income freely, and up to $25,000/yr can offset ordinary (W-2) income if you actively participate and your MAGI is under $100k (phasing out to $0 by $150k); unused losses carry forward. On sale, claimed depreciation is recaptured at up to 25%, and gains may owe capital-gains tax (a 1031 exchange can defer both). Figures are a year-1 estimate at your 24.0% rate — not tax advice; consult a CPA.
Schools (NCES district)
- District
- Youngstown City
- NCES district ID
- 3904516
- Math proficiency
- 8% ▼ -15.00%
- Reading proficiency
- 17% ▼ -10.00%
- Median HH income
- $25,257
- Composite
- 9.29/100
- National rank
- #9858
- State rank
- #649 of 656 in OH
Livability — Youngstown
- Score
- 81/100
- State rank
- #99
- US rank
- #1506
Category grades
Schools grade is shown separately in the Schools card above.
Census & demographics
- Census place
- Youngstown, OH
- County
- Mahoning · 224,175 people
- City population
- 28,503
- Metro
- Youngstown-Warren, OH
- Population (ZIP)
- 4,402
- Household income
- $25,767
- Rent vs Own
- Severe rent burden
- 17.1
Population outlook (Mahoning County) Hauer SSP2
- Today (2025)
- 223,932 people
- By 2030
- 218,387 · -2.5%
- By 2040
- 205,367 · -8.3%
- By 2050
- 193,606 · -13.5%
- By 2075
- 173,694 · -22.4%
- By 2100
- 151,147 · -32.5%
Race, ethnicity, and origin ACS 2023
- Neighborhood character
- Diverse neighborhood (Simpson 0.58)
- Race & ethnicity
- Black 60% White 20% Hispanic / Latino 12% Two or more races 10%
- Hispanic origin (detail)
- Puerto Rican 10%
- Common ancestry
- Subsaharan African 2% Hispanic 2% Romanian 1%
- Foreign-born
- 3% · Canada
- Languages at home
- 89% English-only · Spanish 10%
Political lean MEDSL · Mahoning
- 2024 margin
- Lean R (+9.4) · D 44.9% · R 54.4%
- 2008→2024 swing
- -36.1pp toward R · 2008: 26.6pp · 2024: -9.4pp
- All cycles
- 2024: R+9.4 2020: R+1.9 2016: D+3.0 2012: D+27.7 2008: D+26.6
Not yet ingested
- Civics
- —
Market trends
- HPI YoY
- ▼ -0.83%
- Current HPI
- 282.496
- Rent YoY
- —
- Metro
- —
- State GDP YoY
- ▲ 1.98%
- F500 in state
- 48
Industry mix (Fortune 500 HQ in OH)
| Industry | F500 HQs | Revenue |
|---|---|---|
| Insurance | 3 | $145B |
|
||
| Industrial Machinery | 3 | $49B |
|
||
| Financial Services | 3 | $24B |
|
||
| Consumer Goods | 2 | $93B |
|
||
| Aerospace / Defense | 2 | $47B |
|
||
| Utilities | 2 | $33B |
|
||
Price history
-5.4% since first listed3 events — show timeline
- 2026-05-21 Price Changed $36,900 MLSNOW
- 2026-05-14 Price Changed $37,900 MLSNOW
- 2026-04-29 Listed $39,000 MLSNOW
Property tax history
-5.2%/yrLatest (2025): $158 · -19.2% YoY. Source: county tax records.
Cash-flow waterfall
monthlySold comps — $/sqft
last 12 mo · ≤1 miLoading sold comps…