9652 Ronald Dr · Blaine, WA
Flood risk 1/10 · Minimal
- FEMA flood zone
- X (unshaded)
- Chance of flooding over 30 yrs
- 0.0%
- Est. flood insurance / yr
- $473 – $860
Fire risk 1/10 · Minimal
- Est. fire insurance / yr
- $604 – $1,122
Heat risk 2/10 · Minimal
- Hot days now (above 81°F)
- 7 days/yr
- Hot days in 30 yrs
- 17 days/yr
Wind risk 1/10 · Minimal
- Chance of severe wind over 30 yrs
- —
Air-quality risk 7/10 · Major
- Unhealthy air days now
- 11 days/yr
- Unhealthy air days in 30 yrs
- 11 days/yr
Risk factors via First Street. Map © Google.
Why this score? — see what drove the D grade
The composite is a weighted blend of 9 inputs, each scored 0–100. Each bar is that input's sub-score; the figure is the points it added to the 100-point composite (weight × sub-score).
- ARV discount +15.0/15.0
- Appreciation +10.0/10.0
- Schools +4.7/10.0
- Livability +3.9/5.0
- Cash flow +3.5/30.0
- Rent growth +3.3/5.0
- Condition / age +2.5/5.0
- 1% rule +0.0/10.0
- DSCR +0.0/10.0
$750,000
🖨 Deal sheet (PDF) 📄 Offer letter ✓ Due diligence
Listing remarks
Discover the possibilities in this versatile 4-bedroom home, ideally situated at the end of a quiet drive just minutes from all that Blaine has to offer. Designed with flexibility in mind, including excellent ADU potential, this spacious property features two inviting living areas (one with a cozy fireplace), a dedicated office, formal dining room, and a large downstairs bonus room. You’ll also find abundant closet space and approximately 1,000 square feet of dry storage, providing room for everything you need. Step outside to enjoy your own heated in-ground pool, perfect for relaxing or entertaining. Numerous recent upgrades mean the hard work is already complete, including a newer r
Key facts
- Adu potential
- Formal dining room
- Dedicated office
Tags
Property features AI
Finance
- Other: Listing is active; Buyer brokerage compensation: 2.5%
- Financial info: Financing available: Cash, Conventional, FHA, VA
Exterior
- Parking: Attached garage with 3 covered spaces
- Security: Partially fenced
- Utilities: Public water; Sewer: Septic tank; Power: City of Blaine; Water heater is electric (located in basement bathroom); Energy sources: Electric, propane, wood
- Home design: Single-family house; One level with basement; Main entry; Faces northwest; Accessible features included
- Construction: Wood construction; Composition roof; Poured concrete foundation; Built on lot; Style: One story with basement; Property condition: Good; Structure type: House; Year built not provided
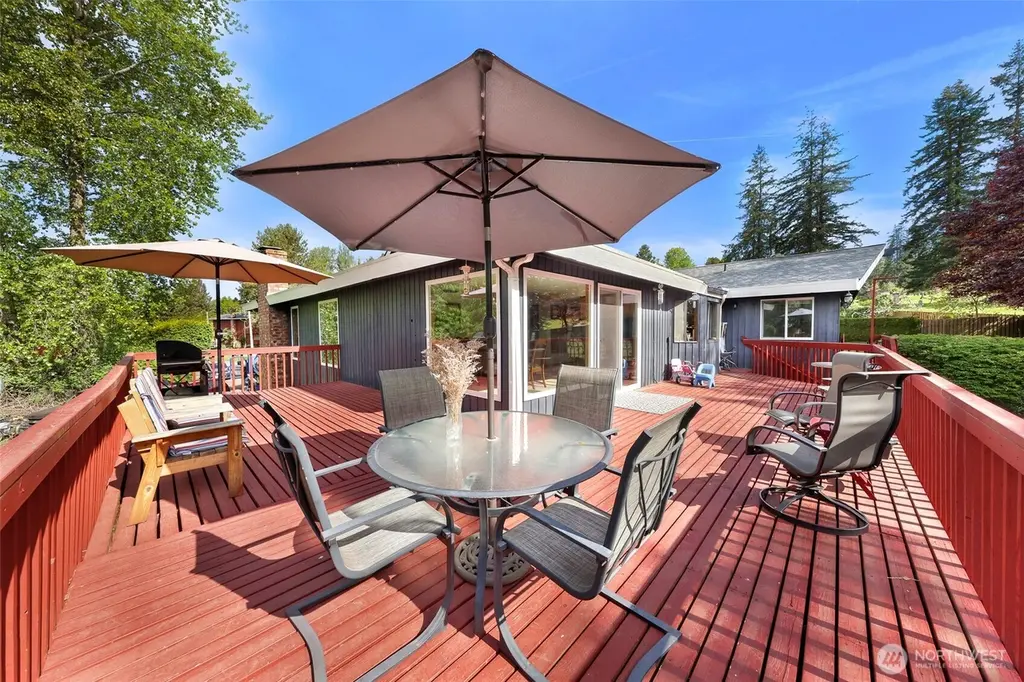
- Exterior features: Wood exterior; Deck; Partially fenced yard; Hot tub / spa; Garden space; Located on a dead-end street; Partial slope topography; Has view
Interior
- Kitchen: Dishwasher; Double oven; Stove / range; Refrigerator
- Bedrooms: Four bedrooms (all on the main level)
- Flooring: Ceramic tile; Vinyl; Carpet
- Bathrooms: One full bathroom; Two three-quarter bathrooms; Three showers; One bathtub
- Heating & cooling: Forced air heating; No central air listed
- Interior features: Built-in vacuum; Dining room; Fireplace (wood burning); French doors; Hot tub / spa; Jetted tub; Walk-in closets; Water heater; Wired for generator; Accessible bathroom
- Laundry & utility: Washer; Dryer
Neighborhood map
What this means for you Summary
Snapshot
- This is a 4-bed/3.0-bath single-family listed at $750k.
Deal economics
- At list price, monthly cash flow is $-2k ($-27k/yr) — negative.
- To cash-flow at today's rent, offer at most $348k (53.6% below list).
- To meet the 1% rule (rent ≥ 1% of price), the offer needs to be $316k (57.8% below list).
- Recommended offer: $316k (57.8% below list) — sets the bar for 1% rule.
- Cap rate 2.7% vs local median 2.2% in Blaine — meaningfully above typical; check what's discounted (condition, days-on-market, listing class) to confirm the premium yield is real.
Location & tenants
- Location reads 78/100 on livability (#125 in WA, #2,491 nationally) — a middle-class / working-renter tenant base. Strengths: commute A+, health & safety A+, housing A; Watch: amenities F, cost of living F.
- Blaine School District (town): math 49% / reading 55% proficiency, ranked #120 of 291 in WA (top 41%) — acceptable for families but not a draw, mixed tenant base, ~2y average lease.
- Zoned schools: Blaine Elementary School (463 students, 54% FRL); Blaine Middle School (459 students, 54% FRL); Blaine High School (609 students, 46% FRL) — zoned schools average 51% FRL vs 33% district-wide (18 pts higher); higher-poverty schools than district average — tighter screening recommended.
- Market conditions: Rents rising (+3.1%/yr); 461 active listings in the ZIP; solid renter incomes; 1,190 units permitted in Whatcom County in 2024 (327 in 5+ unit buildings).
- This rent runs 44% of the median local income ($87k/yr) — at the standard rent-burdened threshold; future hikes will face affordability resistance.
Forward outlook
- In year one you build about $80k of equity ($5k loan paydown + $75k appreciation (10.0% local appreciation)).
- Whatcom County population projected at +28% by 2050 — long-run rental-demand tailwind backs the buy-and-hold thesis.
- By year 2, paydown + projected appreciation supports a ~$129k cash-out refi (75% LTV) — recoverable capital for the next deal without selling this one.
Negotiation context
- It's been on market 21 days — a 2% lower offer ($739k) is reasonable based on typical stale-listing flexibility.
Questions for the listing agent
- What do current leases actually rent for vs. the listed asking? Can we see a recent rent roll and the last 12 months of T-12 income?
- Built in 1978 — when were the roof, HVAC, electrical panel, plumbing, and water heater last replaced?
- Is there a deadline driving the sale (1031 exchange, divorce, estate, relocation)? That informs how much negotiation room exists.
- Schools are B-rated — typically a magnet for longer-tenancy family renters. What's the average tenant stay here, and is there a school-zone premium baked into asking?
- The area grade is low — what's the realistic commute time and amenity access for the typical tenant pool here? Any planned neighborhood developments (good or bad) we should know about?
- What's the average days-on-market for RENTAL listings here right now (not sales)? A rising rental-DOM trend means longer vacancies and softer asking-rent achievability than the comps imply.
- What's the recent tenant-quality profile in this submarket — average credit score on applications, eviction rate, late-payment / NSF rate, and stable-employment percentage? A property-management company in the area should have these aggregated.
- How much new for-sale + rental construction is in the pipeline within 1–3 miles? Heavy new supply typically softens prices + rents 12–24 months out; constrained supply supports both.
Investment metrics
- 1% rule
- 0.42% ✗
- Cap rate
- 2.65%
- Cash-on-cash
- -13.01%
- DSCR
- 0.42
- GRM
- 19.8
CMA / ARV
- ARV (median comp)
- $1,098,249
- List price
- $750,000
- Delta
- -31.71%
- Verdict
- UNDERPRICED
- Comps
- 2 within 1.0 mi
Projected returns pro-forma
10.0% appreciation · 3.1% rent growth · sell at horizon
- IRR
- 15.2%
- Equity multiple
- 2.26×
- Total profit
- $263,578
- Equity at exit
- $675,659
- IRR
- 14.9%
- Equity multiple
- 5.24×
- Total profit
- $890,471
- Equity at exit
- $1,457,085
Cash invested: $210,000 (down + closing). Projections, not guarantees.
Landlord ↔ Tenant lean methodology
- Overall (STATE)
- 28 Tenant-Leaning
- State Washington
- 28 Tenant-Leaning · D+8
- County
- — inherits STATE
- City
- — inherits STATE
ZIP-level market 98230
- Home prices YoY
- 14.0%
- Rents YoY
- 3.1%
- Active inventory
- 461
- Price-to-rent
- 19.8×
Monthly cashflow live
- Estimated rent
- $3,162 medium interval (Pro) →
- Mortgage (P&I)
- −$3,933
- Tax from tax record
- −$529 /mo · $6,352/yr
- Insurance
- −$312
- HOA
- −$0
- Vacancy / Maint / Mgmt
- −$664
- Net cashflow
- $-2,277
Break-even live
Sensitivity live
| Price | -10% $-1,852 | -5% $-2,064 | +0% $-2,277 | +5% $-2,489 | +10% $-2,701 |
|---|---|---|---|---|---|
| Rent | -10% $-2,527 | -5% $-2,402 | +0% $-2,277 | +5% $-2,152 | +10% $-2,027 |
| Rate | -1.0pp $-1,899 | -0.5pp $-2,086 | base $-2,277 | +0.5pp $-2,471 | +1.0pp $-2,669 |
UW: 25.0% down · 7.5% · 30yr · 1.5% tax · 5.0% vac · 8.0% maint · 8.0% mgmt
Financing live
Cash to close
- Down payment
- $187,500
- Closing costs
- $22,500
- Reserves months
- —
- Total cash needed
- —
Loan-product check · same deal, 3 products live
Conventional
25% down · 7.5% · 30yr
- Down + closing
- —
- Monthly P&I
- —
- Monthly cashflow
- —
- DSCR
- —
- Eligible?
- —
Personal DTI + credit; lowest rate.
DSCR
20% down · 8.5% · 30yr
- Down + closing
- —
- Monthly P&I
- —
- Monthly cashflow
- —
- DSCR
- —
- Eligible?
- —
No personal income docs; deal must DSCR.
Hard money
10% down · 12.0% · 12mo
- Down + closing
- —
- Monthly P&I
- —
- Monthly cashflow
- —
- DSCR
- —
- Eligible?
- —
Short-term bridge; refi at stabilization.
Listing history 1 events
-
2026-05-07$775,000 Active
ⓘ Source: listings_history table (triggers on properties + properties_extension) + one-shot
backfill from property_details.listing_events for pre-trigger history.
Tax reassessment forecast WA · Resets to sale price
- Current annual tax
- $6,352 · $529/mo
- Projected year-2 tax
- $7,350 · $612/mo
- Expected delta
- +$998/yr (+$83/mo · 15.7%)
ⓘ Screening estimate from a state-policy table — verify with the county assessor before closing.
Climate risk First Street
- Flood 1/10 Low FEMA zone X (unshaded) · 0% chance over 30 yrs
- Wildfire 1/10 Low
- Heat 2/10 Low 7 d/yr ≥81°F today · 17 d/yr by 30 yrs out
- Wind 1/10 Low
- Air quality 7/10 Severe 11 unhealthy d/yr today · 11 by 30 yrs out
Nearby sold comps map
Loading sold comps map…
Walkable amenities ~0.75 mi
Loading nearby amenities…
Taxation est. · year 1
- Rental income
- $37,947
- − Mortgage interest
- −$42,012
- − Property taxes
- −$6,352
- − Insurance
- −$3,750
- − Repairs & maintenance
- −$3,036
- − Management
- −$3,036
- − Depreciation
- −$21,818
- Taxable loss
- −$42,057
- Est. tax savings @ 24.0%
- +$10,094
- After-tax cash flow
- $-17,227/yr
For passive investors: Depreciation is non-cash, so a rental often shows a tax loss while cash-flowing — sheltering income. Rental losses are passive: they offset passive income freely, and up to $25,000/yr can offset ordinary (W-2) income if you actively participate and your MAGI is under $100k (phasing out to $0 by $150k); unused losses carry forward. On sale, claimed depreciation is recaptured at up to 25%, and gains may owe capital-gains tax (a 1031 exchange can defer both). Figures are a year-1 estimate at your 24.0% rate — not tax advice; consult a CPA.
Schools (NCES district)
- District
- Blaine School District
- NCES district ID
- 5300570
- Math proficiency
- 49% ▼ -1.00%
- Reading proficiency
- 55% ▼ -2.00%
- Median HH income
- $57,085
- Composite
- 47.05/100
- National rank
- #5128
- State rank
- #120 of 291 in WA
Livability — Blaine
- Score
- 78/100
- State rank
- #125
- US rank
- #2491
Category grades
Schools grade is shown separately in the Schools card above.
Census & demographics
- County
- Whatcom County · 209,776 people
- Metro
- Bellingham, WA
- Population (ZIP)
- 18,744
- Household income
- $86,623
- Rent vs Own
- Severe rent burden
- 454.0
Population outlook (Whatcom County) Hauer SSP2
- Today (2025)
- 240,408 people
- By 2030
- 254,667 · +5.9%
- By 2040
- 281,365 · +17.0%
- By 2050
- 307,592 · +27.9%
- By 2075
- 375,576 · +56.2%
- By 2100
- 421,637 · +75.4%
Race, ethnicity, and origin ACS 2023
- Neighborhood character
- Predominantly White (77%)
- Race & ethnicity
- White 77% Two or more races 11% Hispanic / Latino 9% Asian 3% Pacific Islander 2% Black 1%
- Hispanic origin (detail)
- Mexican 5%
- Common ancestry
- Portuguese 6% Iranian 4% Lithuanian 3%
- Foreign-born
- 13% · Canada, China
- Languages at home
- 89% English-only · Spanish 4% Russian/Polish/Slavic 1% Other Indo-European 1%
Political lean MEDSL · Whatcom
- 2024 margin
- Strong D (+24.9) · D 60.8% · R 35.9% · Other 3.3%
- 2008→2024 swing
- +6.9pp toward D · 2008: 18.0pp · 2024: 24.9pp
- All cycles
- 2024: D+24.9 2020: D+23.9 2016: D+17.7 2012: D+12.1 2008: D+18.0
Not yet ingested
- Civics
- —
Market trends
- HPI YoY
- ▲ 106.58%
- Current HPI
- 868.68
- Rent YoY
- ▲ 3.10%
- Metro
- Bellingham, WA
- State GDP YoY
- ▲ 4.65%
- F500 in state
- 22
Industry mix (Fortune 500 HQ in WA)
| Industry | F500 HQs | Revenue |
|---|---|---|
| Retail | 2 | $269B |
|
||
| Technology / Retail | 1 | $638B |
|
||
| Technology | 1 | $245B |
|
||
| Telecommunications | 1 | $38B |
|
||
| Food / Beverage | 1 | $36B |
|
||
| Automotive / Trucks | 1 | $34B |
|
||
Price history
-3.2% since first listed3 events — show timeline
- 2026-05-28 Pending — NWMLS as Distributed by MLS Grid
- 2026-05-20 Price Changed $750,000 NWMLS as Distributed by MLS Grid
- 2026-05-07 Listed $775,000 NWMLS as Distributed by MLS Grid
Property tax history
+4.2%/yrLatest (2026): $6,352 · +1.4% YoY. Source: county tax records.
Cash-flow waterfall
monthlySold comps — $/sqft
last 12 mo · ≤1 miLoading sold comps…