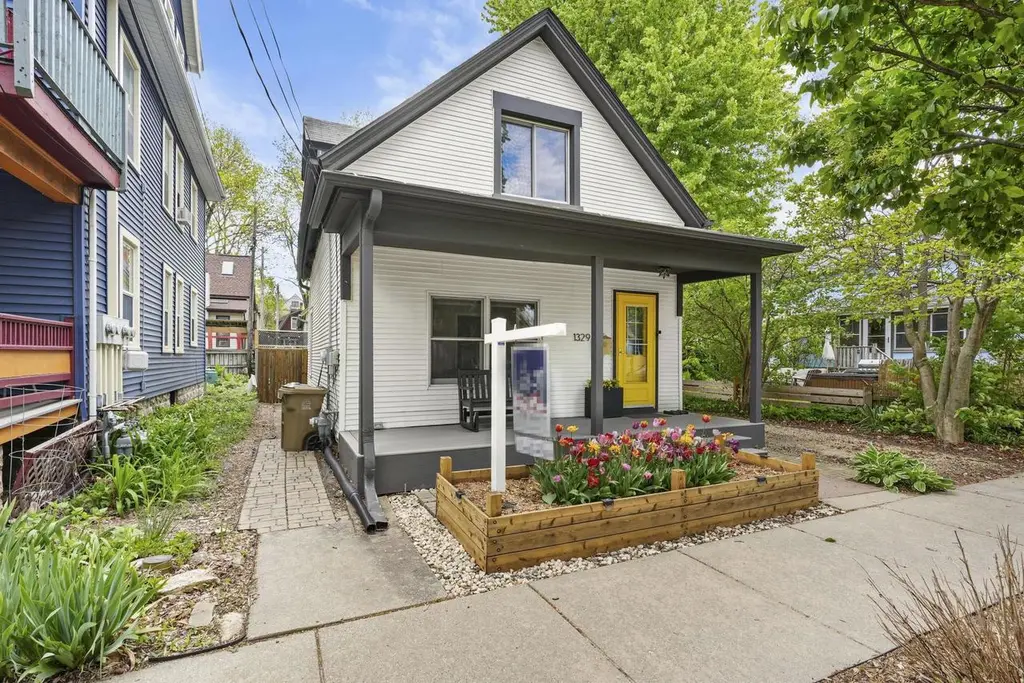
1329 Dewey Ct · Madison, WI
Flood risk 1/10 · Minimal
- FEMA flood zone
- X (unshaded)
- Chance of flooding over 30 yrs
- 0.0%
- Est. flood insurance / yr
- $473 – $860
Fire risk 1/10 · Minimal
- Est. fire insurance / yr
- $636 – $1,182
Heat risk 2/10 · Minimal
- Hot days now (above 100°F)
- 7 days/yr
- Hot days in 30 yrs
- 14 days/yr
Wind risk 2/10 · Minimal
- Chance of severe wind over 30 yrs
- —
Air-quality risk 3/10 · Minor
- Unhealthy air days now
- 2 days/yr
- Unhealthy air days in 30 yrs
- 3 days/yr
Risk factors via First Street. Map © Google.
Why this score? — see what drove the F grade
The composite is a weighted blend of 9 inputs, each scored 0–100. Each bar is that input's sub-score; the figure is the points it added to the 100-point composite (weight × sub-score).
- ARV discount +13.0/15.0
- Cash flow +5.3/30.0
- Livability +4.2/5.0
- Schools +3.3/10.0
- Rent growth +3.1/5.0
- Condition / age +2.5/5.0
- 1% rule +1.0/10.0
- DSCR +0.0/10.0
- Appreciation +0.0/10.0
$450,000
🖨 Deal sheet (PDF) 📄 Offer letter ✓ Due diligence
Listing remarks
Marquette Bungalow boasts a quiet locale, right off the commuter bike path, walkable to Willy Street Fare and easy commute to Downtown! Love at first site, lemonade sipping new covered front porch with composite deck, planter and brick walkway! Inside the main floor plan is open, offering a great room with hardwood floors, spacious eat-in kitchen w/ new flooring, oak cabinetry, dishwasher, new lighting and fixtures. 1st floor primary suite with walk-in closet with custom built-ins, and an updated bath with new fixtures and lighting. 2nd floor boasts 3 bdrms w/ newer maple floors and one bedroom w/ cork floors, newer windows, updated light fixtures and bath w/ tile floors, surround and new f
Key facts
- Covered front porch
- Oak cabinetry
- Commuter bike path
Tags
Property features AI
Finance
- Other: Includes chest freezer; Some personal property excluded
Exterior
- Utilities: Municipal water; Municipal sewer; Natural gas
- Home design: 1.5-story single-family home; Located in the Marquette subdivision; Zoned R4
- Construction: Low energy windows
- Exterior features: Deck; Patio; Vinyl siding
Interior
- Kitchen: Range/oven; Refrigerator; Dishwasher; Reverse osmosis system
- Bedrooms: Primary bedroom on main level (13 x 9); Second bedroom on upper level (16 x 10); Third bedroom on upper level (15 x 11); Fourth bedroom on upper level (14 x 11)
- Bathrooms: Two full bathrooms; Primary bathroom with tub/shower combo
- Heating & cooling: Forced air heating (natural gas); Central air conditioning
- Interior features: Walk-in closets; Water softener; Cable/satellite available; Full basement with sump pump; Virtual tour available
- Laundry & utility: Washer and dryer included; Water softener
Neighborhood map
What this means for you Summary
Snapshot
- This is a 3-bed/2.0-bath single-family listed at $450k.
Deal economics
- At list price, monthly cash flow is $-1k ($-12k/yr) — negative.
- To cash-flow at today's rent, offer at most $272k (39.5% below list).
- To meet the 1% rule (rent ≥ 1% of price), the offer needs to be $270k (40.0% below list).
- Recommended offer: $270k (40.0% below list) — sets the bar for 1% rule.
- Cap rate 3.6% vs local median 2.4% in Madison — top-decile yield for the area; either an underpriced asset or a hidden risk that comps aren't pricing in. Stress-test before assuming the spread holds.
Location & tenants
- Location reads 84/100 on livability (#39 in WI, #819 nationally) — a professional / high-income tenant draw. Strengths: commute A+, employment A+, housing A+.
- Madison Metropolitan School District (urban): math 35% / reading 40% proficiency, ranked #193 of 342 in WI (top 56%) — families likely to look elsewhere, expect single-tenant / working-renter base with shorter leases.
- Zoned schools: Lapham Elementary (205 students, 38% FRL); O'Keeffe Middle (math 37% / reading 47%, grade D-, #124 of 383 statewide, top 35%, 452 students, 42% FRL); East High (math 32% / reading 42%, grade F, #123 of 483 statewide, top 28%, 1,649 students, 55% FRL) — zoned schools at 45% FRL track the district average.
- Market conditions: Rents rising (+2.5%/yr); 65 active listings in the ZIP; 33 comparable units currently listed for rent nearby; rentals at typical pace (median 16d on market — plan ~3-4 weeks tenant-placement turnaround); 5,519 units permitted in Dane County in 2024 (3,978 in 5+ unit buildings).
- At $2,702/mo this rent would consume 68% of the median local household income ($48k/yr) (locally 6590% of renters already pay >50% of income on rent) — very limited rent-growth headroom before tenants either downsize or default.
Forward outlook
- Local home prices are declining (-3.0%/yr); year-one equity from $3k of loan paydown is wiped out by about $14k of value loss. Plan a longer hold.
- Dane County population projected at +35% by 2050 — long-run rental-demand tailwind backs the buy-and-hold thesis.
Negotiation context
- Only 4 days on market — expect competitive offers; lowballing is unlikely to land.
- Current owner paid $310k; 45% above their basis — modest negotiation headroom, anchor on the comps not their cost.
Risks & watch-outs
- Watch-outs: built in 1900 — expect roof / HVAC / electrical / plumbing capex.
Questions for the listing agent
- What do current leases actually rent for vs. the listed asking? Can we see a recent rent roll and the last 12 months of T-12 income?
- Built in 1900 — when were the roof, HVAC, electrical panel, plumbing, and water heater last replaced?
- Is there a deadline driving the sale (1031 exchange, divorce, estate, relocation)? That informs how much negotiation room exists.
- The area grade is low — what's the realistic commute time and amenity access for the typical tenant pool here? Any planned neighborhood developments (good or bad) we should know about?
- What's the average days-on-market for RENTAL listings here right now (not sales)? A rising rental-DOM trend means longer vacancies and softer asking-rent achievability than the comps imply.
- What's the recent tenant-quality profile in this submarket — average credit score on applications, eviction rate, late-payment / NSF rate, and stable-employment percentage? A property-management company in the area should have these aggregated.
- How much new for-sale + rental construction is in the pipeline within 1–3 miles? Heavy new supply typically softens prices + rents 12–24 months out; constrained supply supports both.
Investment metrics
- 1% rule
- 0.60% ✗
- Cap rate
- 3.61%
- Cash-on-cash
- -9.58%
- DSCR
- 0.57
- GRM
- 13.9
CMA / ARV
- ARV (median comp)
- $512,330
- List price
- $450,000
- Delta
- -12.17%
- Verdict
- UNDERPRICED
- Comps
- 20 within 1.0 mi
Show comp detail 12 sales within ~0.75 mi
| Address | Dist | Beds/Ba | Sqft | Sold | Price | $/sf | Match |
|---|---|---|---|---|---|---|---|
| 202 S 1st St | 0.42mi | 3/2.0 | 1,233 (+1%) | 6mo | $469,000 | $380 | 74 |
| 1926 E Mifflin St | 0.56mi | 3/2.0 | 1,256 (+3%) | 3mo | $595,000 | $474 | 67 |
| 1971 E Washington Ave | 0.59mi | 2/1.5 (-1) | 1,206 (-2%) | 1mo | $424,196 | $352 | 62 |
| 113 N Ingersoll St | 0.42mi | 3/2.0 | 1,127 (-8%) | 9mo | $455,000 | $404 | 60 |
| 2002 Jenifer St | 0.58mi | 2/1.5 (-1) | 1,291 (+6%) | 1mo | $438,600 | $340 | 56 |
| 1118 Jenifer St | 0.31mi | 3/1.0 | 1,070 (-13%) | 6mo | $456,000 | $426 | 56 |
| 1046 Williamson St | 0.35mi | 3/2.0 | 1,372 (+12%) | 10mo | $295,000 | $215 | 56 |
| 514 Clemons Ave | 0.40mi | 3/2.0 | 1,375 (+12%) | 9mo | $637,000 | $463 | 54 |
| 528 Walton Pl | 0.45mi | 3/1.0 | 1,314 (+7%) | 12mo | $362,000 | $275 | 52 |
| 2005 E Mifflin St | 0.65mi | 3/1.0 | 1,286 (+5%) | 7mo | $470,000 | $365 | 51 |
| 209 N Ingersoll St | 0.46mi | 2/1.0 (-1) | 1,047 (-14%) | 7mo | $407,000 | $389 | 40 |
| 903 E Johnson St | 0.66mi | 3/1.0 | 1,371 (+12%) | 7mo | $445,000 | $325 | 39 |
Match score weights: distance 35% · size 25% · config 20% · recency 20%. Top-matched comps best support the ARV.
Projected returns pro-forma
-3.0% appreciation · 2.55% rent growth · sell at horizon
- IRR
- -33.9%
- Equity multiple
- -0.10×
- Total profit
- $-138,165
- Equity at exit
- $67,096
- IRR
- -45.3%
- Equity multiple
- -0.65×
- Total profit
- $-207,544
- Equity at exit
- $38,908
Cash invested: $126,000 (down + closing). Projections, not guarantees.
Landlord ↔ Tenant lean methodology
- Overall (STATE)
- 73 Landlord-Friendly
- State Wisconsin
- 73 Landlord-Friendly · R+2
- County
- — inherits STATE
- City
- — inherits STATE
ZIP-level market 53703
- Rents YoY
- 2.5%
- Active inventory
- 65
- Price-to-rent
- 13.9×
Monthly cashflow live
- Estimated rent
- $2,702 high interval (Pro) →
- Mortgage (P&I)
- −$2,360
- Tax from tax record
- −$594 /mo · $7,124/yr
- Insurance
- −$188
- HOA
- −$0
- Vacancy / Maint / Mgmt
- −$567
- Net cashflow
- $-1,006
Break-even live
Sensitivity live
| Price | -10% $-751 | -5% $-879 | +0% $-1,006 | +5% $-1,134 | +10% $-1,261 |
|---|---|---|---|---|---|
| Rent | -10% $-1,220 | -5% $-1,113 | +0% $-1,006 | +5% $-899 | +10% $-793 |
| Rate | -1.0pp $-780 | -0.5pp $-892 | base $-1,006 | +0.5pp $-1,123 | +1.0pp $-1,241 |
UW: 25.0% down · 7.5% · 30yr · 1.5% tax · 5.0% vac · 8.0% maint · 8.0% mgmt
Financing live
Cash to close
- Down payment
- $112,500
- Closing costs
- $13,500
- Reserves months
- —
- Total cash needed
- —
Loan-product check · same deal, 3 products live
Conventional
25% down · 7.5% · 30yr
- Down + closing
- —
- Monthly P&I
- —
- Monthly cashflow
- —
- DSCR
- —
- Eligible?
- —
Personal DTI + credit; lowest rate.
DSCR
20% down · 8.5% · 30yr
- Down + closing
- —
- Monthly P&I
- —
- Monthly cashflow
- —
- DSCR
- —
- Eligible?
- —
No personal income docs; deal must DSCR.
Hard money
10% down · 12.0% · 12mo
- Down + closing
- —
- Monthly P&I
- —
- Monthly cashflow
- —
- DSCR
- —
- Eligible?
- —
Short-term bridge; refi at stabilization.
Rent comps 33 comps
| Address | Beds | Baths | Sqft | Rent | $/sqft | DOM | Units | Dist |
|---|---|---|---|---|---|---|---|---|
| 1115 E Wilson St Madison, WI | 2.0 | 1.0–2.0 | 744 | $2,400 | $3.23 | 15d | 3 | 0.26mi |
| 1868 E Washington Ave Madison, WI | 3.0 | 1.0–2.0 | 921 | $3,725 | $4.04 | 15d | 40 | 0.41mi |
| 1050 E Washington Ave Madison, WI | 3.0 | 1.0–2.0 | 1036 | $3,750 | $3.62 | 15d | 16 | 0.41mi |
| 1010 E Washington Ave Madison, WI | 1.0–2.0 | 1.0–2.0 | 859 | $2,995 | $3.49 | 15d | 6 | 0.44mi |
| 1614 Fordem Ave Madison, WI | 1.0–2.0 | 1.0–2.0 | 779 | $1,745 | $2.24 | 15d | 12 | 0.56mi |
| 10 S Paterson St Madison, WI | 3.0 | 1.0–2.5 | 1020 | $6,450 | $6.32 | 15d | 64 | 0.59mi |
| 1625 Lane St Madison, WI | 3.0 | 1.0–2.0 | 1401 | $4,944 | $3.53 | 15d | 139 | 0.63mi |
| 803 E Mifflin St Madison, WI | 2.0 | 2.0 | 1388 | $3,200 | $2.31 | 45d | 1 | 0.66mi |
| 416 Castle Pl Unit 2 Madison, WI | 3.0 | 1.0 | 1320 | $2,000 | $1.52 | 25d | 1 | 0.71mi |
| 751 Jenifer St Apt 4 Madison, WI | 2.0 | 1.0 | 850 | $2,200 | $2.59 | 25d | 1 | 0.71mi |
| 2087 Winnebago St #3 Madison, WI | 2.0 | 1.0 | 930 | $1,625 | $1.75 | 45d | 1 | 0.73mi |
| 730 Williamson St Madison, WI | 2.0 | 1.0–2.0 | 848 | $3,350 | $3.95 | 15d | 26 | 0.76mi |
| 819 E Gorham St Unit 821 Madison, WI | 2.0 | 1.0 | 1120 | $1,680 | $1.50 | 45d | 1 | 0.77mi |
| 821 E Gorham St Madison, WI | 2.0 | 1.0 | 1120 | $1,680 | $1.50 | 45d | 1 | 0.77mi |
| 110 N Livingston St Madison, WI | 3.0 | 1.0–2.0 | 1033 | $3,959 | $3.83 | 15d | 11 | 0.78mi |
| 25 Fordem Ct Unit 25 Madison, WI | 2.0 | 1.5 | 1300 | $1,550 | $1.19 | 45d | 1 | 0.88mi |
| 27 Fordem Ct Unit 27 Madison, WI | 2.0 | 1.5 | 1300 | $1,550 | $1.19 | 45d | 1 | 0.89mi |
| 525 E Main St Madison, WI | 1.0–2.0 | 1.0–2.0 | 930 | $4,686 | $5.04 | 25d | 18 | 0.95mi |
| 614 E Johnson St Unit 626-202 Madison, WI | 2.0 | 2.0 | 941 | $1,545 | $1.64 | 45d | 1 | 0.98mi |
| 614 E Johnson St Unit 602-311 Madison, WI | 2.0 | 2.0 | 1073 | $1,660 | $1.55 | 25d | 1 | 0.98mi |
| 112 S Hancock St Unit 2 Madison, WI | 2.0 | 1.0 | 775 | $2,000 | $2.58 | 15d | 1 | 1.06mi |
| 112 S Hancock St Unit 4 Madison, WI | 2.0 | 1.0 | 950 | $2,195 | $2.31 | 15d | 1 | 1.06mi |
| 112 S Hancock St Unit 5 Madison, WI | 4.0 | 2.0 | 1250 | $2,950 | $2.36 | 15d | 1 | 1.06mi |
| 112 S Hancock St Unit 3 Madison, WI | 2.0 | 1.0 | 850 | $2,050 | $2.41 | 15d | 1 | 1.06mi |
| 151 E Wilson St Madison, WI | 3.0 | 1.0–2.5 | 1238 | $4,790 | $3.87 | 15d | 24 | 1.12mi |
| 2221 Sherman Ave Madison, WI | 1.0–2.0 | 1.0–2.0 | 917 | $2,400 | $2.62 | 15d | 2 | 1.13mi |
| 132 E Wilson St Madison, WI | 1.0–2.0 | 1.0–2.0 | 1037 | $3,450 | $3.33 | 15d | 3 | 1.16mi |
| 109 E Wilson St Madison, WI | 3.0 | 1.0–3.0 | 1476 | $14,130 | $9.57 | 15d | 220 | 1.20mi |
| 216 S Pinckney St Madison, WI | 2.0 | 1.0–2.0 | 850 | $3,450 | $4.06 | 15d | 23 | 1.24mi |
| 115 E Gilman St Madison, WI | 3.0 | 1.0–1.5 | 735 | $2,099 | $2.86 | 15d | 10 | 1.29mi |
| 2821 Union St Madison, WI | 2.0–3.0 | 1.0 | 727 | $1,500 | $2.06 | 23d | 1 | 1.45mi |
| 171 S Fair Oaks Ave Madison, WI | 2.0 | 1.0–2.0 | 769 | $2,570 | $3.34 | 15d | 39 | 1.48mi |
| 29 Langdon St Unit 7 Madison, WI | 2.0 | 1.0 | 700 | $1,995 | $2.85 | 45d | 1 | 1.49mi |
Listing history 6 events
-
2026-05-18status Pending 892-char remark
-
2026-05-13$450,000 Active 892-char remark
-
2020-06-26soldstatus $310,000
-
2012-07-18soldstatus $190,000
-
2006-07-07soldstatus $169,200
-
2000-11-02soldstatus $92,200
ⓘ Source: listings_history table (triggers on properties + properties_extension) + one-shot
backfill from property_details.listing_events for pre-trigger history.
Tax reassessment forecast WI · Partial reset (capped growth)
- Current annual tax
- $7,124 · $594/mo
- Projected year-2 tax
- $7,724 · $644/mo
- Expected delta
- +$601/yr (+$50/mo · 8.4%)
ⓘ Screening estimate from a state-policy table — verify with the county assessor before closing.
Climate risk First Street
- Flood 1/10 Low FEMA zone X (unshaded) · 0% chance over 30 yrs
- Wildfire 1/10 Low
- Heat 2/10 Low 7 d/yr ≥100°F today · 14 d/yr by 30 yrs out
- Wind 2/10 Low
- Air quality 3/10 Moderate 2 unhealthy d/yr today · 3 by 30 yrs out
Nearby sold comps map
Loading sold comps map…
Walkable amenities ~0.75 mi
Loading nearby amenities…
Taxation est. · year 1
- Rental income
- $32,427
- − Mortgage interest
- −$25,207
- − Property taxes
- −$7,124
- − Insurance
- −$2,250
- − Repairs & maintenance
- −$2,594
- − Management
- −$2,594
- − Depreciation
- −$13,091
- Taxable loss
- −$20,433
- Est. tax savings @ 24.0%
- +$4,904
- After-tax cash flow
- $-7,171/yr
For passive investors: Depreciation is non-cash, so a rental often shows a tax loss while cash-flowing — sheltering income. Rental losses are passive: they offset passive income freely, and up to $25,000/yr can offset ordinary (W-2) income if you actively participate and your MAGI is under $100k (phasing out to $0 by $150k); unused losses carry forward. On sale, claimed depreciation is recaptured at up to 25%, and gains may owe capital-gains tax (a 1031 exchange can defer both). Figures are a year-1 estimate at your 24.0% rate — not tax advice; consult a CPA.
Schools (NCES district)
- District
- Madison Metropolitan School District
- NCES district ID
- 5508520
- Math proficiency
- 35% ▼ -4.00%
- Reading proficiency
- 40% ▲ 3.00%
- Median HH income
- $51,654
- Composite
- 32.56/100
- National rank
- #5686
- State rank
- #193 of 342 in WI
Livability — Madison
- Score
- 84/100
- State rank
- #39
- US rank
- #819
Category grades
Schools grade is shown separately in the Schools card above.
Census & demographics
- Census place
- Madison, WI
- County
- Dane County · 506,461 people
- City population
- 301,931
- Metro
- Madison, WI
- Population (ZIP)
- 37,659
- Household income
- $47,847
- Rent vs Own
- Severe rent burden
- 6590.0
Population outlook (Dane County) Hauer SSP2
- Today (2025)
- 610,707 people
- By 2030
- 654,875 · +7.2%
- By 2040
- 740,480 · +21.2%
- By 2050
- 826,188 · +35.3%
- By 2075
- 1,040,574 · +70.4%
- By 2100
- 1,168,084 · +91.3%
Race, ethnicity, and origin ACS 2023
- Neighborhood character
- Predominantly White (79%)
- Race & ethnicity
- White 79% Asian 8% Two or more races 6% Hispanic / Latino 5% Black 4%
- Hispanic origin (detail)
- Mexican 2%
- Common ancestry
- Romanian 7% Portuguese 5% Slovak 3%
- Foreign-born
- 9% · China, Canada, South Korea
- Languages at home
- 88% English-only · Chinese 3% Spanish 3% Other Indo-European 2%
Political lean MEDSL · Dane
- 2024 margin
- Solid D (+51.7) · D 75.1% · R 23.4% · Other 1.5%
- 2008→2024 swing
- +4.7pp toward D · 2008: 47.0pp · 2024: 51.7pp
- All cycles
- 2024: D+51.7 2020: D+52.6 2016: D+48.0 2012: D+43.6 2008: D+47.0
Not yet ingested
- Civics
- —
Market trends
- HPI YoY
- ▼ -327.62%
- Current HPI
- 367.3015
- Rent YoY
- ▲ 2.55%
- Metro
- Madison, WI
- State GDP YoY
- ▲ 2.10%
- F500 in state
- 20
Industry mix (Fortune 500 HQ in WI)
| Industry | F500 HQs | Revenue |
|---|---|---|
| Industrial Machinery | 4 | $23B |
|
||
| Industrial Technology | 2 | $36B |
|
||
| Insurance | 1 | $36B |
|
||
| Professional Services | 1 | $19B |
|
||
| Utilities | 1 | $9B |
|
||
| Consumer Goods | 1 | $3B |
|
||
Price history
+388.1% since first listed6 events — show timeline
- 2026-05-18 Pending — SCWMLS
- 2026-05-13 Listed $450,000 SCWMLS
- 2020-06-26 Sold (Public Records) $310,000 Public Records
- 2012-07-18 Sold (Public Records) $190,000 Public Records
- 2006-07-07 Sold (Public Records) $169,200 Public Records
- 2000-11-02 Sold (Public Records) $92,200 Public Records
Property tax history
+3.9%/yrLatest (2025): $7,124 · +16.6% YoY. Source: county tax records.
Cash-flow waterfall
monthlySold comps — $/sqft
last 12 mo · ≤1 miLoading sold comps…