 Duplex
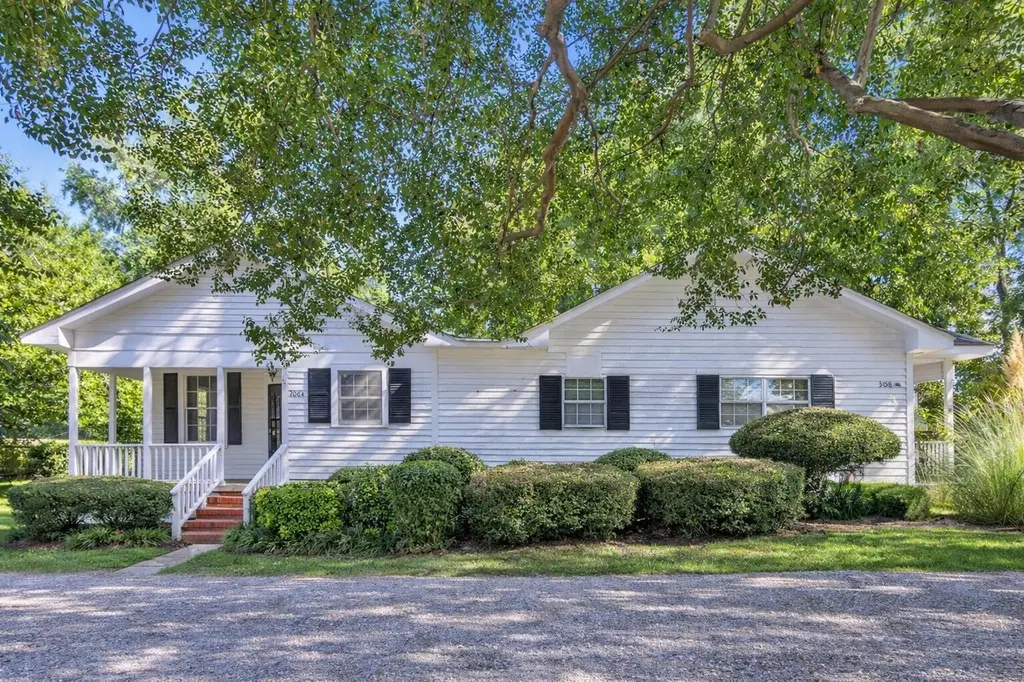
308 Belvedere Clearwater Rd · Belvedere, SC
Flood risk 1/10 · Minimal
- FEMA flood zone
- X (unshaded)
- Chance of flooding over 30 yrs
- 0.0%
- Est. flood insurance / yr
- $507 – $1,088
Fire risk 4/10 · Minor
- Est. fire insurance / yr
- $783 – $1,453
Heat risk 7/10 · Major
- Hot days now (above 106°F)
- 7 days/yr
- Hot days in 30 yrs
- 16 days/yr
Wind risk 6/10 · Moderate
- Chance of severe wind over 30 yrs
- 66.0%
Air-quality risk 3/10 · Minor
- Unhealthy air days now
- 3 days/yr
- Unhealthy air days in 30 yrs
- 4 days/yr
Risk factors via First Street. Map © Google.
Why this score? — see what drove the D+ grade
The composite is a weighted blend of 9 inputs, each scored 0–100. Each bar is that input's sub-score; the figure is the points it added to the 100-point composite (weight × sub-score).
- Cash flow +17.1/30.0
- ARV discount +7.5/15.0
- DSCR +5.3/10.0
- 1% rule +4.4/10.0
- Rent growth +3.5/5.0
- Schools +3.2/10.0
- Livability +3.0/5.0
- Condition / age +2.5/5.0
- Appreciation +0.0/10.0
$386,000
🖨 Deal sheet 📄 Offer letter ✓ Due diligence
Multi-family units
County records classify this as Multi-Family (2-4 Unit). Listing-text estimate: 2 units. confirmed
Listing remarks
Investment Opportunity! A FULLY LEASED Four-Unit income property in North Augusta, SC is now available. This is a true income-producing investment property, consisting of four rental units currently 100% occupied, delivering immediate in-place cash flow in a strong rental location just minutes from Downtown North Augusta, SC and Downtown Augusta, GA. The property includes a duplex at 308 Belvedere Clearwater Road, Units A (2 beds & 1 bath) & B (3 beds & 2 baths) along with two detached rental units behind the duplex on the same parcel, BUT with their own addresses, 312 and 314 Verdery Street, creating a great unit mix that supports consistent tenant demand and long-term st
Key facts
- Furnished unit
- Income property
- Recent improvements
Tags
Property features AI
Finance
- Other: Zoned for multi-family use
- Financial info: Multiple income units with stated actual rents: 1BR units ($700 and $737), 2BR unit ($1,145), 3BR unit ($1,445)
- HOA & community: Property is part of a homeowners association; Located in the Heritage subdivision
Exterior
- Parking: Total of 4 parking spaces; 4-car garage
- Security: Smoke detectors installed
- Utilities: Public water; Public sewer
- Home design: Residential income property (quadruplex); Single-story building; Wood siding exterior
- Construction: Composition roof; Crawl space foundation
- Exterior features: Chain-link partial backyard fencing; Property has a view; Sidewalks and street lights in the community
Interior
- Kitchen: Kitchens included in each unit
- Bedrooms: Multiple units including one-bedroom, two-bedroom, and three-bedroom units
- Flooring: Flooring details not specified
- Bathrooms: Bathrooms present in each unit
- Heating & cooling: Electric heating; Cooling provided by wall/window units and multiple unit systems
- Interior features: General interior features available
- Laundry & utility: In-unit or on-site laundry not specified
Neighborhood map
What this means for you Summary
Snapshot
- This is a 2 × 4-bed/?-bath units multifamily listed at $386k.
Deal economics
- At list price, monthly cash flow is $272 ($3k/yr) — positive. Per door: $136/mo.
- The deal already cash-flows at list — no discount required.
- To meet the 1% rule (rent ≥ 1% of price), the offer needs to be $364k (5.7% below list).
- Recommended offer: $364k (5.7% below list) — sets the bar for 1% rule.
Location & tenants
- Location reads 60/100 on livability (#225 in SC) — a middle-class / working-renter tenant base. Strengths: cost of living A+, housing A+; Watch: crime D, employment D, amenities F.
- Aiken 01 (suburban): math 31% / reading 44% proficiency, ranked #36 of 80 in SC (top 45%) — families likely to look elsewhere, expect single-tenant / working-renter base with shorter leases.
- Zoned schools: Belvedere Elementary (math 48% / reading 50%, grade D, #187 of 597 statewide, top 32%, 625 students, 39% FRL); Paul Knox Middle (math 32% / reading 43%, grade F, #90 of 229 statewide, top 42%, 683 students, 48% FRL); North Augusta High (math 51% / reading 86%, grade B, #68 of 196 statewide, top 35%, 1,719 students, 42% FRL).
- Zoned-school proficiency averages 52% at this address vs 38% district-wide (+14 pts) — the actual schools serving this property are materially stronger than the Aiken 01 average implies; a family-tenant draw the district grade alone would hide.
- Market conditions: Rents rising (+3.9%/yr); 361 active listings in the ZIP; 2,500 units permitted in Aiken County in 2024 (1,023 in 5+ unit buildings).
- At $3,639/mo this rent would consume 61% of the median local household income ($72k/yr) (locally 870% of renters already pay >50% of income on rent) — very limited rent-growth headroom before tenants either downsize or default.
Forward outlook
- Local home prices are declining (-3.0%/yr); year-one equity from $3k of loan paydown is wiped out by about $12k of value loss. Plan a longer hold.
- Aiken County population projected at +9% by 2050 — modest demand growth; plan on rents tracking national, not racing it.
Negotiation context
- It's been on market 30 days — a 2% lower offer ($380k) is reasonable based on typical stale-listing flexibility.
- 5 sale attempts; this cycle's ask has dropped $33k (8%) from the opening price — seller is motivated, your offer sets the floor, not the list.
- Current owner paid $135k; list at $386k implies a 186% gain — meaningful room to come down on a strong offer.
Risks & watch-outs
- Climate carrying-cost: major wind risk, 66% chance of damaging wind over 30y; extreme-heat days projected 7→16/yr by 2055 (HVAC capex compounding) — expect insurance premiums to compound above CPI over the hold.
Questions for the listing agent
- Can we see the unit-by-unit rent roll, current vacancy, and any below-market leases? What's the average tenancy length?
- What capital expenditures (roof, boiler, parking lot, exteriors) have been made in the last 5 years, and what's planned in the next 2?
- Built in 1965 — when were the roof, HVAC, electrical panel, plumbing, and water heater last replaced?
- Is there a deadline driving the sale (1031 exchange, divorce, estate, relocation)? That informs how much negotiation room exists.
- Crime grade is D in this area — have there been break-ins, vandalism, or insurance claims at this property in the last 3 years? What carrier currently insures it and at what premium?
- The area grade is low — what's the realistic commute time and amenity access for the typical tenant pool here? Any planned neighborhood developments (good or bad) we should know about?
- What's the average days-on-market for RENTAL listings here right now (not sales)? A rising rental-DOM trend means longer vacancies and softer asking-rent achievability than the comps imply.
- What's the recent tenant-quality profile in this submarket — average credit score on applications, eviction rate, late-payment / NSF rate, and stable-employment percentage? A property-management company in the area should have these aggregated.
- How much new apartment / multifamily construction is in the pipeline within 1–3 miles? Heavy new supply (>2% of stock underway) typically softens rents 12–24 months out; light construction supports rent growth.
Investment metrics
- 1% rule
- 0.94% ✗
- Cap rate
- 7.14%
- Cash-on-cash
- 3.01%
- DSCR
- 1.13
- GRM
- 8.8
CMA / ARV
No comps found within radius.
Projected returns pro-forma
-3.0% appreciation · 3.94% rent growth · sell at horizon
- IRR
- -10.5%
- Equity multiple
- 0.61×
- Total profit
- $-41,766
- Equity at exit
- $57,554
- IRR
- 0.1%
- Equity multiple
- 1.00×
- Total profit
- $493
- Equity at exit
- $33,374
Cash invested: $108,080 (down + closing). Projections, not guarantees.
Landlord ↔ Tenant lean methodology
- Overall (STATE)
- 90 Strongly Landlord-Friendly
- State South Carolina
- 90 Strongly Landlord-Friendly · R+6
- County
- — inherits STATE
- City
- — inherits STATE
ZIP-level market 29841
- Rents YoY
- 3.9%
- Active inventory
- 361
- Price-to-rent
- 17.7×
Monthly cashflow live
- Estimated rent
- $3,639 medium interval (Pro) →
- Mortgage (P&I)
- −$2,024
- Tax from tax record
- −$418 /mo · $5,019/yr
- Insurance
- −$161
- HOA
- −$0
- Vacancy / Maint / Mgmt
- −$764
- Net cashflow
- $272
Break-even live
2-unit breakdown (identical units grouped — click to expand)
| Units | Beds | Baths | Est. rent |
|---|---|---|---|
| 2× units | 4 | — | $3,638 |
| #1 | 4 | — | $1,819 |
| #2 | 4 | — | $1,819 |
| Total (2 units) | $3,639 | ||
UW: 25.0% down · 7.5% · 30yr · 1.5% tax · 5.0% vac · 8.0% maint · 8.0% mgmt
Financing live
Cash to close
- Down payment
- $96,500
- Closing costs
- $11,580
- Reserves months
- —
- Total cash needed
- —
Loan-product check · same deal, 3 products live
Conventional
25% down · 7.5% · 30yr
- Down + closing
- —
- Monthly P&I
- —
- Monthly cashflow
- —
- DSCR
- —
- Eligible?
- —
Personal DTI + credit; lowest rate.
DSCR
20% down · 8.5% · 30yr
- Down + closing
- —
- Monthly P&I
- —
- Monthly cashflow
- —
- DSCR
- —
- Eligible?
- —
No personal income docs; deal must DSCR.
Hard money
10% down · 12.0% · 12mo
- Down + closing
- —
- Monthly P&I
- —
- Monthly cashflow
- —
- DSCR
- —
- Eligible?
- —
Short-term bridge; refi at stabilization.
Listing history 22 events
-
2026-06-13statusdays on market $386,000 Pending 30 DOM
-
2026-06-10days on market $386,000 Active 29 DOM
-
2026-06-09days on market $386,000 Active 28 DOM
-
2026-06-08days on market $386,000 Active 27 DOM
-
2026-06-07days on market $386,000 Active 26 DOM
-
2026-06-03days on market $386,000 Active 22 DOM
-
2026-06-02days on market $386,000 Active 21 DOM
-
2026-06-01days on market $386,000 Active 20 DOM
-
2026-05-30days on market $386,000 Active 19 DOM
-
2026-05-12price $386,000
-
2026-05-11historical
-
2026-04-21price $409,000
-
2026-03-18$419,000 Active
-
2026-03-18$409,000 Active
-
2026-02-04status Active
-
2026-01-28status Pending
-
2026-01-28historical
-
2026-01-28historical
-
2025-09-30$419,000 Active
-
2025-09-30$419,000
-
2022-06-27soldstatus $135,000
-
2015-11-23soldstatus $68,500
ⓘ Source: listings_history table (triggers on properties + properties_extension) + one-shot
backfill from property_details.listing_events for pre-trigger history.
Tax reassessment forecast SC · Resets to sale price
- Current annual tax
- $5,019 · $418/mo
- Projected year-2 tax
- $5,019 · $418/mo
- Expected delta
- $0/yr ($0/mo · 0.0%)
ⓘ Screening estimate from a state-policy table — verify with the county assessor before closing.
Climate risk First Street
- Flood 1/10 Low FEMA zone X (unshaded) · 0% chance over 30 yrs
- Wildfire 4/10 Moderate
- Heat 7/10 Severe 7 d/yr ≥106°F today · 16 d/yr by 30 yrs out
- Wind 6/10 Major 66% chance of damaging wind over 30 yrs
- Air quality 3/10 Moderate 3 unhealthy d/yr today · 4 by 30 yrs out
Nearby sold comps map
Loading sold comps map…
Walkable amenities ~0.75 mi
Loading nearby amenities…
Taxation est. · year 1
- Rental income
- $43,668
- − Mortgage interest
- −$21,622
- − Property taxes
- −$5,019
- − Insurance
- −$1,930
- − Repairs & maintenance
- −$3,493
- − Management
- −$3,493
- − Depreciation
- −$11,229
- Taxable loss
- −$3,119
- Est. tax savings @ 24.0%
- +$748
- After-tax cash flow
- $4,007/yr
For passive investors: Depreciation is non-cash, so a rental often shows a tax loss while cash-flowing — sheltering income. Rental losses are passive: they offset passive income freely, and up to $25,000/yr can offset ordinary (W-2) income if you actively participate and your MAGI is under $100k (phasing out to $0 by $150k); unused losses carry forward. On sale, claimed depreciation is recaptured at up to 25%, and gains may owe capital-gains tax (a 1031 exchange can defer both). Figures are a year-1 estimate at your 24.0% rate — not tax advice; consult a CPA.
Schools (NCES district)
- District
- Aiken 01
- NCES district ID
- 4500720
- Math proficiency
- 31% ▼ -11.00%
- Reading proficiency
- 44% ▼ -1.00%
- Median HH income
- $45,081
- Composite
- 31.91/100
- National rank
- #5857
- State rank
- #36 of 80 in SC
Livability — Belvedere
- Score
- 60/100
- State rank
- #225
- US rank
- #18932
Category grades
Schools grade is shown separately in the Schools card above.
Census & demographics
- Census place
- Belvedere, SC
- County
- Aiken County · 116,534 people
- City population
- 32,409
- Metro
- Augusta-Richmond County, GA-SC
- Population (ZIP)
- 32,342
- Household income
- $71,606
- Rent vs Own
- Severe rent burden
- 870.0
Population outlook (Aiken County) Hauer SSP2
- Today (2025)
- 178,003 people
- By 2030
- 182,876 · +2.7%
- By 2040
- 189,970 · +6.7%
- By 2050
- 193,840 · +8.9%
- By 2075
- 199,453 · +12.1%
- By 2100
- 192,403 · +8.1%
Race, ethnicity, and origin ACS 2023
- Neighborhood character
- Predominantly White (71%)
- Race & ethnicity
- White 71% Black 17% Hispanic / Latino 7% Two or more races 7%
- Hispanic origin (detail)
- Puerto Rican 2%
- Common ancestry
- Italian 3% Lithuanian 3% Serbian 2%
- Foreign-born
- 3% · Canada, Guatemala, Jamaica
- Languages at home
- 93% English-only · Spanish 5% French/Haitian/Cajun 1% Other Asian/Pacific 1%
Political lean MEDSL · Aiken
- 2024 margin
- Strong R (+25.9) · D 36.4% · R 62.2% · Other 1.4%
- 2008→2024 swing
- -1.9pp toward R · 2008: -24.0pp · 2024: -25.9pp
- All cycles
- 2024: R+25.9 2020: R+22.7 2016: R+27.5 2012: R+26.0 2008: R+24.0
Not yet ingested
- Civics
- —
Market trends
- HPI YoY
- ▼ -180.37%
- Current HPI
- 237.1442
- Rent YoY
- ▲ 3.94%
- Metro
- Augusta-Richmond County, GA-SC
- State GDP YoY
- ▲ 4.51%
- F500 in state
- 2
Industry mix (Fortune 500 HQ in SC)
| Industry | F500 HQs | Revenue |
|---|---|---|
| Packaging | 1 | $7B |
|
||
Price history
+463.5% since first listed13 events — show timeline
- 2026-05-12 Price Changed $386,000 Hive MLS
- 2026-05-11 Listing Removed — Hive MLS
- 2026-04-21 Price Changed $409,000 Hive MLS
- 2026-03-18 Listed $419,000 Hive MLS
- 2026-03-18 Listed $409,000 Hive MLS
- 2026-02-04 Relisted — Hive MLS
- 2026-01-28 Pending — Hive MLS
- 2026-01-28 Listing Removed — Hive MLS
- 2026-01-28 Listing Removed — Hive MLS
- 2025-09-30 Listed $419,000 Hive MLS
- 2025-09-30 Listed $419,000 Hive MLS
- 2022-06-27 Sold (Public Records) $135,000 Public Records
- 2015-11-23 Sold (Public Records) $68,500 Public Records
Property tax history
+13.1%/yrLatest (2025): $5,019 · +8.1% YoY. Source: county tax records.
Cash-flow waterfall
monthlySold comps — $/sqft
last 12 mo · ≤1 miLoading sold comps…