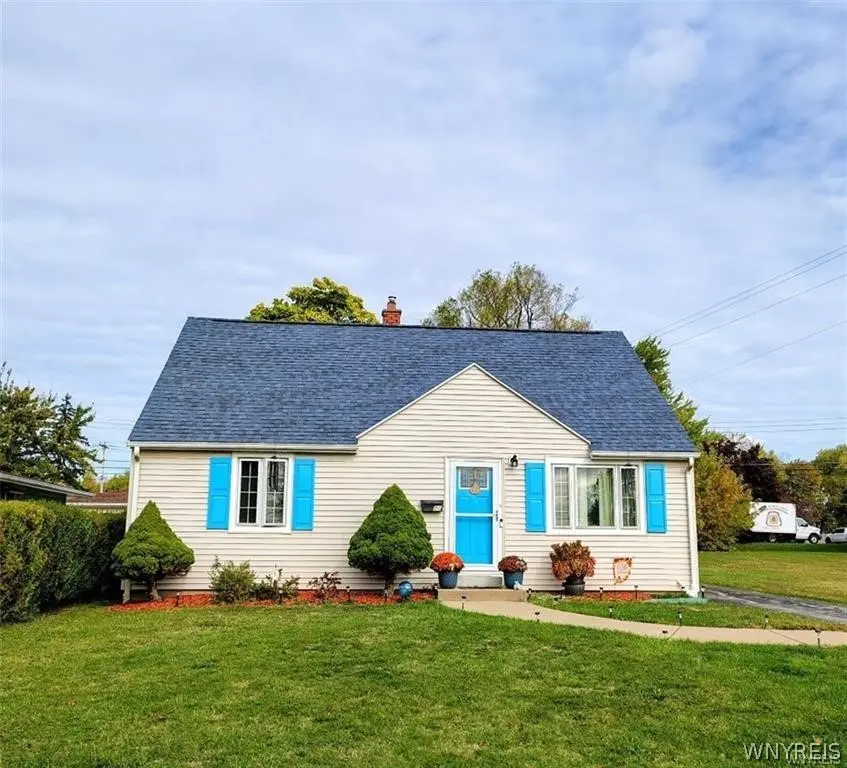
76 Sandra Dr · Cheektowaga, NY
Flood risk 1/10 · Minimal
- FEMA flood zone
- X (unshaded)
- Chance of flooding over 30 yrs
- 0.0%
- Est. flood insurance / yr
- $473 – $860
Fire risk 1/10 · Minimal
- Est. fire insurance / yr
- $691 – $1,283
Heat risk 3/10 · Minor
- Hot days now (above 94°F)
- 7 days/yr
- Hot days in 30 yrs
- 15 days/yr
Wind risk 1/10 · Minimal
- Chance of severe wind over 30 yrs
- —
Air-quality risk 3/10 · Minor
- Unhealthy air days now
- 2 days/yr
- Unhealthy air days in 30 yrs
- 3 days/yr
Risk factors via First Street. Map © Google.
Why this score? — see what drove the C- grade
The composite is a weighted blend of 9 inputs, each scored 0–100. Each bar is that input's sub-score; the figure is the points it added to the 100-point composite (weight × sub-score).
- Cash flow +14.7/30.0
- ARV discount +12.2/15.0
- Schools +5.9/10.0
- 1% rule +4.9/10.0
- DSCR +4.5/10.0
- Livability +4.2/5.0
- Rent growth +2.5/5.0
- Condition / age +2.5/5.0
- Appreciation +0.0/10.0
$228,900
🖨 Deal sheet 📄 Offer letter ✓ Due diligence
Listing remarks
This four-bedroom, one bath Cape Cod is located in the desirable Maryvale School District. With two bedrooms on the first floor, this home can "live like a ranch. " Updates include remodeled kitchen and bath and luxury vinyl plank flooring throughout most of the home. Stay cool in the summer with central air and mini-split units on the second floor. Soundproof windows ensure peace and quiet. There's plenty of curb appeal with maintenance free vinyl siding and re-shingled roof (2024.) A patio, one-and-a-half car garage and large yard with mature trees complete this Cheektowaga Charmer. Showings start May 17, 2026 and offers, if any, will be reviewed on May 27, 2026 at 5 PM.
Key facts
- Remodeled kitchen
- Soundproof windows
- Remodeled bath
Tags
Property features AI
Exterior
- Parking: Detached garage with electricity; Approximately 1.5 garage spaces
- Utilities: Public water (connected); Sewer connected
- Home design: Single-story residence (entry level listed as main); Vinyl siding; Asphalt roof; Poured foundation; Existing (resale) property
- Construction: Vinyl siding construction; Asphalt roof; Poured foundation; Year built: existing (no new construction)
- Exterior features: Blacktop driveway; Partial fencing; Patio; Near public transit; Rectangular residential lot (approx. 52 x 162)
Interior
- Kitchen: Eat-in kitchen; Solid surface counters; Appliances negotiable
- Bedrooms: Two main-level bedrooms; Two second-level bedrooms (one ~15 x 14, one ~14 x 12); First-level bedrooms include one ~14 x 11 and one ~10 x 10
- Flooring: Carpet; Luxury vinyl; Varies
- Bathrooms: One full bathroom (main level)
- Heating & cooling: Gas heating with forced air; Heat pump; Central air
- Interior features: Ceiling fan(s); Eat-in kitchen; Separate/formal living room; Solid surface counters; Bedroom on main level; Full basement with sump pump
- Laundry & utility: Laundry in basement; Gas water heater
Neighborhood map
What this means for you Summary
Snapshot
- This is a 4-bed/1.0-bath single-family listed at $229k.
Deal economics
- At list price, monthly cash flow is $60 ($715/yr) — positive.
- The deal already cash-flows at list — no discount required.
- To meet the 1% rule (rent ≥ 1% of price), the offer needs to be $227k (0.6% below list).
- Recommended offer: $225k (1.5% below list) — sets the bar for market timing.
- Cap rate 6.6% vs local median 3.8% in Cheektowaga — top-decile yield for the area; either an underpriced asset or a hidden risk that comps aren't pricing in. Stress-test before assuming the spread holds.
Location & tenants
- Location reads 84/100 on livability (#54 in NY, #811 nationally) — a professional / high-income tenant draw. Strengths: commute A+, housing A+, health & safety A+; Watch: crime C-.
- Cheektowaga-Maryvale Union Free School District (urban): math 67% / reading 73% proficiency, ranked #154 of 590 in NY (top 26%) — strong family-tenant draw, lease renewals of 3-5y typical.
- Market conditions: 207 active listings in the ZIP; 3 comparable units currently listed for rent nearby; rentals leasing fast (median 2d on market — plan ~1-2 weeks tenant-placement turnaround); 1,244 units permitted in Erie County in 2024 (563 in 5+ unit buildings).
- This rent runs 41% of the median local income ($67k/yr) — at the standard rent-burdened threshold; future hikes will face affordability resistance.
Forward outlook
- Local home prices are declining (-3.0%/yr); year-one equity from $2k of loan paydown is wiped out by about $7k of value loss. Plan a longer hold.
Negotiation context
- It's been on market 16 days — a 2% lower offer ($225k) is reasonable based on typical stale-listing flexibility.
- 4 sale attempts with the ask held roughly flat each time — persistent listings suggest the price (not the market) is what's stuck; bring a comps-based counter.
- Current owner paid $165k; 39% above their basis — modest negotiation headroom, anchor on the comps not their cost.
Risks & watch-outs
- Watch-outs: built in 1952 — expect roof / HVAC / electrical / plumbing capex.
Questions for the listing agent
- Built in 1952 — when were the roof, HVAC, electrical panel, plumbing, and water heater last replaced?
- Is there a deadline driving the sale (1031 exchange, divorce, estate, relocation)? That informs how much negotiation room exists.
- Schools are B-rated — typically a magnet for longer-tenancy family renters. What's the average tenant stay here, and is there a school-zone premium baked into asking?
- What's the average days-on-market for RENTAL listings here right now (not sales)? A rising rental-DOM trend means longer vacancies and softer asking-rent achievability than the comps imply.
- What's the recent tenant-quality profile in this submarket — average credit score on applications, eviction rate, late-payment / NSF rate, and stable-employment percentage? A property-management company in the area should have these aggregated.
- How much new for-sale + rental construction is in the pipeline within 1–3 miles? Heavy new supply typically softens prices + rents 12–24 months out; constrained supply supports both.
Investment metrics
- 1% rule
- 0.99% ✗
- Cap rate
- 6.61%
- Cash-on-cash
- 1.11%
- DSCR
- 1.05
- GRM
- 8.4
CMA / ARV
- ARV (median comp)
- $255,661
- List price
- $228,900
- Delta
- -10.47%
- Verdict
- UNDERPRICED
- Comps
- 20 within 1.0 mi
Show comp detail 12 sales within ~0.75 mi
| Address | Dist | Beds/Ba | Sqft | Sold | Price | $/sf | Match |
|---|---|---|---|---|---|---|---|
| 1005 Maryvale Dr | 0.29mi | 4/1.0 | 1,369 (+3%) | 4mo | $182,500 | $133 | 78 |
| 4273 Union Rd | 0.42mi | 4/1.5 | 1,302 (-2%) | 0mo | $245,000 | $188 | 75 |
| 63 Princeton Ct | 0.34mi | 3/1.5 (-1) | 1,272 (-4%) | 7mo | $233,500 | $184 | 64 |
| 76 Chardon Dr | 0.30mi | 4/1.0 | 1,500 (+13%) | 3mo | $256,000 | $171 | 62 |
| 191 Chapel Ave | 0.53mi | 4/1.0 | 1,263 (-5%) | 7mo | $235,000 | $186 | 62 |
| 15 Pleasant St | 0.45mi | 3/2.0 (-1) | 1,215 (-8%) | 2mo | $274,000 | $226 | 54 |
| 20 Colden Ct | 0.64mi | 3/1.5 (-1) | 1,273 (-4%) | 5mo | $179,000 | $141 | 53 |
| 77 Balbach Dr | 0.73mi | 3/2.0 (-1) | 1,290 (-3%) | 4mo | $250,000 | $194 | 49 |
| 43 Barone Cir | 0.64mi | 3/1.0 (-1) | 1,148 (-13%) | 1mo | $180,000 | $157 | 41 |
| 44 Pinevale Ct | 0.70mi | 3/2.0 (-1) | 1,472 (+11%) | 0mo | $309,000 | $210 | 40 |
| 70 Crandon Blvd | 0.70mi | 3/1.0 (-1) | 1,134 (-14%) | 3mo | $295,000 | $260 | 36 |
| 74 Harris Ct | 0.73mi | 3/2.0 (-1) | 1,132 (-15%) | 6mo | $239,000 | $211 | 28 |
Match score weights: distance 35% · size 25% · config 20% · recency 20%. Top-matched comps best support the ARV.
Projected returns pro-forma
-3.0% appreciation · 3.0% rent growth · sell at horizon
- IRR
- -14.5%
- Equity multiple
- 0.48×
- Total profit
- $-33,169
- Equity at exit
- $34,130
- IRR
- -5.6%
- Equity multiple
- 0.63×
- Total profit
- $-23,472
- Equity at exit
- $19,791
Cash invested: $64,092 (down + closing). Projections, not guarantees.
Landlord ↔ Tenant lean methodology
- Overall (STATE)
- 15 Strongly Tenant-Friendly
- State New York
- 15 Strongly Tenant-Friendly · D+10
- County
- — inherits STATE
- City
- — inherits STATE
ZIP-level market 14225
- Home prices YoY
- -27.3%
- Active inventory
- 207
- Price-to-rent
- 8.4×
Monthly cashflow live
- Estimated rent
- $2,275 medium interval (Pro) →
- Mortgage (P&I)
- −$1,200
- Tax from tax record
- −$442 /mo · $5,300/yr
- Insurance
- −$95
- HOA
- −$0
- Vacancy / Maint / Mgmt
- −$478
- Net cashflow
- $60
Break-even live
UW: 25.0% down · 7.5% · 30yr · 1.5% tax · 5.0% vac · 8.0% maint · 8.0% mgmt
Financing live
Cash to close
- Down payment
- $57,225
- Closing costs
- $6,867
- Reserves months
- —
- Total cash needed
- —
Loan-product check · same deal, 3 products live
Conventional
25% down · 7.5% · 30yr
- Down + closing
- —
- Monthly P&I
- —
- Monthly cashflow
- —
- DSCR
- —
- Eligible?
- —
Personal DTI + credit; lowest rate.
DSCR
20% down · 8.5% · 30yr
- Down + closing
- —
- Monthly P&I
- —
- Monthly cashflow
- —
- DSCR
- —
- Eligible?
- —
No personal income docs; deal must DSCR.
Hard money
10% down · 12.0% · 12mo
- Down + closing
- —
- Monthly P&I
- —
- Monthly cashflow
- —
- DSCR
- —
- Eligible?
- —
Short-term bridge; refi at stabilization.
Rent comps 3 comps
| Address | Beds | Baths | Sqft | Rent | $/sqft | DOM | Units | Dist |
|---|---|---|---|---|---|---|---|---|
| 1328 Cleveland Dr Buffalo, NY | 3.0 | 1.0 | 1020 | $2,200 | $2.16 | 1d | 1 | 0.77mi |
| 419 Cherokee Dr Buffalo, NY | 3.0 | 1.0 | 880 | $1,800 | $2.05 | 1d | 1 | 1.07mi |
| 239 Lehn Springs Dr Buffalo, NY | 3.0 | 1.0 | 1700 | $3,200 | $1.88 | 2d | 1 | 1.42mi |
Listing history 9 events
-
2026-05-13$228,900 Active 691-char remark
-
2025-11-03$224,900 Active
-
2025-10-24historical
-
2025-10-20historical
-
2025-10-17$224,900 Active
-
2025-05-27$229,900 Active
-
2022-08-18soldstatus $165,000
-
2006-09-22soldstatus $80,000
-
1998-06-01soldstatus $65,000
ⓘ Source: listings_history table (triggers on properties + properties_extension) + one-shot
backfill from property_details.listing_events for pre-trigger history.
Tax reassessment forecast NY · Partial reset (capped growth)
- Current annual tax
- $5,300 · $442/mo
- Projected year-2 tax
- $5,300 · $442/mo
- Expected delta
- $0/yr ($0/mo · 0.0%)
ⓘ Screening estimate from a state-policy table — verify with the county assessor before closing.
Climate risk First Street
- Flood 1/10 Low FEMA zone X (unshaded) · 0% chance over 30 yrs
- Wildfire 1/10 Low
- Heat 3/10 Moderate 7 d/yr ≥94°F today · 15 d/yr by 30 yrs out
- Wind 1/10 Low
- Air quality 3/10 Moderate 2 unhealthy d/yr today · 3 by 30 yrs out
Nearby sold comps map
Loading sold comps map…
Walkable amenities ~0.75 mi
Loading nearby amenities…
Taxation est. · year 1
- Rental income
- $27,296
- − Mortgage interest
- −$12,822
- − Property taxes
- −$5,300
- − Insurance
- −$1,144
- − Repairs & maintenance
- −$2,184
- − Management
- −$2,184
- − Depreciation
- −$6,659
- Taxable loss
- −$2,997
- Est. tax savings @ 24.0%
- +$719
- After-tax cash flow
- $1,434/yr
For passive investors: Depreciation is non-cash, so a rental often shows a tax loss while cash-flowing — sheltering income. Rental losses are passive: they offset passive income freely, and up to $25,000/yr can offset ordinary (W-2) income if you actively participate and your MAGI is under $100k (phasing out to $0 by $150k); unused losses carry forward. On sale, claimed depreciation is recaptured at up to 25%, and gains may owe capital-gains tax (a 1031 exchange can defer both). Figures are a year-1 estimate at your 24.0% rate — not tax advice; consult a CPA.
Schools (NCES district)
- District
- Cheektowaga-Maryvale Union Free School District
- NCES district ID
- 3618600
- Math proficiency
- 67% ▲ 11.00%
- Reading proficiency
- 73% ▲ 23.00%
- Median HH income
- $46,537
- Composite
- 59.02/100
- National rank
- #960
- State rank
- #154 of 590 in NY
Livability — Cheektowaga
- Score
- 84/100
- State rank
- #54
- US rank
- #811
Category grades
Schools grade is shown separately in the Schools card above.
Census & demographics
- Census place
- Cheektowaga, NY
- County
- Erie County · 714,559 people
- City population
- 55,470
- Metro
- Buffalo-Cheektowaga, NY
- Population (ZIP)
- 33,620
- Household income
- $67,237
- Rent vs Own
- Severe rent burden
- 991.0
Population outlook (Erie County) Hauer SSP2
- Today (2025)
- 933,037 people
- By 2030
- 935,181 · +0.2%
- By 2040
- 928,531 · -0.5%
- By 2050
- 905,725 · -2.9%
- By 2075
- 834,037 · -10.6%
- By 2100
- 708,033 · -24.1%
Race, ethnicity, and origin ACS 2023
- Neighborhood character
- Predominantly White (74%)
- Race & ethnicity
- White 74% Black 13% Two or more races 7% Hispanic / Latino 4% Asian 3%
- Common ancestry
- Romanian 21% Lithuanian 3% Iranian 1%
- Foreign-born
- 6% · Canada, Vietnam
- Languages at home
- 92% English-only · Other Indo-European 2% Spanish 2% Arabic 1%
Political lean MEDSL · Erie
- 2024 margin
- Lean D (+9.7) · D 54.8% · R 45.2%
- 2008→2024 swing
- -7.9pp toward R · 2008: 17.5pp · 2024: 9.7pp
- All cycles
- 2024: D+9.7 2020: D+14.7 2016: D+4.8 2012: D+15.6 2008: D+17.5
Not yet ingested
- Civics
- —
Market trends
- HPI YoY
- ▼ -120.26%
- Current HPI
- 320.6248
- Rent YoY
- —
- Metro
- Buffalo-Cheektowaga, NY
- State GDP YoY
- ▲ 2.60%
- F500 in state
- 92
Industry mix (Fortune 500 HQ in NY)
| Industry | F500 HQs | Revenue |
|---|---|---|
| Financial Services | 10 | $950B |
|
||
| Consumer Goods | 9 | $162B |
|
||
| Insurance | 4 | $225B |
|
||
| Telecommunications | 2 | $144B |
|
||
| Pharmaceuticals | 2 | $112B |
|
||
| Media / Entertainment | 2 | $69B |
|
||
Price history
+252.2% since first listed10 events — show timeline
- 2026-05-29 Pending — WNYREIS
- 2026-05-13 Listed $228,900 WNYREIS
- 2025-11-03 Listed $224,900 WNYREIS
- 2025-10-24 Listing Removed — WNYREIS
- 2025-10-20 Listing Removed — WNYREIS
- 2025-10-17 Listed $224,900 WNYREIS
- 2025-05-27 Listed $229,900 WNYREIS
- 2022-08-18 Sold (Public Records) $165,000 Public Records
- 2006-09-22 Sold (Public Records) $80,000 Public Records
- 1998-06-01 Sold (Public Records) $65,000 Public Records
Property tax history
+4.6%/yrLatest (2025): $5,300 · +2.0% YoY. Source: county tax records.
Cash-flow waterfall
monthlySold comps — $/sqft
last 12 mo · ≤1 miLoading sold comps…