6705 NW 29th Ct · Margate, FL
Flood risk 1/10 · Minimal
- FEMA flood zone
- X (unshaded)
- Chance of flooding over 30 yrs
- 0.0%
- Est. flood insurance / yr
- $507 – $1,088
Fire risk 1/10 · Minimal
- Est. fire insurance / yr
- $947 – $1,759
Heat risk 9/10 · Severe
- Hot days now (above 106°F)
- 7 days/yr
- Hot days in 30 yrs
- 26 days/yr
Wind risk 10/10 · Severe
- Chance of severe wind over 30 yrs
- 99.0%
Air-quality risk 3/10 · Minor
- Unhealthy air days now
- 2 days/yr
- Unhealthy air days in 30 yrs
- 3 days/yr
Risk factors via First Street. Map © Google.
Why this score? — see what drove the B grade
The composite is a weighted blend of 9 inputs, each scored 0–100. Each bar is that input's sub-score; the figure is the points it added to the 100-point composite (weight × sub-score).
- Cash flow +30.0/30.0
- 1% rule +10.0/10.0
- DSCR +10.0/10.0
- ARV discount +7.5/15.0
- Schools +4.1/10.0
- Livability +4.0/5.0
- Condition / age +3.8/5.0
- Rent growth +3.0/5.0
- Appreciation +0.0/10.0
$70,000
🖨 Deal sheet 📄 Offer letter ✓ Due diligence
Listing remarks
NEW OPPORTUNITY IN MARGATE ?? 6705 NW 29th Court, Margate, FL 33063 ?? Coral Cay Plantation Beautiful Mobile Home in a 55+ Community 2 Bedrooms / 2 Bathrooms Separate 1 Bedroom / 1 Bathroom Efficiency Apartment Parking for 2 Vehicles ONLY $70,000 ?? Available for Cash or Financing ?? Open to Offers! Enjoy a beautiful, peaceful community with outstanding amenities ?? Clubhouse ?? Swimming Pool ?? Gated Security ?? Comfortable and Safe Environment An excellent opportunity to enjoy comfortable living in South Florida. ?? For more information or to schedule a showing: Lisandra Perez West Williams Realty ?? 561-679-0146
Key facts
- Clubhouse
- Gated security
- Swimming pool
Tags
Neighborhood map
What this means for you Summary
Snapshot
- This is a 2-bed/2.0-bath other listed at $70k. Condition is rated good.
Deal economics
- At list price, monthly cash flow is $2k ($21k/yr) — positive.
- The deal already cash-flows at list — no discount required.
- Meets the 1% rule at list price ($3k rent vs $70k).
- Cap rate 36.5% vs local median 4.3% in Margate — top-decile yield for the area; either an underpriced asset or a hidden risk that comps aren't pricing in. Stress-test before assuming the spread holds.
Location & tenants
- Location reads 81/100 on livability (#85 in FL, #1,398 nationally) — a professional / high-income tenant draw. Strengths: commute A+, housing A+, health & safety A+; Watch: amenities F.
- Broward (suburban): math 42% / reading 53% proficiency, ranked #46 of 73 in FL (top 63%) — families likely to look elsewhere, expect single-tenant / working-renter base with shorter leases.
- Market conditions: Rents rising (+1.9%/yr); 548 active listings in the ZIP; 40 comparable units currently listed for rent nearby; rentals at typical pace (median 17d on market — plan ~3-4 weeks tenant-placement turnaround); 2,111 units permitted in Broward County in 2024 (1,265 in 5+ unit buildings).
- At $2,842/mo this rent would consume 54% of the median local household income ($63k/yr) (locally 2290% of renters already pay >50% of income on rent) — very limited rent-growth headroom before tenants either downsize or default.
Forward outlook
- Local home prices are declining (-3.0%/yr); year-one equity from $484 of loan paydown is wiped out by about $2k of value loss. Plan a longer hold.
- Broward County population projected at +34% by 2050 — long-run rental-demand tailwind backs the buy-and-hold thesis.
- At projected returns (-3.0% appreciation + 1.9% rent growth), your $20k cash investment doubles in ~2 years — after that, you're playing with house money.
Negotiation context
- Only 9 days on market — expect competitive offers; lowballing is unlikely to land.
Risks & watch-outs
- Climate carrying-cost: severe wind risk, 99% chance of damaging wind over 30y; extreme-heat days projected 7→26/yr by 2055 (HVAC capex compounding) — expect insurance premiums to compound above CPI over the hold.
Questions for the listing agent
- Built in 1979 — when were the roof, HVAC, electrical panel, plumbing, and water heater last replaced?
- Is there a deadline driving the sale (1031 exchange, divorce, estate, relocation)? That informs how much negotiation room exists.
- What's the average days-on-market for RENTAL listings here right now (not sales)? A rising rental-DOM trend means longer vacancies and softer asking-rent achievability than the comps imply.
- What's the recent tenant-quality profile in this submarket — average credit score on applications, eviction rate, late-payment / NSF rate, and stable-employment percentage? A property-management company in the area should have these aggregated.
- How much new for-sale + rental construction is in the pipeline within 1–3 miles? Heavy new supply typically softens prices + rents 12–24 months out; constrained supply supports both.
Investment metrics
- 1% rule
- 4.06% ✓
- Cap rate
- 36.49%
- Cash-on-cash
- 107.84%
- DSCR
- 5.80
- GRM
- 2.1
CMA / ARV
No comps found within radius.
Projected returns pro-forma
-3.0% appreciation · 1.94% rent growth · sell at horizon
- IRR
- —
- Equity multiple
- 5.99×
- Total profit
- $97,887
- Equity at exit
- $10,437
- IRR
- —
- Equity multiple
- 12.11×
- Total profit
- $217,822
- Equity at exit
- $6,052
Cash invested: $19,600 (down + closing). Projections, not guarantees.
Landlord ↔ Tenant lean methodology
- Overall (STATE)
- 87 Strongly Landlord-Friendly
- State Florida
- 87 Strongly Landlord-Friendly · R+3
- County
- — inherits STATE
- City
- — inherits STATE
ZIP-level market 33063
- Home prices YoY
- -18.1%
- Rents YoY
- 1.9%
- Active inventory
- 548
- Price-to-rent
- 2.1×
Monthly cashflow live
- Estimated rent
- $2,842 high interval (Pro) →
- Mortgage (P&I)
- −$367
- Tax est. 1.5%
- −$88 /mo · $1,050/yr
- Insurance
- −$29
- HOA
- −$0
- Vacancy / Maint / Mgmt
- −$597
- Net cashflow
- $1,761
Break-even live
UW: 25.0% down · 7.5% · 30yr · 1.5% tax · 5.0% vac · 8.0% maint · 8.0% mgmt
Financing live
Cash to close
- Down payment
- $17,500
- Closing costs
- $2,100
- Reserves months
- —
- Total cash needed
- —
Loan-product check · same deal, 3 products live
Conventional
25% down · 7.5% · 30yr
- Down + closing
- —
- Monthly P&I
- —
- Monthly cashflow
- —
- DSCR
- —
- Eligible?
- —
Personal DTI + credit; lowest rate.
DSCR
20% down · 8.5% · 30yr
- Down + closing
- —
- Monthly P&I
- —
- Monthly cashflow
- —
- DSCR
- —
- Eligible?
- —
No personal income docs; deal must DSCR.
Hard money
10% down · 12.0% · 12mo
- Down + closing
- —
- Monthly P&I
- —
- Monthly cashflow
- —
- DSCR
- —
- Eligible?
- —
Short-term bridge; refi at stabilization.
Rent comps 40 comps
| Address | Beds | Baths | Sqft | Rent | $/sqft | DOM | Units | Dist |
|---|---|---|---|---|---|---|---|---|
| 6631 Winfield Blvd Unit 3-6 Margate, FL | 3.0 | 2.5 | 1190 | $2,500 | $2.10 | 10d | 1 | 0.17mi |
| 6621 Winfield Blvd #1 Margate, FL | 2.0 | 2.5 | 1190 | $2,250 | $1.89 | 24d | 1 | 0.26mi |
| 3085 Lighthouse Pl Margate, FL | 3.0 | 2.0 | 1405 | $3,111 | $2.21 | 7d | 1 | 0.27mi |
| 6617 Winfield Blvd Unit 4-1 Margate, FL | 1.0 | 1.5 | 1190 | $1,350 | $1.13 | 24d | 1 | 0.30mi |
| 6952 NW 27th Ct Unit 6952 Margate, FL | 3.0 | 2.0 | 1824 | $4,100 | $2.25 | 16d | 1 | 0.37mi |
| 3266 W Buena Vista Dr Unit NA Margate, FL | 3.0 | 3.0 | 1500 | $3,300 | $2.20 | 24d | 1 | 0.45mi |
| 2701 N Rock Island Rd Margate, FL | 2.0 | 2.0 | 1157 | $2,334 | $2.02 | 2d | 1 | 0.47mi |
| 2701 N Rock Island Rd Margate, FL | 3.0 | 2.0 | 1270 | $3,487 | $2.75 | 19d | 1 | 0.47mi |
| 2919 Crestwood Ter #5103 Margate, FL | 3.0 | 2.5 | 1776 | $2,995 | $1.69 | 17d | 1 | 0.48mi |
| 2941 Crestwood Ter #7204 Margate, FL | 1.0 | 1.0 | 1417 | $1,000 | $0.71 | 24d | 1 | 0.48mi |
| 2925 Crestwood Ter Margate, FL | 3.0 | 2.0 | 1417 | $2,875 | $2.03 | 14d | 1 | 0.48mi |
| 2615 NW 62nd Ave Unit 2615 Margate, FL | 3.0 | 2.0 | 1349 | $3,500 | $2.59 | 24d | 1 | 0.59mi |
| 6878 NW 33rd St Unit 6878 Margate, FL | 3.0 | 2.5 | 1983 | $3,995 | $2.01 | 24d | 1 | 0.60mi |
| 6928 NW 33rd St Unit 6928 Margate, FL | 2.0 | 2.0 | 1636 | $3,700 | $2.26 | 24d | 1 | 0.60mi |
| 6920 W Sample Rd Unit 6920 Margate, FL | 3.0 | 2.5 | 1450 | $2,995 | $2.07 | 24d | 1 | 0.61mi |
| 6966 W Sample Rd #6966 Coral Springs, FL | 3.0 | 2.5 | 1450 | $2,650 | $1.83 | 7d | 1 | 0.64mi |
| 6178 Buena Vista Dr Unit 6178 Margate, FL | 3.0 | 2.0 | 1248 | $3,200 | $2.56 | 3d | 1 | 0.67mi |
| 3495 Pinewalk Dr N Margate, FL | 2.0 | 2.0 | 1176 | $2,625 | $2.23 | 13d | 1 | 0.68mi |
| 3495 Pinewalk Dr N Margate, FL | 2.0 | 2.0 | 1320 | $2,675 | $2.03 | 24d | 1 | 0.68mi |
| 6942 W Sample Rd #6942 Coral Springs, FL | 2.0 | 2.5 | 1203 | $2,400 | $2.00 | 5d | 1 | 0.70mi |
| 6942 W Sample Rd Coral Springs, FL | 2.0 | 1.0 | 1203 | $2,400 | $2.00 | 7d | 1 | 0.70mi |
| 3332 Orinoco Ln Unit 3332 Margate, FL | 3.0 | 2.5 | 1808 | $3,200 | $1.77 | 7d | 1 | 0.72mi |
| 3332 Orinoco Ln Unit 3332 Margate, FL | 3.0 | 2.5 | 1808 | $3,200 | $1.77 | 13d | 1 | 0.72mi |
| 6650 Royal Palm Blvd Unit 315C Margate, FL | 2.0 | 2.0 | 1100 | $1,800 | $1.64 | 24d | 1 | 0.75mi |
| 3436 Orinoco Ln Unit 3436 Margate, FL | 3.0 | 2.0 | 1450 | $3,200 | $2.21 | 24d | 1 | 0.78mi |
| 6473 NW 20th St Margate, FL | 3.0 | 2.0 | 1704 | $3,200 | $1.88 | 24d | 1 | 0.79mi |
| 3050 Toscana Ln W Margate, FL | 1.0–3.0 | 1.0–2.0 | 1075 | $2,570 | $2.39 | 2d | 1 | 0.81mi |
| 2171 NW 76th Ave Margate, FL | 3.0 | 2.0 | 2236 | $3,850 | $1.72 | 24d | 1 | 0.82mi |
| 5755 Winfield Blvd Margate, FL | 2.0 | 1.0 | 1200 | $2,200 | $1.83 | 7d | 1 | 0.85mi |
| 7618 Pinewalk Dr S #132 Margate, FL | 3.0 | 2.0 | 1395 | $3,400 | $2.44 | 14d | 1 | 0.87mi |
| 6955 NW 18th St Margate, FL | 3.0 | 2.0 | 1938 | $4,000 | $2.06 | 24d | 1 | 0.88mi |
| 2001 Barcelona Ter Margate, FL | 3.0 | 2.5 | 1685 | $4,500 | $2.67 | 24d | 1 | 0.89mi |
| 2001 Barcelona Ter Unit 2001 Margate, FL | 3.0 | 2.5 | 1685 | $3,900 | $2.31 | 24d | 1 | 0.89mi |
| 2001 Barcelona Ter Unit 2001 Margate, FL | 3.0 | 2.5 | 1685 | $3,990 | $2.37 | 14d | 1 | 0.89mi |
| 3600 Terrapin Ln Coral Springs, FL | 2.0 | 1.0–2.0 | 870 | $2,576 | $2.96 | 1d | 18 | 0.96mi |
| 6106 NW 20th St Unit 1524073P Margate, FL | 3.0 | 2.0 | 1506 | $7,982 | $5.30 | 1d | 1 | 0.97mi |
| 3370 NW 78th Ave Margate, FL | 3.0 | 2.0 | 1678 | $3,050 | $1.82 | 16d | 1 | 0.99mi |
| 1585 NW 70th Ln Margate, FL | 2.0 | 2.5 | 1834 | $900 | $0.49 | 14d | 1 | 1.00mi |
| 3701 Turtle Run Blvd Coral Springs, FL | 1.0–3.0 | 1.0–2.0 | 1120 | $2,344 | $2.09 | 21d | 1 | 1.02mi |
| 1550 NW 70th Ter Margate, FL | 3.0 | 2.0 | 1587 | $2,595 | $1.64 | 21d | 1 | 1.03mi |
Listing history 7 events
-
2026-06-18days on market $70,000 Active 9 DOM
-
2026-06-17days on market $70,000 Active 8 DOM
-
2026-06-16days on market $70,000 Active 7 DOM
-
2026-06-15days on market $70,000 Active 6 DOM
-
2026-06-13days on market $70,000 Active 4 DOM
-
2026-06-10remarks 638-char remark
-
2026-06-10$70,000 Active 1 DOM
ⓘ Source: listings_history table (triggers on properties + properties_extension) + one-shot
backfill from property_details.listing_events for pre-trigger history.
Climate risk First Street
- Flood 1/10 Low FEMA zone X (unshaded) · 0% chance over 30 yrs
- Wildfire 1/10 Low
- Heat 9/10 Extreme 7 d/yr ≥106°F today · 26 d/yr by 30 yrs out
- Wind 10/10 Extreme 99% chance of damaging wind over 30 yrs
- Air quality 3/10 Moderate 2 unhealthy d/yr today · 3 by 30 yrs out
Nearby sold comps map
Loading sold comps map…
Walkable amenities ~0.75 mi
Loading nearby amenities…
Taxation est. · year 1
- Rental income
- $34,104
- − Mortgage interest
- −$3,921
- − Property taxes
- −$1,050
- − Insurance
- −$350
- − Repairs & maintenance
- −$2,728
- − Management
- −$2,728
- − Depreciation
- −$2,036
- Taxable income
- $21,290
- Est. tax owed @ 24.0%
- −$5,110
- After-tax cash flow
- $16,028/yr
For passive investors: Depreciation is non-cash, so a rental often shows a tax loss while cash-flowing — sheltering income. Rental losses are passive: they offset passive income freely, and up to $25,000/yr can offset ordinary (W-2) income if you actively participate and your MAGI is under $100k (phasing out to $0 by $150k); unused losses carry forward. On sale, claimed depreciation is recaptured at up to 25%, and gains may owe capital-gains tax (a 1031 exchange can defer both). Figures are a year-1 estimate at your 24.0% rate — not tax advice; consult a CPA.
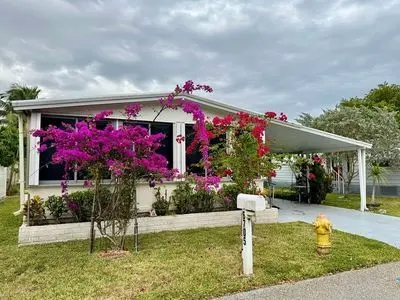
Condition & rehab AI · 1 photo
This mobile home in Margate, FL is in good condition with a well-maintained exterior and interior. It offers a great opportunity for a cosmetic renovation to enhance its resale and rental value.
Value-add opportunities
- Both Painting exterior and interior walls — Fresh paint enhances curb appeal and interior aesthetics.
- Both Landscaping improvements — Enhances curb appeal and adds value to the property.
- Both New flooring — Fresh flooring improves the overall look and feel of the home.
- Both New kitchen appliances — Modern appliances can attract more buyers and renters.
- Both New bathroom fixtures — Upgraded fixtures can increase the home's appeal and value.
- Both HVAC system upgrade — A new HVAC system can improve comfort and energy efficiency, attracting more buyers and renters.
- Both Landscaping and curb appeal — Enhances the home's curb appeal and adds value to the property.
Renovation cost estimate screening
Value-add ROI direction
- Both Painting exterior and interior walls — Fresh paint enhances curb appeal and interior aesthetics. ↑
- Both Landscaping improvements — Enhances curb appeal and adds value to the property. ↑
- Both New flooring — Fresh flooring improves the overall look and feel of the home. ↑
- Both New kitchen appliances — Modern appliances can attract more buyers and renters. ↑
- Both New bathroom fixtures — Upgraded fixtures can increase the home's appeal and value. ↑
- Both HVAC system upgrade — A new HVAC system can improve comfort and energy efficiency, attracting more buyers and renters. ↑
- Both Landscaping and curb appeal — Enhances the home's curb appeal and adds value to the property. ↑
ⓘ Cost ranges are severity-bucket heuristics (US national rule-of-thumb). Get contractor quotes + a written scope before underwriting a rehab budget.
Schools (NCES district)
- District
- Broward
- NCES district ID
- 1200180
- Math proficiency
- 42% ▼ -18.00%
- Reading proficiency
- 53% ▼ -5.00%
- Median HH income
- $52,139
- Composite
- 40.88/100
- National rank
- #3621
- State rank
- #46 of 73 in FL
Livability — Margate
- Score
- 81/100
- State rank
- #85
- US rank
- #1398
Category grades
Schools grade is shown separately in the Schools card above.
Census & demographics
- Census place
- Margate, FL
- County
- Broward County · 1,963,430 people
- City population
- 55,466
- Metro
- Miami-Fort Lauderdale-Pompano Beach, FL
- Population (ZIP)
- 55,466
- Household income
- $62,918
- Rent vs Own
- Severe rent burden
- 2290.0
Population outlook (Broward County) Hauer SSP2
- Today (2025)
- 2,207,033 people
- By 2030
- 2,360,704 · +7.0%
- By 2040
- 2,661,208 · +20.6%
- By 2050
- 2,946,698 · +33.5%
- By 2075
- 3,602,273 · +63.2%
- By 2100
- 3,970,984 · +79.9%
Race, ethnicity, and origin ACS 2023
- Neighborhood character
- Highly diverse neighborhood (Simpson 0.72)
- Race & ethnicity
- White 34% Hispanic / Latino 29% Black 28% Two or more races 18% Asian 4%
- Hispanic origin (detail)
- Mexican 2% Puerto Rican 7% Cuban 3% Dominican 3%
- Common ancestry
- Hispanic 6% Romanian 2% Estonian 2%
- Foreign-born
- 36% · Canada, Jamaica, Vietnam
- Languages at home
- 61% English-only · Spanish 24% French/Haitian/Cajun 7% Other Indo-European 4%
Political lean MEDSL · Broward
- 2024 margin
- D (+17.0) · D 58.0% · R 41.0%
- 2008→2024 swing
- -17.8pp toward R · 2008: 34.7pp · 2024: 17.0pp
- All cycles
- 2024: D+17.0 2020: D+29.8 2016: D+35.0 2012: D+34.9 2008: D+34.7
Not yet ingested
- Civics
- —
Market trends
- HPI YoY
- ▼ -87.17%
- Current HPI
- 393.9225
- Rent YoY
- ▲ 1.94%
- Metro
- Miami-Fort Lauderdale-Pompano Beach, FL
- State GDP YoY
- ▲ 3.28%
- F500 in state
- 36
Industry mix (Fortune 500 HQ in FL)
| Industry | F500 HQs | Revenue |
|---|---|---|
| Industrial Technology | 2 | $29B |
|
||
| Insurance | 2 | $17B |
|
||
| Retail | 1 | $60B |
|
||
| Technology Distribution | 1 | $58B |
|
||
| Homebuilding | 1 | $35B |
|
||
| Technology Manufacturing | 1 | $35B |
|
||
Price history
1 event — show timeline
- 2026-06-10 Listed $70,000 FSBO.com
Cash-flow waterfall
monthlySold comps — $/sqft
last 12 mo · ≤1 miLoading sold comps…