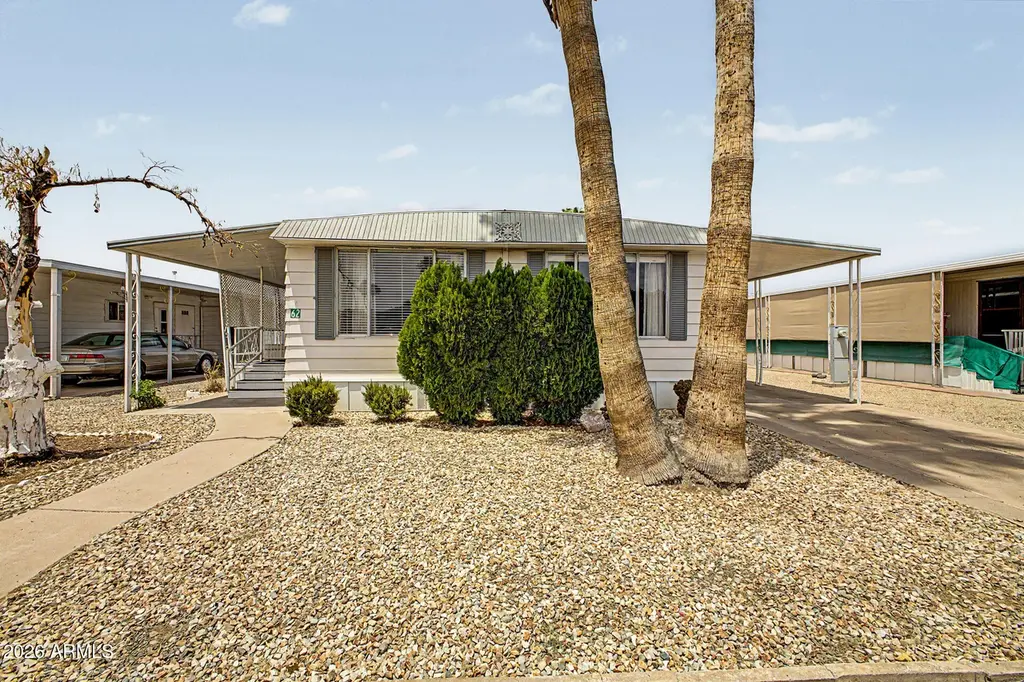
2650 W Union Hills Dr #62 · Phoenix, AZ
Flood risk 1/10 · Minimal
- FEMA flood zone
- X (shaded)
- Chance of flooding over 30 yrs
- 0.0%
- Est. flood insurance / yr
- $507 – $1,088
Fire risk 1/10 · Minimal
- Est. fire insurance / yr
- $610 – $1,132
Heat risk 8/10 · Major
- Hot days now (above 111°F)
- 5 days/yr
- Hot days in 30 yrs
- 13 days/yr
Wind risk 1/10 · Minimal
- Chance of severe wind over 30 yrs
- —
Air-quality risk 3/10 · Minor
- Unhealthy air days now
- 2 days/yr
- Unhealthy air days in 30 yrs
- 3 days/yr
Risk factors via First Street. Map © Google.
Why this score? — see what drove the C- grade
The composite is a weighted blend of 9 inputs, each scored 0–100. Each bar is that input's sub-score; the figure is the points it added to the 100-point composite (weight × sub-score).
- Cash flow +15.0/30.0
- ARV discount +15.0/15.0
- 1% rule +5.0/10.0
- DSCR +5.0/10.0
- Schools +4.7/10.0
- Livability +3.8/5.0
- Condition / age +2.2/5.0
- Rent growth +1.8/5.0
- Appreciation +0.0/10.0
$39,000
🖨 Deal sheet (PDF) 📄 Offer letter ✓ Due diligence
Listing remarks
BEST DEAL in PARK. Check out this adorable manufactured home in the 55+ Friendly Village of Orangewood! Inside, you'll find an inviting layout featuring wood-look flooring, tons of natural light, and an earthy palette that creates a warm and welcoming ambiance throughout. Separate family/living rooms for added privacy and comfort. The kitchen displays crisp white cabinetry, spacious counters, and built-in appliances for a seamless cooking experience. Get a good night's sleep in the main suite, complete with a bathroom with double sinks and a walk-in closet for easy organization. Inside laundry room with attached cabinets for extra storage. Out back, you can enjoy your morning coffee under t
Key facts
- Wood look flooring
- Shed for storage
- Covered patio
Tags
Property features AI
Finance
- Other: Directions: From I-17, head west to Union Hills Dr, turn right onto N Village Pkwy, turn left onto W Country Clb Dr. Property will be on the left.
- HOA & community: No association fees; Land lease of $982 monthly; Community pool; Community spa; Golf access; Near bus stop; Biking/walking paths
Exterior
- Parking: 2 covered spaces; 1 open parking space; 2 carport spaces
- Security: Gated community
- Utilities: City water; Public sewer
- Home design: Manufactured/mobile home; Leasehold ownership; City view
- Construction: Vinyl siding; Panelized construction; Metal roof; Building area reported by owner
- Exterior features: Storage; Shed(s); Desert front and back landscaping; Gravel/stone front and back; Private maintained road; Asphalt road surface
Interior
- Kitchen: Laminate counters; Multiple ovens; Refrigerator; Dishwasher; Disposal
- Bedrooms: 2 possible bedrooms
- Flooring: Vinyl
- Bathrooms: 2 full bathrooms
- Heating & cooling: Heating present; Central air; Ceiling fans
- Interior features: High-speed internet; Double vanity in bathroom; Breakfast bar; No interior steps; 3/4 bath in master bedroom; Bath lever faucets (accessibility)
- Laundry & utility: Laundry inside
Neighborhood map
What this means for you Summary
Snapshot
- This is a 2-bed/2.0-bath manufactured listed at $39k. Condition is rated fair.
Deal economics
- At list price, monthly cash flow is $1k ($13k/yr) — positive.
- The deal already cash-flows at list — no discount required.
- Meets the 1% rule at list price ($2k rent vs $39k).
- Recommended offer: $38k (1.5% below list) — sets the bar for market timing.
- Cap rate 40.9% vs local median 3.3% in Phoenix — top-decile yield for the area; either an underpriced asset or a hidden risk that comps aren't pricing in. Stress-test before assuming the spread holds.
Location & tenants
- Location reads 75/100 on livability (#16 in AZ, #3,924 nationally) — a middle-class / working-renter tenant base. Strengths: amenities A+, commute A+, housing A+; Watch: health & safety C-, crime F.
- Deer Valley Unified District (4246) (urban): math 50% / reading 55% proficiency, ranked #33 of 249 in AZ (top 13%) — acceptable for families but not a draw, mixed tenant base, ~2y average lease.
- Market conditions: Rents soft (-2.8%/yr); 175 active listings in the ZIP; 33 comparable units currently listed for rent nearby; rentals leasing fast (median 9d on market — plan ~1-2 weeks tenant-placement turnaround); solid renter incomes; 36,011 units permitted in Maricopa County in 2024 (12,801 in 5+ unit buildings).
Forward outlook
- Local home prices are declining (-3.0%/yr); year-one equity from $270 of loan paydown is wiped out by about $1k of value loss. Plan a longer hold.
- Maricopa County population projected at +38% by 2050 — long-run rental-demand tailwind backs the buy-and-hold thesis.
- At projected returns (-3.0% appreciation + 0.0% rent growth), your $11k cash investment doubles in ~1 year — after that, you're playing with house money.
Negotiation context
- It's been on market 23 days — a 2% lower offer ($38k) is reasonable based on typical stale-listing flexibility.
- 2 sale attempts with the ask held roughly flat each time — persistent listings suggest the price (not the market) is what's stuck; bring a comps-based counter.
Risks & watch-outs
- Climate carrying-cost: extreme-heat days projected 5→13/yr by 2055 (HVAC capex compounding) — expect insurance premiums to compound above CPI over the hold.
Questions for the listing agent
- Have any recent inspections been done? Can we get a copy of the seller's disclosures and any deferred-maintenance estimates?
- Built in 1971 — when were the roof, HVAC, electrical panel, plumbing, and water heater last replaced?
- Is there a deadline driving the sale (1031 exchange, divorce, estate, relocation)? That informs how much negotiation room exists.
- Crime grade is F in this area — have there been break-ins, vandalism, or insurance claims at this property in the last 3 years? What carrier currently insures it and at what premium?
- What's the average days-on-market for RENTAL listings here right now (not sales)? A rising rental-DOM trend means longer vacancies and softer asking-rent achievability than the comps imply.
- What's the recent tenant-quality profile in this submarket — average credit score on applications, eviction rate, late-payment / NSF rate, and stable-employment percentage? A property-management company in the area should have these aggregated.
- How much new for-sale + rental construction is in the pipeline within 1–3 miles? Heavy new supply typically softens prices + rents 12–24 months out; constrained supply supports both.
Investment metrics
- 1% rule
- 4.52% ✓
- Cap rate
- 40.90%
- Cash-on-cash
- 123.58%
- DSCR
- 6.50
- GRM
- 1.8
CMA / ARV
- ARV (median comp)
- $63,500
- List price
- $39,000
- Delta
- -49.61%
- Verdict
- UNDERPRICED
- Comps
- 20 within 1.0 mi
Show comp detail 12 sales within ~0.75 mi
| Address | Dist | Beds/Ba | Sqft | Sold | Price | $/sf | Match |
|---|---|---|---|---|---|---|---|
| 2650 W Union Hills Dr #8 | 0.00mi | 2/2.0 | 1,536 (0%) | 2mo | $65,000 | $42 | 98 |
| 2650 W Union Hills Dr #138 | 0.07mi | 2/2.0 | 1,536 (0%) | 5mo | $74,000 | $48 | 92 |
| 2650 W Union Hills Dr #131 | 0.08mi | 2/2.0 | 1,488 (-3%) | 8mo | $60,500 | $41 | 84 |
| 2650 W Union Hills Dr #367 | 0.08mi | 3/2.0 (+1) | 1,536 (0%) | 17mo | $112,000 | $73 | 77 |
| 2650 W Union Hills Dr #258 | 0.08mi | 3/2.0 (+1) | 1,488 (-3%) | 12mo | $80,000 | $54 | 76 |
| 2650 W Union Hills Dr #114 | 0.08mi | 2/2.0 | 1,440 (-6%) | 13mo | $29,000 | $20 | 75 |
| 2650 W Union Hills Dr #100 | 0.08mi | 3/2.0 (+1) | 1,440 (-6%) | 9mo | $99,000 | $69 | 73 |
| 2650 W Union Hills Dr #33 | 0.08mi | 3/2.0 (+1) | 1,440 (-6%) | 13mo | $55,000 | $38 | 70 |
| 2650 W Union Hills Dr #215 | 0.08mi | 2/2.0 | 1,344 (-12%) | 10mo | $37,500 | $28 | 67 |
| 2650 W Union Hills Dr #43 | 0.08mi | 3/2.0 (+1) | 1,344 (-12%) | 4mo | $50,000 | $37 | 67 |
| 2650 W Union Hills Dr #185 | 0.08mi | 2/2.0 | 1,400 (-9%) | 18mo | $20,000 | $14 | 67 |
| 2650 W Union Hills Dr #38 | 0.08mi | 3/2.0 (+1) | 1,420 (-8%) | 15mo | $97,500 | $69 | 66 |
Match score weights: distance 35% · size 25% · config 20% · recency 20%. Top-matched comps best support the ARV.
Projected returns pro-forma
-3.0% appreciation · 0.0% rent growth · sell at horizon
- IRR
- —
- Equity multiple
- 6.51×
- Total profit
- $60,161
- Equity at exit
- $5,815
- IRR
- —
- Equity multiple
- 12.42×
- Total profit
- $124,739
- Equity at exit
- $3,372
Cash invested: $10,920 (down + closing). Projections, not guarantees.
Landlord ↔ Tenant lean methodology
- Overall (STATE)
- 87 Strongly Landlord-Friendly
- State Arizona
- 87 Strongly Landlord-Friendly · R+3
- County
- — inherits STATE
- City
- — inherits STATE
ZIP-level market 85027
- Rents YoY
- -2.8%
- Active inventory
- 175
- Price-to-rent
- 1.8×
Monthly cashflow live
- Estimated rent
- $1,765 high interval (Pro) →
- Mortgage (P&I)
- −$205
- Tax est. 1.5%
- −$49 /mo · $585/yr
- Insurance
- −$16
- HOA
- −$0
- Vacancy / Maint / Mgmt
- −$371
- Net cashflow
- $1,125
Break-even live
Sensitivity live
| Price | -10% $1,152 | -5% $1,138 | +0% $1,125 | +5% $1,111 | +10% $1,098 |
|---|---|---|---|---|---|
| Rent | -10% $985 | -5% $1,055 | +0% $1,125 | +5% $1,194 | +10% $1,264 |
| Rate | -1.0pp $1,144 | -0.5pp $1,135 | base $1,125 | +0.5pp $1,114 | +1.0pp $1,104 |
UW: 25.0% down · 7.5% · 30yr · 1.5% tax · 5.0% vac · 8.0% maint · 8.0% mgmt
Financing live
Cash to close
- Down payment
- $9,750
- Closing costs
- $1,170
- Reserves months
- —
- Total cash needed
- —
Loan-product check · same deal, 3 products live
Conventional
25% down · 7.5% · 30yr
- Down + closing
- —
- Monthly P&I
- —
- Monthly cashflow
- —
- DSCR
- —
- Eligible?
- —
Personal DTI + credit; lowest rate.
DSCR
20% down · 8.5% · 30yr
- Down + closing
- —
- Monthly P&I
- —
- Monthly cashflow
- —
- DSCR
- —
- Eligible?
- —
No personal income docs; deal must DSCR.
Hard money
10% down · 12.0% · 12mo
- Down + closing
- —
- Monthly P&I
- —
- Monthly cashflow
- —
- DSCR
- —
- Eligible?
- —
Short-term bridge; refi at stabilization.
Rent comps 33 comps
| Address | Beds | Baths | Sqft | Rent | $/sqft | DOM | Units | Dist |
|---|---|---|---|---|---|---|---|---|
| 2929 W Yorkshire Dr Phoenix, AZ | 1.0–3.0 | 1.0–2.0 | 915 | $1,498 | $1.64 | 19d | 2 | 0.43mi |
| 18250 N 25th Ave Phoenix, AZ | 1.0–3.0 | 1.0–2.0 | 992 | $1,721 | $1.73 | 0d | 17 | 0.46mi |
| 18422 N 30th Ln Phoenix, AZ | 3.0 | 2.5 | 1604 | $2,275 | $1.42 | 25d | 1 | 0.48mi |
| 3010 W Yorkshire Dr Phoenix, AZ | 1.0–3.0 | 1.0–2.0 | 975 | $1,444 | $1.48 | 2d | 80 | 0.56mi |
| 18001 N 29th Dr Phoenix, AZ | 3.0 | 2.5 | 1500 | $1,800 | $1.20 | 44d | 1 | 0.56mi |
| 17840 N Black Canyon Hwy Phoenix, AZ | 1.0–2.0 | 1.0–2.0 | 880 | $1,655 | $1.88 | 3d | 19 | 0.58mi |
| 2953 W Libby St Phoenix, AZ | 3.0 | 2.0 | 1640 | $2,095 | $1.28 | 44d | 1 | 0.71mi |
| 2039 W Union Hills Dr Unit 15-001 Phoenix, AZ | 2.0 | 2.0 | 1100 | $1,345 | $1.22 | 15d | 1 | 0.78mi |
| 2039 W Union Hills Dr Unit 39-143 Phoenix, AZ | 2.0 | 2.0 | 1100 | $1,345 | $1.22 | 8d | 1 | 0.78mi |
| 3144 W Charleston Ave Phoenix, AZ | 3.0 | 2.0 | 1085 | $1,845 | $1.70 | 17d | 1 | 0.79mi |
| 19940 N 23rd Ave Phoenix, AZ | 4.0 | 1.0–2.0 | 812 | $1,366 | $1.68 | 0d | 63 | 0.85mi |
| 3411 W Morrow Dr #3 Phoenix, AZ | 2.0 | 1.5 | 1056 | $1,495 | $1.42 | 44d | 1 | 0.85mi |
| 2431 W Shady Glen Ave Phoenix, AZ | 3.0 | 2.0 | 1586 | $2,155 | $1.36 | 8d | 1 | 0.92mi |
| 3338 W Tonto Ln Phoenix, AZ | 2.0 | 1.0 | 1206 | $1,375 | $1.14 | 8d | 1 | 1.01mi |
| 3250 W Helena Dr Phoenix, AZ | 3.0 | 2.0 | 1850 | $2,450 | $1.32 | 25d | 1 | 1.05mi |
| 18435 N 36th Ave Glendale, AZ | 3.0 | 2.0 | 1386 | $2,400 | $1.73 | 44d | 1 | 1.09mi |
| 2018 W Meadow Dr Phoenix, AZ | 3.0 | 2.0 | 1659 | $1,965 | $1.18 | 0d | 1 | 1.16mi |
| 2902 W Irma Ln Phoenix, AZ | 3.0 | 2.0 | 1553 | $2,295 | $1.48 | 44d | 1 | 1.17mi |
| 20227 N 21st Dr Phoenix, AZ | 2.0 | 2.5 | 1280 | $1,500 | $1.17 | 44d | 1 | 1.18mi |
| 20808 N 27th Ave Phoenix, AZ | 1.0–3.0 | 1.0–2.0 | 962 | $1,560 | $1.62 | 0d | 15 | 1.19mi |
| 1750 W Union Hills Dr #91 Phoenix, AZ | 3.0 | 2.5 | 1680 | $1,900 | $1.13 | 6d | 1 | 1.20mi |
| 2109 W Danbury Rd Phoenix, AZ | 3.0 | 1.5 | 1175 | $1,695 | $1.44 | 44d | 1 | 1.29mi |
| 20601 N 33rd Ave Phoenix, AZ | 3.0 | 2.0 | 1085 | $2,100 | $1.94 | 25d | 1 | 1.33mi |
| 17402 N 19th Ave Phoenix, AZ | 3.0 | 2.5 | 1194 | $1,450 | $1.21 | 3d | 2 | 1.34mi |
| 16623 N 29th Dr Phoenix, AZ | 3.0 | 2.0 | 1430 | $2,050 | $1.43 | 2d | 1 | 1.38mi |
| 17211 N 35th Ave Unit C110 Phoenix, AZ | 2.0 | 2.0 | 1126 | $1,895 | $1.68 | 44d | 1 | 1.39mi |
| 3637 W Angela Dr Glendale, AZ | 3.0 | 2.0 | 1677 | $2,095 | $1.25 | 0d | 1 | 1.40mi |
| 1708 W Behrend Dr Phoenix, AZ | 3.0 | 1.5 | 1320 | $1,761 | $1.33 | 8d | 1 | 1.41mi |
| 2142 W Monona Dr Phoenix, AZ | 3.0 | 2.0 | 1092 | $1,790 | $1.64 | 22d | 1 | 1.42mi |
| 1547 W Kerry Ln Phoenix, AZ | 3.0 | 2.0 | 1314 | $2,195 | $1.67 | 44d | 1 | 1.43mi |
| 1633 W Charleston Ave Phoenix, AZ | 3.0 | 1.5 | 1441 | $1,766 | $1.23 | 0d | 1 | 1.44mi |
| 17617 N 17th Ln Phoenix, AZ | 3.0 | 2.0 | 1353 | $2,100 | $1.55 | 4d | 1 | 1.46mi |
| 3011 W Zachary Dr Phoenix, AZ | 3.0 | 2.0 | 1324 | $1,945 | $1.47 | 8d | 1 | 1.47mi |
Listing history 20 events
-
2026-06-21days on market $39,000 Active 23 DOM
-
2026-06-18days on market $39,000 Active 20 DOM
-
2026-06-17days on market $39,000 Active 19 DOM
-
2026-06-16days on market $39,000 Active 18 DOM
-
2026-06-15days on market $39,000 Active 17 DOM
-
2026-06-13days on market $39,000 Active 15 DOM
-
2026-06-13days on market $39,000 Active 14 DOM
-
2026-06-09days on market $39,000 Active 11 DOM
-
2026-06-08days on market $39,000 Active 10 DOM
-
2026-06-07days on market $39,000 Active 9 DOM
-
2026-06-04days on market $39,000 Active 6 DOM
-
2026-06-03days on market $39,000 Active 5 DOM
-
2026-06-02days on market $39,000 Active 4 DOM
-
2026-06-01days on market $39,000 Active 3 DOM
-
2026-05-31days on market $39,000 Active 2 DOM
-
2026-05-13historical
-
2026-03-27price $32,000
-
2026-02-10price $40,000
-
2025-12-16price $50,000
-
2025-11-03$60,000 Active
ⓘ Source: listings_history table (triggers on properties + properties_extension) + one-shot
backfill from property_details.listing_events for pre-trigger history.
Climate risk First Street
- Flood 1/10 Low FEMA zone X (shaded) · 0% chance over 30 yrs
- Wildfire 1/10 Low
- Heat 8/10 Severe 5 d/yr ≥111°F today · 13 d/yr by 30 yrs out
- Wind 1/10 Low
- Air quality 3/10 Moderate 2 unhealthy d/yr today · 3 by 30 yrs out
Nearby sold comps map
Loading sold comps map…
Walkable amenities ~0.75 mi
Loading nearby amenities…
Taxation est. · year 1
- Rental income
- $21,176
- − Mortgage interest
- −$2,185
- − Property taxes
- −$585
- − Insurance
- −$195
- − Repairs & maintenance
- −$1,694
- − Management
- −$1,694
- − Depreciation
- −$1,135
- Taxable income
- $13,689
- Est. tax owed @ 24.0%
- −$3,285
- After-tax cash flow
- $10,210/yr
For passive investors: Depreciation is non-cash, so a rental often shows a tax loss while cash-flowing — sheltering income. Rental losses are passive: they offset passive income freely, and up to $25,000/yr can offset ordinary (W-2) income if you actively participate and your MAGI is under $100k (phasing out to $0 by $150k); unused losses carry forward. On sale, claimed depreciation is recaptured at up to 25%, and gains may owe capital-gains tax (a 1031 exchange can defer both). Figures are a year-1 estimate at your 24.0% rate — not tax advice; consult a CPA.
Condition & rehab AI · 12 photos
This manufactured home requires moderate repairs and maintenance, particularly to the exterior and interior paint, to improve its condition and value.
Repairs flagged
- Major exterior siding — Significant peeling and wear
- Major exterior paint — Peeling and discoloration
- Major interior paint — Significant discoloration and wear
- Major interior walls — Significant discoloration and wear
Value-add opportunities
- Both exterior paint — Enhances curb appeal and value
- Both interior paint — Enhances interior appearance and value
- Both interior walls — Enhances interior appearance and value
Renovation cost estimate screening
| Repair item | Severity | Est. cost |
|---|---|---|
| exterior siding · Significant peeling and wear | Major | $15,000–50,000 |
| exterior paint · Peeling and discoloration | Major | $15,000–50,000 |
| interior paint · Significant discoloration and wear | Major | $15,000–50,000 |
| interior walls · Significant discoloration and wear | Major | $15,000–50,000 |
| Total estimated repair cost · 4 items | $60,000–200,000 |
Value-add ROI direction
- Both exterior paint — Enhances curb appeal and value ↑
- Both interior paint — Enhances interior appearance and value ↑
- Both interior walls — Enhances interior appearance and value ↑
ⓘ Cost ranges are severity-bucket heuristics (US national rule-of-thumb). Get contractor quotes + a written scope before underwriting a rehab budget.
Schools (NCES district)
- District
- Deer Valley Unified District (4246)
- NCES district ID
- 0407750
- Math proficiency
- 50% ▼ -9.00%
- Reading proficiency
- 55% ▼ -6.00%
- Median HH income
- $72,516
- Composite
- 47.0/100
- National rank
- #2346
- State rank
- #33 of 249 in AZ
Livability — Phoenix
- Score
- 75/100
- State rank
- #16
- US rank
- #3924
Category grades
Schools grade is shown separately in the Schools card above.
Census & demographics
- Census place
- Phoenix, AZ
- County
- Maricopa County · 4,537,380 people
- City population
- 1,500,198
- Metro
- Phoenix-Mesa-Chandler, AZ
- Population (ZIP)
- 39,487
- Household income
- $76,605
- Rent vs Own
- Severe rent burden
- 1533.0
Population outlook (Maricopa County) Hauer SSP2
- Today (2025)
- 4,979,203 people
- By 2030
- 5,378,229 · +8.0%
- By 2040
- 6,156,598 · +23.6%
- By 2050
- 6,872,376 · +38.0%
- By 2075
- 8,401,270 · +68.7%
- By 2100
- 9,247,439 · +85.7%
Race, ethnicity, and origin ACS 2023
- Neighborhood character
- Diverse neighborhood (Simpson 0.58)
- Race & ethnicity
- White 61% Hispanic / Latino 22% Two or more races 13% Asian 7% Black 2% Native American 2%
- Hispanic origin (detail)
- Mexican 18% Puerto Rican 1%
- Common ancestry
- Lithuanian 2% Romanian 2% Italian 2%
- Foreign-born
- 16% · Canada, China
- Languages at home
- 77% English-only · Spanish 10% Other Indo-European 4% Other Asian/Pacific 3%
Political lean MEDSL · Maricopa
- 2024 margin
- Toss-up / Even · D 47.7% · R 51.2% · Other 1.1%
- 2008→2024 swing
- +7.1pp toward D · 2008: -10.6pp · 2024: -3.5pp
- All cycles
- 2024: R+3.5 2020: D+2.2 2016: R+3.5 2012: R+12.0 2008: R+10.6
Not yet ingested
- Civics
- —
Market trends
- HPI YoY
- ▼ -248.58%
- Current HPI
- 356.8851
- Rent YoY
- ▼ -2.75%
- Metro
- Phoenix-Mesa-Chandler, AZ
- State GDP YoY
- ▲ 4.54%
- F500 in state
- 20
Industry mix (Fortune 500 HQ in AZ)
| Industry | F500 HQs | Revenue |
|---|---|---|
| Technology | 2 | $13B |
|
||
| Mining / Metals | 1 | $23B |
|
||
| Environmental Services | 1 | $16B |
|
||
| Metals / Steel | 1 | $14B |
|
||
| Technology Distribution | 1 | $9B |
|
||
| Homebuilding | 1 | $8B |
|
||
Price history
-35.0% since first listed6 events — show timeline
- 2026-05-22 Listed $39,000 ARMLS
- 2026-05-13 Listing Removed — ARMLS
- 2026-03-27 Price Changed $32,000 ARMLS
- 2026-02-10 Price Changed $40,000 ARMLS
- 2025-12-16 Price Changed $50,000 ARMLS
- 2025-11-03 Listed $60,000 ARMLS
Cash-flow waterfall
monthlySold comps — $/sqft
last 12 mo · ≤1 miLoading sold comps…