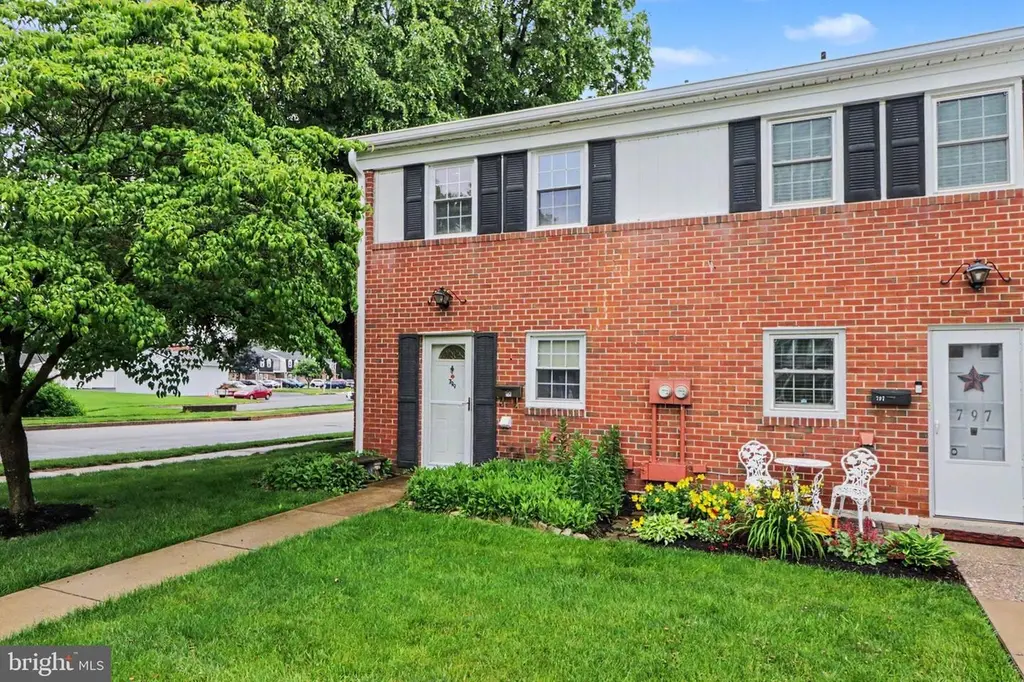
799 Hardwick Pl · York, PA
Flood risk 3/10 · Minor
- FEMA flood zone
- X (unshaded)
- Chance of flooding over 30 yrs
- 0.2%
- Est. flood insurance / yr
- $507 – $1,088
Fire risk 1/10 · Minimal
- Est. fire insurance / yr
- $511 – $949
Heat risk 6/10 · Moderate
- Hot days now (above 103°F)
- 7 days/yr
- Hot days in 30 yrs
- 15 days/yr
Wind risk 4/10 · Minor
- Chance of severe wind over 30 yrs
- 10.0%
Air-quality risk 3/10 · Minor
- Unhealthy air days now
- 3 days/yr
- Unhealthy air days in 30 yrs
- 5 days/yr
Risk factors via First Street. Map © Google.
Why this score? — see what drove the D+ grade
The composite is a weighted blend of 9 inputs, each scored 0–100. Each bar is that input's sub-score; the figure is the points it added to the 100-point composite (weight × sub-score).
- ARV discount +15.0/15.0
- Cash flow +12.4/30.0
- 1% rule +7.5/10.0
- Rent growth +4.1/5.0
- Livability +3.8/5.0
- DSCR +3.7/10.0
- Condition / age +2.5/5.0
- Schools +0.8/10.0
- Appreciation +0.0/10.0
$115,000
🖨 Deal sheet (PDF) 📄 Offer letter ✓ Due diligence
Listing remarks
Stop paying rent and enjoy the opportunity for homeownership with this two-bedroom, one-full-bath end-unit condo offering low-maintenance living at a very reasonable price. The main level features a kitchen, a combined living room and dining area, along with convenient laundry. The stackable washer and dryer are included in the sale, as are the range/oven and refrigerator. Sliding glass Pella doors lead to the rear patio, creating a great space for relaxing or entertaining. Upstairs, you'll find two bedrooms, both featuring ceiling fans and nicely sized closets offering excellent storage space. The full bath is also located on the upper level and includes a tub/shower combination. Additiona
Key facts
- $240 HOA
- Parking
- Community pool
Property features AI
Finance
- Other: Property manager present
- HOA & community: Condo fee of $240 monthly; Condo fee includes water, sewer, exterior building maintenance, lawn maintenance, snow removal, and pool(s); Community amenities include swimming pool, clubhouse, and playground
Exterior
- Parking: Paved parking; One parking lot space; On-street parking available; Total of one garage/parking space
- Utilities: Public water; Public sewer; Electric hot water
- Home design: End-of-row townhouse; Condominium ownership; Level main entry; Not in a federal flood zone
- Construction: Frame and masonry construction; Slab foundation; Above-grade and below-grade structures; Pets allowed with breed restrictions
- Exterior features: Patio(s); Sidewalks; Community pool
Interior
- Kitchen: Electric oven/range; Refrigerator
- Bedrooms: Two bedrooms on the upper level
- Bathrooms: One full bathroom
- Heating & cooling: Forced air heating (electric); Central air conditioning
- Interior features: Tub/shower; Ceiling fan(s); Combination dining and living area; Dining area
- Laundry & utility: Washer and dryer in unit; Stacked washer/dryer option; Dryer is electric; Main floor laundry
Neighborhood map
What this means for you Summary
Snapshot
- This is a 2-bed/1.0-bath townhouse listed at $115k.
Deal economics
- At list price, monthly cash flow is $-19 ($-223/yr) — negative.
- To cash-flow at today's rent, offer at most $112k (2.8% below list).
- Meets the 1% rule at list price ($1k rent vs $115k).
- Recommended offer: $112k (2.8% below list) — sets the bar for cash-flow.
- Cap rate 6.1% vs local median 4.9% in York — meaningfully above typical; check what's discounted (condition, days-on-market, listing class) to confirm the premium yield is real.
Location & tenants
- Location reads 75/100 on livability (#427 in PA, #3,987 nationally) — a middle-class / working-renter tenant base. Strengths: cost of living A+, health & safety A+, housing A; Watch: amenities D+, crime F, employment F.
- York City SD (urban): math 4% / reading 16% proficiency, ranked #534 of 539 in PA (top 99%) — low school quality limits family demand, transient renter base, plan for 1-2y turnover; 72% free/reduced lunch — lower-income household profile, screen leases tightly.
- Zoned schools: Devers Sch (math 3% / reading 18%, grade F, #1,396 of 1,518 statewide, top 92%, 695 students, 100% FRL); Edgar Fahs Smith Steam Academy (math 7% / reading 35%, grade F, #432 of 512 statewide, top 85%, 240 students, 100% FRL); William Penn Shs (math 22% / reading 8%, grade F, #407 of 437 statewide, top 94%, 1,534 students, 100% FRL) — zoned schools average 100% FRL vs 72% district-wide (28 pts higher); higher-poverty schools than district average — tighter screening recommended.
- Market conditions: Rents rising fast (+6.4%/yr); 252 active listings in the ZIP; 16 comparable units currently listed for rent nearby; rentals at typical pace (median 24d on market — plan ~3-4 weeks tenant-placement turnaround); solid renter incomes; 1,328 units permitted in York County in 2024 (338 in 5+ unit buildings).
Forward outlook
- Local home prices are declining (-3.0%/yr); year-one equity from $795 of loan paydown is wiped out by about $3k of value loss. Plan a longer hold.
Negotiation context
- Only 9 days on market — expect competitive offers; lowballing is unlikely to land.
- Current owner paid $62k; list at $115k implies a 87% gain — meaningful room to come down on a strong offer.
Risks & watch-outs
- Watch-outs: property tax is 2.7% of price.
- Climate carrying-cost: extreme-heat days projected 7→15/yr by 2055 (HVAC capex compounding) — expect insurance premiums to compound above CPI over the hold.
Questions for the listing agent
- What do current leases actually rent for vs. the listed asking? Can we see a recent rent roll and the last 12 months of T-12 income?
- Built in 1972 — when were the roof, HVAC, electrical panel, plumbing, and water heater last replaced?
- Property tax is high relative to price — has the assessment been appealed recently, and will the sale trigger a re-assessment?
- What does the HOA fee cover, when was the last increase, and are there any pending special assessments or reserve-fund shortfalls?
- Is there a deadline driving the sale (1031 exchange, divorce, estate, relocation)? That informs how much negotiation room exists.
- Crime grade is F in this area — have there been break-ins, vandalism, or insurance claims at this property in the last 3 years? What carrier currently insures it and at what premium?
- The area grade is low — what's the realistic commute time and amenity access for the typical tenant pool here? Any planned neighborhood developments (good or bad) we should know about?
- What's the average days-on-market for RENTAL listings here right now (not sales)? A rising rental-DOM trend means longer vacancies and softer asking-rent achievability than the comps imply.
- What's the recent tenant-quality profile in this submarket — average credit score on applications, eviction rate, late-payment / NSF rate, and stable-employment percentage? A property-management company in the area should have these aggregated.
- How much new for-sale + rental construction is in the pipeline within 1–3 miles? Heavy new supply typically softens prices + rents 12–24 months out; constrained supply supports both.
Investment metrics
- 1% rule
- 1.25% ✓
- Cap rate
- 6.10%
- Cash-on-cash
- -0.69%
- DSCR
- 0.97
- GRM
- 6.7
CMA / ARV
- ARV (on-the-fly)
- $140,288
- Comps found
- 12
Show comp detail 12 sales within ~0.75 mi
| Address | Dist | Beds/Ba | Sqft | Sold | Price | $/sf | Match |
|---|---|---|---|---|---|---|---|
| 793 Hardwick Pl | 0.01mi | 2/1.0 | 1,024 (0%) | 1mo | $140,000 | $137 | 99 |
| 776 Hardwick Pl | 0.03mi | 2/1.0 | 1,024 (0%) | 3mo | $140,000 | $137 | 96 |
| 765 Colony Dr | 0.06mi | 2/1.0 | 1,024 (0%) | 2mo | $129,900 | $127 | 95 |
| 1714 Devers Rd | 0.09mi | 2/1.0 | 1,024 (0%) | 1mo | $141,000 | $138 | 95 |
| 1640 Devers Rd Unit D | 0.11mi | 2/1.0 | 1,024 (0%) | 2mo | $230,000 | $225 | 93 |
| 1602 Devers Rd | 0.15mi | 2/1.0 | 1,024 (0%) | 2mo | $145,000 | $142 | 91 |
| 685 Colony Dr | 0.12mi | 2/1.0 | 1,024 (0%) | 4mo | $140,000 | $137 | 91 |
| 1620 Devers Rd | 0.13mi | 2/1.0 | 1,024 (0%) | 5mo | $130,000 | $127 | 90 |
| 627 Colony Dr | 0.18mi | 2/1.0 | 1,024 (0%) | 3mo | $119,000 | $116 | 89 |
| 1754 Devers Rd | 0.07mi | 3/1.0 (+1) | 1,024 (0%) | 4mo | $119,000 | $116 | 88 |
| 1752 Devers Rd | 0.07mi | 3/1.0 (+1) | 1,024 (0%) | 4mo | $125,000 | $122 | 88 |
| 1750 Devers Rd | 0.07mi | 3/1.0 (+1) | 1,024 (0%) | 4mo | $125,000 | $122 | 88 |
Match score weights: distance 35% · size 25% · config 20% · recency 20%. Top-matched comps best support the ARV.
Projected returns pro-forma
-3.0% appreciation · 6.38% rent growth · sell at horizon
- IRR
- -11.9%
- Equity multiple
- 0.55×
- Total profit
- $-14,535
- Equity at exit
- $17,147
- IRR
- 3.2%
- Equity multiple
- 1.28×
- Total profit
- $8,972
- Equity at exit
- $9,943
Cash invested: $32,200 (down + closing). Projections, not guarantees.
Landlord ↔ Tenant lean methodology
- Overall (STATE)
- 62 Landlord-Friendly
- State Pennsylvania
- 62 Landlord-Friendly · EVEN
- County
- — inherits STATE
- City
- — inherits STATE
ZIP-level market 17404
- Rents YoY
- 6.4%
- Active inventory
- 252
- Price-to-rent
- 6.7×
Monthly cashflow live
- Estimated rent
- $1,434 high interval (Pro) →
- Mortgage (P&I)
- −$603
- Tax from tax record
- −$260 /mo · $3,120/yr
- Insurance
- −$48
- HOA
- −$240
- Lot rent
- −$0
- Vacancy / Maint / Mgmt
- −$301
- Net cashflow
- $-19
Break-even live
Sensitivity live
| Price | -10% $47 | -5% $14 | +0% $-19 | +5% $-51 | +10% $-84 |
|---|---|---|---|---|---|
| Rent | -10% $-132 | -5% $-75 | +0% $-19 | +5% $38 | +10% $95 |
| Rate | -1.0pp $39 | -0.5pp $11 | base $-19 | +0.5pp $-48 | +1.0pp $-79 |
UW: 25.0% down · 7.5% · 30yr · 1.5% tax · 5.0% vac · 8.0% maint · 8.0% mgmt
Financing live
Cash to close
- Down payment
- $28,750
- Closing costs
- $3,450
- Reserves months
- —
- Total cash needed
- —
Loan-product check · same deal, 3 products live
Conventional
25% down · 7.5% · 30yr
- Down + closing
- —
- Monthly P&I
- —
- Monthly cashflow
- —
- DSCR
- —
- Eligible?
- —
Personal DTI + credit; lowest rate.
DSCR
20% down · 8.5% · 30yr
- Down + closing
- —
- Monthly P&I
- —
- Monthly cashflow
- —
- DSCR
- —
- Eligible?
- —
No personal income docs; deal must DSCR.
Hard money
10% down · 12.0% · 12mo
- Down + closing
- —
- Monthly P&I
- —
- Monthly cashflow
- —
- DSCR
- —
- Eligible?
- —
Short-term bridge; refi at stabilization.
Rent comps 16 comps
| Address | Beds | Baths | Sqft | Rent | $/sqft | DOM | Units | Dist |
|---|---|---|---|---|---|---|---|---|
| 433 Piedmont Cir York, PA | 3.0 | 1.5 | 1000 | $1,656 | $1.66 | 46d | 1 | 0.34mi |
| 433 Piedmont Cir York, PA | 1.0–3.0 | 1.0–1.5 | 850 | $1,505 | $1.77 | 16d | 2 | 0.34mi |
| 2220 N Susquehanna Trl York, PA | 1.0–3.0 | 1.0–2.0 | 1073 | $2,050 | $1.91 | 16d | 14 | 0.75mi |
| 1100 Schley Aly York, PA | 1.0 | 1.0 | 911 | $1,195 | $1.31 | 16d | 1 | 0.92mi |
| 42 Laurel St York, PA | 3.0 | 1.0 | 1136 | $1,375 | $1.21 | 23d | 1 | 1.04mi |
| 2256 N Point Dr York, PA | 2.0 | 1.5 | 1200 | $1,650 | $1.38 | 46d | 1 | 1.07mi |
| 834 Latimer St Unit 3 York, PA | 1.0 | 1.0 | 750 | $1,110 | $1.48 | 23d | 1 | 1.14mi |
| 815 N George St York, PA | 1.0 | 1.0 | 735 | $1,195 | $1.63 | 16d | 1 | 1.14mi |
| 720 Elm Ter York, PA | 3.0 | 1.5 | 1200 | $1,950 | $1.62 | 23d | 1 | 1.15mi |
| 631 Roosevelt Ave Unit 2 York, PA | 3.0 | 1.0 | 1170 | $1,150 | $0.98 | 16d | 1 | 1.23mi |
| 450 Madison Ave York, PA | 1.0–2.0 | 1.0 | 862 | $1,250 | $1.45 | 16d | 1 | 1.26mi |
| 1800 Kenneth Rd York, PA | 1.0–3.0 | 1.0–2.0 | 898 | $1,700 | $1.89 | 16d | 21 | 1.35mi |
| 403 N Newberry St Unit A10 York, PA | 2.0 | 1.0 | 750 | $1,095 | $1.46 | 23d | 1 | 1.36mi |
| 403 N Newberry St Unit B12 York, PA | 2.0 | 1.0 | 750 | $1,050 | $1.40 | 46d | 1 | 1.36mi |
| 334 N Beaver St York, PA | 3.0 | 1.0 | 1140 | $1,050 | $0.92 | 16d | 1 | 1.44mi |
| 133 Stevens Ave York, PA | 3.0 | 1.0 | 1200 | $1,300 | $1.08 | 46d | 1 | 1.45mi |
HOA detail
- Monthly dues
- $240 · $2,880/yr
Listing history 12 events
-
2026-06-07statusdays on market $115,000 Pending 9 DOM
-
2026-06-03days on market $115,000 Active 7 DOM
-
2026-06-02days on market $115,000 Active 6 DOM
-
2026-06-01days on market $115,000 Active 5 DOM
-
2026-05-31days on market $115,000 Active 4 DOM
-
2026-05-30days on market $115,000 Active 3 DOM
-
2026-05-28$115,000 Active
-
2026-05-27historical $115,000
-
2006-07-31soldstatus $61,500
-
2003-03-27soldstatus $51,900
-
1999-07-01soldstatus $50,900
-
1996-12-13soldstatus $50,000
ⓘ Source: listings_history table (triggers on properties + properties_extension) + one-shot
backfill from property_details.listing_events for pre-trigger history.
Tax reassessment forecast PA · Partial reset (capped growth)
- Current annual tax
- $3,120 · $260/mo
- Projected year-2 tax
- $3,120 · $260/mo
- Expected delta
- $0/yr ($0/mo · 0.0%)
ⓘ Screening estimate from a state-policy table — verify with the county assessor before closing.
Climate risk First Street
- Flood 3/10 Moderate FEMA zone X (unshaded) · 20% chance over 30 yrs
- Wildfire 1/10 Low
- Heat 6/10 Major 7 d/yr ≥103°F today · 15 d/yr by 30 yrs out
- Wind 4/10 Moderate 10% chance of damaging wind over 30 yrs
- Air quality 3/10 Moderate 3 unhealthy d/yr today · 5 by 30 yrs out
Nearby sold comps map
Loading sold comps map…
Walkable amenities ~0.75 mi
Loading nearby amenities…
Taxation est. · year 1
- Rental income
- $17,202
- − Mortgage interest
- −$6,442
- − Property taxes
- −$3,120
- − Insurance
- −$575
- − Repairs & maintenance
- −$1,376
- − Management
- −$1,376
- − HOA
- −$2,880
- − Depreciation
- −$3,345
- Taxable loss
- −$1,913
- Est. tax savings @ 24.0%
- +$459
- After-tax cash flow
- $237/yr
For passive investors: Depreciation is non-cash, so a rental often shows a tax loss while cash-flowing — sheltering income. Rental losses are passive: they offset passive income freely, and up to $25,000/yr can offset ordinary (W-2) income if you actively participate and your MAGI is under $100k (phasing out to $0 by $150k); unused losses carry forward. On sale, claimed depreciation is recaptured at up to 25%, and gains may owe capital-gains tax (a 1031 exchange can defer both). Figures are a year-1 estimate at your 24.0% rate — not tax advice; consult a CPA.
Schools (NCES district)
- District
- York City SD
- NCES district ID
- 4226820
- Math proficiency
- 4% ▼ -7.00%
- Reading proficiency
- 16% ▼ -9.00%
- Median HH income
- $29,470
- Composite
- 7.61/100
- National rank
- #9943
- State rank
- #534 of 539 in PA
Livability — York
- Score
- 75/100
- State rank
- #427
- US rank
- #3987
Category grades
Schools grade is shown separately in the Schools card above.
Census & demographics
- Census place
- York, PA
- County
- York County · 278,806 people
- City population
- 184,764
- Metro
- York-Hanover, PA
- Population (ZIP)
- 39,374
- Household income
- $78,506
- Rent vs Own
- Severe rent burden
- 722.0
Population outlook (York County) Hauer SSP2
- Today (2025)
- 454,205 people
- By 2030
- 457,407 · +0.7%
- By 2040
- 457,529 · +0.7%
- By 2050
- 448,261 · -1.3%
- By 2075
- 427,388 · -5.9%
- By 2100
- 384,218 · -15.4%
Race, ethnicity, and origin ACS 2023
- Neighborhood character
- Majority White (65%)
- Race & ethnicity
- White 65% Hispanic / Latino 19% Black 12% Two or more races 8%
- Hispanic origin (detail)
- Mexican 2% Puerto Rican 9% Dominican 4%
- Common ancestry
- Romanian 2% Slovak 2% Lithuanian 1%
- Foreign-born
- 6% · Canada, Vietnam
- Languages at home
- 85% English-only · Spanish 12% Russian/Polish/Slavic 1%
Political lean MEDSL · York
- 2024 margin
- Strong R (+25.3) · D 36.9% · R 62.1%
- 2008→2024 swing
- -11.7pp toward R · 2008: -13.6pp · 2024: -25.3pp
- All cycles
- 2024: R+25.3 2020: R+24.6 2016: R+29.3 2012: R+21.2 2008: R+13.6
Not yet ingested
- Civics
- —
Market trends
- HPI YoY
- ▼ -135.44%
- Current HPI
- 237.5683
- Rent YoY
- ▲ 6.38%
- Metro
- York-Hanover, PA
- State GDP YoY
- ▲ 1.68%
- F500 in state
- 34
Industry mix (Fortune 500 HQ in PA)
| Industry | F500 HQs | Revenue |
|---|---|---|
| Healthcare | 2 | $309B |
|
||
| Insurance | 2 | $27B |
|
||
| Telecommunications / Media | 1 | $124B |
|
||
| Industrial Distribution | 1 | $22B |
|
||
| Financial Services | 1 | $20B |
|
||
| Chemicals / Materials | 1 | $18B |
|
||
Price history
+130.0% since first listed6 events — show timeline
- 2026-05-28 Listed $115,000 BRIGHT MLS
- 2026-05-27 Coming Soon $115,000 BRIGHT MLS
- 2006-07-31 Sold (Public Records) $61,500 Public Records
- 2003-03-27 Sold (Public Records) $51,900 Public Records
- 1999-07-01 Sold (Public Records) $50,900 Public Records
- 1996-12-13 Sold (Public Records) $50,000 Public Records
Property tax history
+0.7%/yrLatest (2025): $3,120 · +0.9% YoY. Source: county tax records.
Cash-flow waterfall
monthlySold comps — $/sqft
last 12 mo · ≤1 miLoading sold comps…