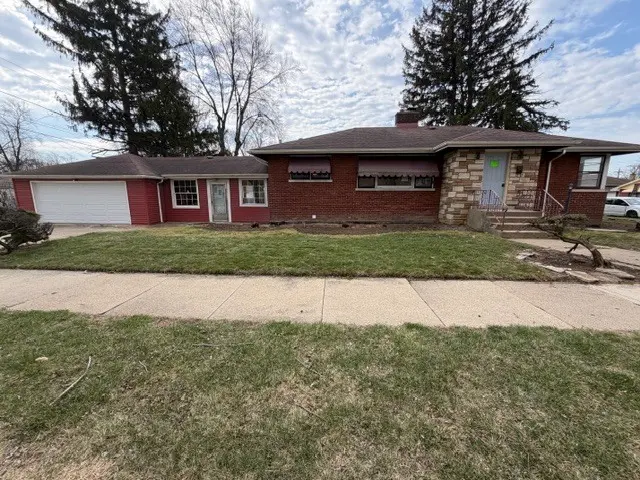
12501 S Throop St · Calumet Park, IL
Flood risk 1/10 · Minimal
- FEMA flood zone
- X (unshaded)
- Chance of flooding over 30 yrs
- 0.0%
- Est. flood insurance / yr
- $473 – $860
Fire risk 1/10 · Minimal
- Est. fire insurance / yr
- $804 – $1,492
Heat risk 3/10 · Minor
- Hot days now (above 101°F)
- 7 days/yr
- Hot days in 30 yrs
- 15 days/yr
Wind risk 2/10 · Minimal
- Chance of severe wind over 30 yrs
- —
Air-quality risk 4/10 · Minor
- Unhealthy air days now
- 4 days/yr
- Unhealthy air days in 30 yrs
- 6 days/yr
Risk factors via First Street. Map © Google.
Why this score? — see what drove the B+ grade
The composite is a weighted blend of 9 inputs, each scored 0–100. Each bar is that input's sub-score; the figure is the points it added to the 100-point composite (weight × sub-score).
- Cash flow +30.0/30.0
- ARV discount +15.0/15.0
- DSCR +10.0/10.0
- 1% rule +8.4/10.0
- Rent growth +4.5/5.0
- Livability +3.6/5.0
- Condition / age +2.5/5.0
- Schools +1.6/10.0
- Appreciation +0.0/10.0
$142,500
🖨 Deal sheet (PDF) 📄 Offer letter ✓ Due diligence
Listing remarks MLS
Welcome to this charming 3 bedroom, 1 3/4 bath corner brick ranch home in the heart of Calumet Park! This inviting residence offers a perfect blend of comfort and functionality, featuring spacious living areas filled with natural light and a thoughtfully designed layout ideal for both everyday living and entertaining. Home features basement, full basement and breezeway to a 2 car attached garage.
Key facts
- 2 garage spots
- Built 1953
- Listed 63 days
Neighborhood map
What this means for you Summary
Snapshot
- This is a 3-bed/1.5-bath single-family listed at $142k.
Deal economics
- At list price, monthly cash flow is $589 ($7k/yr) — positive.
- The deal already cash-flows at list — no discount required.
- Meets the 1% rule at list price ($2k rent vs $142k).
- Recommended offer: $134k (6.0% below list) — sets the bar for market timing.
- Cap rate 11.3% vs local median 6.7% in Calumet Park — top-decile yield for the area; either an underpriced asset or a hidden risk that comps aren't pricing in. Stress-test before assuming the spread holds.
Location & tenants
- Location reads 72/100 on livability (#308 in IL) — a middle-class / working-renter tenant base. Strengths: commute A+, cost of living A+, housing A+; Watch: employment C-, schools F, crime F.
- Chsd 218 (suburban): math 14% / reading 20% proficiency, ranked #454 of 620 in IL (top 73%) — low school quality limits family demand, transient renter base, plan for 1-2y turnover.
- Market conditions: Rents rising fast (+7.8%/yr); 76 active listings in the ZIP; 12 comparable units currently listed for rent nearby; rentals leasing fast (median 13d on market — plan ~1-2 weeks tenant-placement turnaround); lower-income renter base — watch delinquency; 6,272 units permitted in Cook County in 2024 (4,658 in 5+ unit buildings).
- At $1,916/mo this rent would consume 62% of the median local household income ($37k/yr) (locally 1868% of renters already pay >50% of income on rent) — very limited rent-growth headroom before tenants either downsize or default.
Forward outlook
- Local home prices are declining (-3.0%/yr); year-one equity from $985 of loan paydown is wiped out by about $4k of value loss. Plan a longer hold.
- At projected returns (-3.0% appreciation + 7.8% rent growth), your $40k cash investment doubles in ~6 years — after that, you're playing with house money.
Negotiation context
- It's been on market 63 days — a 6% lower offer ($134k) is reasonable based on typical stale-listing flexibility.
- Current owner paid $46k; list at $142k implies a 213% gain — meaningful room to come down on a strong offer.
Risks & watch-outs
- Watch-outs: built in 1953 — expect roof / HVAC / electrical / plumbing capex.
Questions for the listing agent
- It's been on market 63 days. Have you received any prior offers? Is the seller open to a 6% concession, seller financing, or rate buy-down credit?
- Built in 1953 — when were the roof, HVAC, electrical panel, plumbing, and water heater last replaced?
- Why hasn't it sold? Are there any deal-killer items the seller is aware of (foundation, flood, title, zoning, code violations)?
- Is there a deadline driving the sale (1031 exchange, divorce, estate, relocation)? That informs how much negotiation room exists.
- Schools are F-rated, which usually means shorter tenancies and higher turnover. Who's the typical renter profile here, and what's been the actual vacancy rate?
- Crime grade is F in this area — have there been break-ins, vandalism, or insurance claims at this property in the last 3 years? What carrier currently insures it and at what premium?
- What's the average days-on-market for RENTAL listings here right now (not sales)? A rising rental-DOM trend means longer vacancies and softer asking-rent achievability than the comps imply.
- What's the recent tenant-quality profile in this submarket — average credit score on applications, eviction rate, late-payment / NSF rate, and stable-employment percentage? A property-management company in the area should have these aggregated.
- How much new for-sale + rental construction is in the pipeline within 1–3 miles? Heavy new supply typically softens prices + rents 12–24 months out; constrained supply supports both.
Investment metrics
- 1% rule
- 1.34% ✓
- Cap rate
- 11.25%
- Cash-on-cash
- 17.72%
- DSCR
- 1.79
- GRM
- 6.2
CMA / ARV
- ARV (median comp)
- $209,034
- List price
- $142,500
- Delta
- -31.83%
- Verdict
- UNDERPRICED
- Comps
- 20 within 1.0 mi
Show comp detail 12 sales within ~0.75 mi
| Address | Dist | Beds/Ba | Sqft | Sold | Price | $/sf | Match |
|---|---|---|---|---|---|---|---|
| 12509 S Throop St | 0.02mi | 3/1.0 | 1,216 (+1%) | 2mo | $141,270 | $116 | 94 |
| 12427 S Ada St | 0.10mi | 3/1.5 | 1,152 (-4%) | 0mo | $215,000 | $187 | 88 |
| 12334 S Loomis St | 0.25mi | 3/2.0 | 1,173 (-3%) | 1mo | $136,000 | $116 | 81 |
| 12726 S Justine St | 0.47mi | 3/1.5 | 1,224 (+2%) | 2mo | $165,000 | $135 | 74 |
| 12816 S Laflin St | 0.51mi | 3/1.0 | 1,200 (-0%) | 2mo | $135,000 | $113 | 72 |
| 12416 S Carpenter St | 0.30mi | 4/1.0 (+1) | 1,253 (+4%) | 3mo | $112,500 | $90 | 70 |
| 12806 S Laflin St | 0.48mi | 4/2.0 (+1) | 1,200 (-0%) | 1mo | $279,000 | $233 | 69 |
| 1021 W Vermont Ave | 0.53mi | 3/1.0 | 1,118 (-7%) | 2mo | $180,000 | $161 | 59 |
| 12154 S Justine St | 0.53mi | 3/1.5 | 1,092 (-9%) | 1mo | $160,053 | $147 | 58 |
| 12930 S Carpenter St | 0.60mi | 4/2.5 (+1) | 1,231 (+2%) | 2mo | $269,000 | $219 | 58 |
| 12811 S Elizabeth St | 0.40mi | 3/1.0 | 1,028 (-15%) | 3mo | $117,900 | $115 | 53 |
| 12036 S Justine St | 0.67mi | 3/2.5 | 1,025 (-15%) | 2mo | $245,000 | $239 | 38 |
Match score weights: distance 35% · size 25% · config 20% · recency 20%. Top-matched comps best support the ARV.
Projected returns pro-forma
-3.0% appreciation · 7.82% rent growth · sell at horizon
- IRR
- 14.3%
- Equity multiple
- 1.61×
- Total profit
- $24,163
- Equity at exit
- $21,247
- IRR
- 26.4%
- Equity multiple
- 3.84×
- Total profit
- $113,494
- Equity at exit
- $12,321
Cash invested: $39,900 (down + closing). Projections, not guarantees.
Landlord ↔ Tenant lean methodology
- Overall (STATE)
- 43 Moderately Tenant-Leaning
- State Illinois
- 43 Moderately Tenant-Leaning · D+7
- County
- — inherits STATE
- City
- — inherits STATE
ZIP-level market 60827
- Home prices YoY
- -31.8%
- Rents YoY
- 7.8%
- Active inventory
- 76
- Price-to-rent
- 6.2×
Monthly cashflow live
- Estimated rent
- $1,916 high interval (Pro) →
- Mortgage (P&I)
- −$747
- Tax from tax record
- −$118 /mo · $1,412/yr
- Insurance
- −$59
- HOA
- −$0
- Vacancy / Maint / Mgmt
- −$402
- Net cashflow
- $589
Break-even live
Sensitivity live
| Price | -10% $670 | -5% $629 | +0% $589 | +5% $549 | +10% $508 |
|---|---|---|---|---|---|
| Rent | -10% $438 | -5% $513 | +0% $589 | +5% $665 | +10% $740 |
| Rate | -1.0pp $661 | -0.5pp $625 | base $589 | +0.5pp $552 | +1.0pp $515 |
UW: 25.0% down · 7.5% · 30yr · 1.5% tax · 5.0% vac · 8.0% maint · 8.0% mgmt
Financing live
Cash to close
- Down payment
- $35,625
- Closing costs
- $4,275
- Reserves months
- —
- Total cash needed
- —
Loan-product check · same deal, 3 products live
Conventional
25% down · 7.5% · 30yr
- Down + closing
- —
- Monthly P&I
- —
- Monthly cashflow
- —
- DSCR
- —
- Eligible?
- —
Personal DTI + credit; lowest rate.
DSCR
20% down · 8.5% · 30yr
- Down + closing
- —
- Monthly P&I
- —
- Monthly cashflow
- —
- DSCR
- —
- Eligible?
- —
No personal income docs; deal must DSCR.
Hard money
10% down · 12.0% · 12mo
- Down + closing
- —
- Monthly P&I
- —
- Monthly cashflow
- —
- DSCR
- —
- Eligible?
- —
Short-term bridge; refi at stabilization.
Rent comps 12 comps
| Address | Beds | Baths | Sqft | Rent | $/sqft | DOM | Units | Dist |
|---|---|---|---|---|---|---|---|---|
| 843 W 123rd St Unit T2 Calumet Park, IL | 2.0 | 1.0 | 750 | $1,400 | $1.87 | 13d | 1 | 0.55mi |
| 843 W 123rd St Unit V5 Calumet Park, IL | 2.0 | 1.0 | 900 | $1,500 | $1.67 | 13d | 1 | 0.55mi |
| 12827 S Morgan St Unit 1546010P Chicago, IL | 4.0 | 2.0 | 1022 | $4,677 | $4.58 | 12d | 1 | 0.60mi |
| 12358 S Lowe Ave Chicago, IL | 3.0 | 2.0 | 1050 | $2,400 | $2.29 | 24d | 1 | 0.77mi |
| 12106 S Emerald Ave Chicago, IL | 3.0 | 2.0 | 1300 | $2,550 | $1.96 | 2d | 1 | 0.79mi |
| 13034 Honore St Unit 1 Blue Island, IL | 2.0 | 1.0 | 700 | $1,350 | $1.93 | 13d | 1 | 1.01mi |
| 1908 Vermont St Unit 1916-4 Blue Island, IL | 2.0 | 1.0 | 800 | $1,395 | $1.74 | 2d | 1 | 1.08mi |
| 1923 Vermont St Blue Island, IL | 2.0 | 1.0 | 1087 | $1,550 | $1.43 | 24d | 1 | 1.10mi |
| 2130 122nd St Blue Island, IL | 2.0 | 1.0 | 558 | $1,450 | $2.60 | 2d | 1 | 1.17mi |
| 11547 S Ashland Ave Chicago, IL | 3.0 | 1.5 | 1000 | $2,700 | $2.70 | 3d | 1 | 1.21mi |
| 11361 S Racine Ave Chicago, IL | 3.0 | 1.5 | 1440 | $3,700 | $2.57 | 2d | 1 | 1.37mi |
| 2336 122nd St Unit 2 Blue Island, IL | 3.0 | 1.0 | 1340 | $1,900 | $1.42 | 20d | 1 | 1.41mi |
Listing history 5 events
-
2026-05-15price $142,500 399-char remark
Show marketing remark (399 chars)
Welcome to this charming 3 bedroom, 1 3/4 bath corner brick ranch home in the heart of Calumet Park! This inviting residence offers a perfect blend of comfort and functionality, featuring spacious living areas filled with natural light and a thoughtfully designed layout ideal for both everyday living and entertaining. Home features basement, full basement and breezeway to a 2 car attached garage.
-
2026-04-30price $150,000 399-char remark
Show marketing remark (399 chars)
Welcome to this charming 3 bedroom, 1 3/4 bath corner brick ranch home in the heart of Calumet Park! This inviting residence offers a perfect blend of comfort and functionality, featuring spacious living areas filled with natural light and a thoughtfully designed layout ideal for both everyday living and entertaining. Home features basement, full basement and breezeway to a 2 car attached garage.
-
2026-04-25price $186,200 399-char remark
Show marketing remark (399 chars)
Welcome to this charming 3 bedroom, 1 3/4 bath corner brick ranch home in the heart of Calumet Park! This inviting residence offers a perfect blend of comfort and functionality, featuring spacious living areas filled with natural light and a thoughtfully designed layout ideal for both everyday living and entertaining. Home features basement, full basement and breezeway to a 2 car attached garage.
-
2026-03-26$196,000 Active 399-char remark
Show marketing remark (399 chars)
Welcome to this charming 3 bedroom, 1 3/4 bath corner brick ranch home in the heart of Calumet Park! This inviting residence offers a perfect blend of comfort and functionality, featuring spacious living areas filled with natural light and a thoughtfully designed layout ideal for both everyday living and entertaining. Home features basement, full basement and breezeway to a 2 car attached garage.
-
1978-02-06soldstatus $45,500
ⓘ Source: listings_history table (triggers on properties + properties_extension) + one-shot
backfill from property_details.listing_events for pre-trigger history.
Tax reassessment forecast IL · Partial reset (capped growth)
- Current annual tax
- $1,412 · $118/mo
- Projected year-2 tax
- $2,323 · $194/mo
- Expected delta
- +$912/yr (+$76/mo · 64.6%)
ⓘ Screening estimate from a state-policy table — verify with the county assessor before closing.
Climate risk First Street
- Flood 1/10 Low FEMA zone X (unshaded) · 0% chance over 30 yrs
- Wildfire 1/10 Low
- Heat 3/10 Moderate 7 d/yr ≥101°F today · 15 d/yr by 30 yrs out
- Wind 2/10 Low
- Air quality 4/10 Moderate 4 unhealthy d/yr today · 6 by 30 yrs out
Nearby sold comps map
Loading sold comps map…
Walkable amenities ~0.75 mi
Loading nearby amenities…
Taxation est. · year 1
- Rental income
- $22,988
- − Mortgage interest
- −$7,982
- − Property taxes
- −$1,412
- − Insurance
- −$712
- − Repairs & maintenance
- −$1,839
- − Management
- −$1,839
- − Depreciation
- −$4,145
- Taxable income
- $5,058
- Est. tax owed @ 24.0%
- −$1,214
- After-tax cash flow
- $5,855/yr
For passive investors: Depreciation is non-cash, so a rental often shows a tax loss while cash-flowing — sheltering income. Rental losses are passive: they offset passive income freely, and up to $25,000/yr can offset ordinary (W-2) income if you actively participate and your MAGI is under $100k (phasing out to $0 by $150k); unused losses carry forward. On sale, claimed depreciation is recaptured at up to 25%, and gains may owe capital-gains tax (a 1031 exchange can defer both). Figures are a year-1 estimate at your 24.0% rate — not tax advice; consult a CPA.
Schools (NCES district)
- District
- Chsd 218
- NCES district ID
- 1706540
- Math proficiency
- 14% ▼ -4.00%
- Reading proficiency
- 20% ▼ -1.00%
- Median HH income
- $57,166
- Composite
- 16.09/100
- National rank
- #9235
- State rank
- #454 of 620 in IL
Livability — Calumet Park
- Score
- 72/100
- State rank
- #308
- US rank
- #6048
Category grades
Schools grade is shown separately in the Schools card above.
Census & demographics
- Census place
- Calumet Park, IL
- County
- Cook County · 4,486,803 people
- Metro
- Chicago-Naperville-Elgin, IL-IN-WI
- Population (ZIP)
- 24,713
- Household income
- $37,217
- Rent vs Own
- Severe rent burden
- 1868.0
Population outlook (Cook County) Hauer SSP2
- Today (2025)
- 5,347,519 people
- By 2030
- 5,357,703 · +0.2%
- By 2040
- 5,324,924 · -0.4%
- By 2050
- 5,230,762 · -2.2%
- By 2075
- 4,785,735 · -10.5%
- By 2100
- 4,188,836 · -21.7%
Race, ethnicity, and origin ACS 2023
- Neighborhood character
- Predominantly Black (88%)
- Race & ethnicity
- Black 88% Two or more races 5% Hispanic / Latino 5% White 2%
- Common ancestry
- Iranian 1%
- Foreign-born
- 2% · Canada
- Languages at home
- 96% English-only · Spanish 3%
Political lean MEDSL · Cook
- 2024 margin
- Solid D (+42.0) · D 70.4% · R 28.4% · Other 1.2%
- 2008→2024 swing
- -11.4pp toward R · 2008: 53.4pp · 2024: 42.0pp
- All cycles
- 2024: D+42.0 2020: D+50.3 2016: D+53.0 2012: D+49.4 2008: D+53.4
Not yet ingested
- Civics
- —
Market trends
- HPI YoY
- ▼ -76.39%
- Current HPI
- 163.7725
- Rent YoY
- ▲ 7.82%
- Metro
- Chicago-Naperville-Elgin, IL-IN-WI
- State GDP YoY
- ▲ 1.59%
- F500 in state
- 60
Industry mix (Fortune 500 HQ in IL)
| Industry | F500 HQs | Revenue |
|---|---|---|
| Insurance | 4 | $201B |
|
||
| Consumer Goods | 4 | $87B |
|
||
| Industrial Machinery | 3 | $64B |
|
||
| Healthcare | 2 | $55B |
|
||
| Retail / Pharmacy | 1 | $148B |
|
||
| Agriculture / Food | 1 | $86B |
|
||
Price history
+213.2% since first listed5 events — show timeline
- 2026-05-15 Price Changed $142,500 MRED as Distributed by MLS Grid
- 2026-04-30 Price Changed $150,000 MRED as Distributed by MLS Grid
- 2026-04-25 Price Changed $186,200 MRED as Distributed by MLS Grid
- 2026-03-26 Listed $196,000 MRED as Distributed by MLS Grid
- 1978-02-06 Sold (Public Records) $45,500 Public Records
Property tax history
-5.2%/yrLatest (2023): $1,412 · -47.6% YoY. Source: county tax records.
Cash-flow waterfall
monthlySold comps — $/sqft
last 12 mo · ≤1 miLoading sold comps…