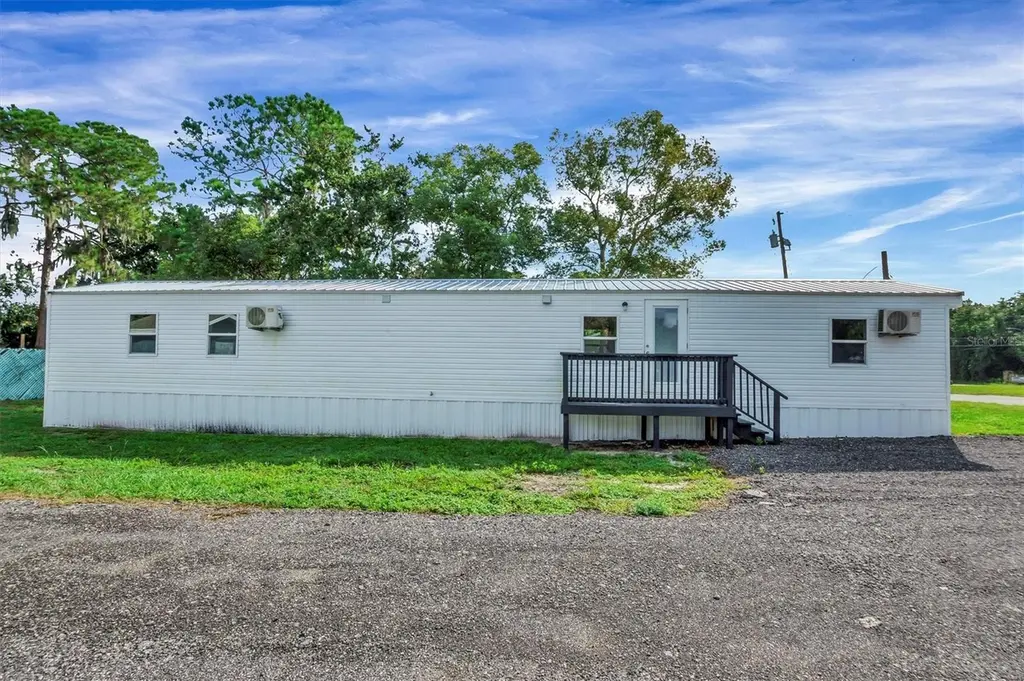
2667 Snapping Turtle Dr · Dundee, FL
Flood risk 1/10 · Minimal
- FEMA flood zone
- X (unshaded)
- Chance of flooding over 30 yrs
- 0.0%
- Est. flood insurance / yr
- $507 – $1,088
Fire risk 5/10 · Moderate
- Est. fire insurance / yr
- $947 – $1,759
Heat risk 8/10 · Major
- Hot days now (above 108°F)
- 7 days/yr
- Hot days in 30 yrs
- 20 days/yr
Wind risk 9/10 · Severe
- Chance of severe wind over 30 yrs
- 99.0%
Air-quality risk 1/10 · Minimal
- Unhealthy air days now
- 0 days/yr
- Unhealthy air days in 30 yrs
- 0 days/yr
Risk factors via First Street. Map © Google.
Why this score? — see what drove the C+ grade
The composite is a weighted blend of 9 inputs, each scored 0–100. Each bar is that input's sub-score; the figure is the points it added to the 100-point composite (weight × sub-score).
- Cash flow +27.5/30.0
- DSCR +9.6/10.0
- ARV discount +7.5/15.0
- 1% rule +7.4/10.0
- Schools +3.5/10.0
- Livability +3.2/5.0
- Rent growth +2.5/5.0
- Condition / age +2.5/5.0
- Appreciation +0.0/10.0
$144,900
🖨 Deal sheet 📄 Offer letter ✓ Due diligence
Listing remarks
FULLY REMODELED MANUFACTURES HOME. NO HOA. PROPERTY HAS NEW METAL ROOF, NEW MINI-SPLITS UNITS, NEW WATER HEATER, UPDATED PLUMBING AND ELECTRICAL SYSTEMS. NEW KITCHEN CABINETS AND COUNTERTOPS. NEW APPLIANCES AND EXTERIOR VINYL SIDING, LUXURY VINYL FLOORING THROUGHOUT. READY FOR A NEW OWER OR COULD BE A GREAT RENTAL PROPERTY AS WELL. PRIVATE WELL AND SEPTIC TANK. HOUSE NEXT DOOR FOR SALE AS WELL. CALL FOR A PRIVATE SHOWING!
Key facts
- 7,000 sq ft lot
- Built 1992
- Listed 41 days
Property features AI
Finance
- Other: Not homesteaded; Zoning: R-3
- HOA & community: No association
Exterior
- Parking: Driveway
- Utilities: Well water; Septic tank; Electricity connected; Cable available
- Home design: Residential manufactured home (single wide); One story; Faces west
- Construction: Vinyl siding; Metal roof; Crawlspace foundation; Built on a 0.16-acre lot (approximately 140 x 100)
- Exterior features: Private mailbox; Level, in-county lot; Asphalt road access (publicly maintained)
Interior
- Kitchen: Range; Range hood; Refrigerator
- Bedrooms: 3 bedrooms
- Bathrooms: 2 full bathrooms
- Heating & cooling: Ductless heating; Mini-split cooling
- Interior features: Eat-in kitchen; Kitchen/family room combo; Solid surface counters; Solid wood cabinets; Thermostat
- Laundry & utility: Laundry with corridor access; Electric water heater
Neighborhood map
What this means for you Summary
Snapshot
- This is a 3-bed/2.0-bath manufactured listed at $145k.
Deal economics
- At list price, monthly cash flow is $426 ($5k/yr) — positive.
- The deal already cash-flows at list — no discount required.
- Meets the 1% rule at list price ($2k rent vs $145k).
- Recommended offer: $141k (3.0% below list) — sets the bar for market timing.
Location & tenants
- Location reads 65/100 on livability (#638 in FL) — a middle-class / working-renter tenant base. Strengths: cost of living A+, housing A+, crime B+; Watch: employment D+, schools D, amenities F.
- Polk (suburban): math 39% / reading 43% proficiency, ranked #62 of 73 in FL (top 85%) — families likely to look elsewhere, expect single-tenant / working-renter base with shorter leases.
- Market conditions: 500 active listings in the ZIP; 2 comparable units currently listed for rent nearby; 10,384 units permitted in Polk County in 2024 (1,716 in 5+ unit buildings).
- This rent runs 38% of the median local income ($57k/yr) — at the standard rent-burdened threshold; future hikes will face affordability resistance.
Forward outlook
- Local home prices are declining (-3.0%/yr); year-one equity from $1k of loan paydown is wiped out by about $4k of value loss. Plan a longer hold.
- Polk County population projected at +33% by 2050 — long-run rental-demand tailwind backs the buy-and-hold thesis.
- At projected returns (-3.0% appreciation + 3.0% rent growth), your $41k cash investment doubles in ~9 years — after that, you're playing with house money.
Negotiation context
- It's been on market 41 days — a 3% lower offer ($141k) is reasonable based on typical stale-listing flexibility.
- 8 sale attempts since 21y ago with the ask held roughly flat each time — persistent listings suggest the price (not the market) is what's stuck; bring a comps-based counter.
- Current owner paid $55k; list at $145k implies a 163% gain — meaningful room to come down on a strong offer.
Risks & watch-outs
- Climate carrying-cost: severe wind risk, 99% chance of damaging wind over 30y; moderate wildfire risk; extreme-heat days projected 7→20/yr by 2055 (HVAC capex compounding) — expect insurance premiums to compound above CPI over the hold.
Questions for the listing agent
- It's been on market 41 days. Have you received any prior offers? Is the seller open to a 3% concession, seller financing, or rate buy-down credit?
- Is there a deadline driving the sale (1031 exchange, divorce, estate, relocation)? That informs how much negotiation room exists.
- Schools are D-rated, which usually means shorter tenancies and higher turnover. Who's the typical renter profile here, and what's been the actual vacancy rate?
- What's the average days-on-market for RENTAL listings here right now (not sales)? A rising rental-DOM trend means longer vacancies and softer asking-rent achievability than the comps imply.
- What's the recent tenant-quality profile in this submarket — average credit score on applications, eviction rate, late-payment / NSF rate, and stable-employment percentage? A property-management company in the area should have these aggregated.
- How much new for-sale + rental construction is in the pipeline within 1–3 miles? Heavy new supply typically softens prices + rents 12–24 months out; constrained supply supports both.
Investment metrics
- 1% rule
- 1.24% ✓
- Cap rate
- 9.82%
- Cash-on-cash
- 12.61%
- DSCR
- 1.56
- GRM
- 6.7
CMA / ARV
No comps found within radius.
Projected returns pro-forma
-3.0% appreciation · 3.0% rent growth · sell at horizon
- IRR
- 2.4%
- Equity multiple
- 1.09×
- Total profit
- $3,706
- Equity at exit
- $21,605
- IRR
- 12.0%
- Equity multiple
- 1.94×
- Total profit
- $38,304
- Equity at exit
- $12,528
Cash invested: $40,572 (down + closing). Projections, not guarantees.
Landlord ↔ Tenant lean methodology
- Overall (STATE)
- 87 Strongly Landlord-Friendly
- State Florida
- 87 Strongly Landlord-Friendly · R+3
- County
- — inherits STATE
- City
- — inherits STATE
ZIP-level market 33898
- Home prices YoY
- -15.1%
- Active inventory
- 500
- Price-to-rent
- 6.7×
Monthly cashflow live
- Estimated rent
- $1,804 medium interval (Pro) →
- Mortgage (P&I)
- −$760
- Tax from tax record
- −$178 /mo · $2,142/yr
- Insurance
- −$60
- HOA
- −$0
- Vacancy / Maint / Mgmt
- −$379
- Net cashflow
- $426
Break-even live
UW: 25.0% down · 7.5% · 30yr · 1.5% tax · 5.0% vac · 8.0% maint · 8.0% mgmt
Financing live
Cash to close
- Down payment
- $36,225
- Closing costs
- $4,347
- Reserves months
- —
- Total cash needed
- —
Loan-product check · same deal, 3 products live
Conventional
25% down · 7.5% · 30yr
- Down + closing
- —
- Monthly P&I
- —
- Monthly cashflow
- —
- DSCR
- —
- Eligible?
- —
Personal DTI + credit; lowest rate.
DSCR
20% down · 8.5% · 30yr
- Down + closing
- —
- Monthly P&I
- —
- Monthly cashflow
- —
- DSCR
- —
- Eligible?
- —
No personal income docs; deal must DSCR.
Hard money
10% down · 12.0% · 12mo
- Down + closing
- —
- Monthly P&I
- —
- Monthly cashflow
- —
- DSCR
- —
- Eligible?
- —
Short-term bridge; refi at stabilization.
Rent comps 2 comps
| Address | Beds | Baths | Sqft | Rent | $/sqft | DOM | Units | Dist |
|---|---|---|---|---|---|---|---|---|
| 5954 Skokie Rd Lake Wales, FL | 2.0 | 1.5 | 925 | $1,400 | $1.51 | 18d | 1 | 1.04mi |
| 2694 Chuck Wagon Way Lake Wales, FL | 2.0 | 2.0 | 924 | $1,400 | $1.52 | 14d | 1 | 1.38mi |
Listing history 30 events
-
2026-06-18days on market $144,900 Active 41 DOM
-
2026-06-17days on market $144,900 Active 40 DOM
-
2026-06-16days on market $144,900 Active 39 DOM
-
2026-06-15days on market $144,900 Active 38 DOM
-
2026-06-13days on market $144,900 Active 36 DOM
-
2026-06-10days on market $144,900 Active 33 DOM
-
2026-06-09days on market $144,900 Active 32 DOM
-
2026-06-08days on market $144,900 Active 31 DOM
-
2026-06-07days on market $144,900 Active 30 DOM
-
2026-06-05days on market $144,900 Active 27 DOM
-
2026-06-03days on market $144,900 Active 26 DOM
-
2026-06-03days on market $144,900 Active 25 DOM
-
2026-06-01days on market $144,900 Active 24 DOM
-
2026-05-31days on market $144,900 Active 23 DOM
-
2026-05-08$144,900 Active
-
2026-03-31historical
-
2026-03-20price $144,900
-
2026-01-29price $149,900
-
2025-11-30price $159,900
-
2025-10-07$169,900 Active
-
2024-09-24soldstatus $55,000
-
2010-11-02$64,900
-
2008-02-12$89,000
-
2006-12-12$115,000
-
2006-07-27$124,900
-
2005-11-10$89,900
-
2005-09-07soldstatus $45,000
-
2005-08-26soldstatus $45,000
-
2005-07-19$53,900
-
1995-10-27soldstatus $23,500
ⓘ Source: listings_history table (triggers on properties + properties_extension) + one-shot
backfill from property_details.listing_events for pre-trigger history.
Tax reassessment forecast FL · Resets to sale price
- Current annual tax
- $2,142 · $178/mo
- Projected year-2 tax
- $2,142 · $178/mo
- Expected delta
- $0/yr ($0/mo · 0.0%)
ⓘ Screening estimate from a state-policy table — verify with the county assessor before closing.
Climate risk First Street
- Flood 1/10 Low FEMA zone X (unshaded) · 0% chance over 30 yrs
- Wildfire 5/10 Major
- Heat 8/10 Severe 7 d/yr ≥108°F today · 20 d/yr by 30 yrs out
- Wind 9/10 Extreme 99% chance of damaging wind over 30 yrs
- Air quality 1/10 Low 0 unhealthy d/yr today · 0 by 30 yrs out
Nearby sold comps map
Loading sold comps map…
Walkable amenities ~0.75 mi
Loading nearby amenities…
Taxation est. · year 1
- Rental income
- $21,648
- − Mortgage interest
- −$8,117
- − Property taxes
- −$2,142
- − Insurance
- −$724
- − Repairs & maintenance
- −$1,732
- − Management
- −$1,732
- − Depreciation
- −$4,215
- Taxable income
- $2,986
- Est. tax owed @ 24.0%
- −$717
- After-tax cash flow
- $4,401/yr
For passive investors: Depreciation is non-cash, so a rental often shows a tax loss while cash-flowing — sheltering income. Rental losses are passive: they offset passive income freely, and up to $25,000/yr can offset ordinary (W-2) income if you actively participate and your MAGI is under $100k (phasing out to $0 by $150k); unused losses carry forward. On sale, claimed depreciation is recaptured at up to 25%, and gains may owe capital-gains tax (a 1031 exchange can defer both). Figures are a year-1 estimate at your 24.0% rate — not tax advice; consult a CPA.
Schools (NCES district)
- District
- Polk
- NCES district ID
- 1201590
- Math proficiency
- 39% ▼ -11.00%
- Reading proficiency
- 43% ▼ -4.00%
- Median HH income
- $43,979
- Composite
- 34.74/100
- National rank
- #5132
- State rank
- #62 of 73 in FL
Livability — Dundee
- Score
- 65/100
- State rank
- #638
- US rank
- #12542
Category grades
Schools grade is shown separately in the Schools card above.
Census & demographics
- County
- Polk County · 740,051 people
- City population
- 5,431
- Metro
- Lakeland-Winter Haven, FL
- Population (ZIP)
- 18,527
- Household income
- $57,224
- Rent vs Own
- Severe rent burden
- 148.0
Population outlook (Polk County) Hauer SSP2
- Today (2025)
- 752,975 people
- By 2030
- 804,621 · +6.9%
- By 2040
- 906,117 · +20.3%
- By 2050
- 1,000,476 · +32.9%
- By 2075
- 1,197,520 · +59.0%
- By 2100
- 1,271,518 · +68.9%
Race, ethnicity, and origin ACS 2023
- Neighborhood character
- Predominantly White (74%)
- Race & ethnicity
- White 74% Hispanic / Latino 17% Two or more races 10% Black 6%
- Hispanic origin (detail)
- Mexican 6% Puerto Rican 4% Cuban 3%
- Common ancestry
- Slovak 3% Lithuanian 2% Italian 2%
- Foreign-born
- 9% · Canada
- Languages at home
- 81% English-only · Spanish 17% French/Haitian/Cajun 1% Other Indo-European 1%
Political lean MEDSL · Polk
- 2024 margin
- Strong R (+20.7) · D 39.2% · R 59.9%
- 2008→2024 swing
- -14.6pp toward R · 2008: -6.1pp · 2024: -20.7pp
- All cycles
- 2024: R+20.7 2020: R+14.4 2016: R+14.1 2012: R+6.8 2008: R+6.1
Not yet ingested
- Civics
- —
Market trends
- HPI YoY
- ▼ -60.62%
- Current HPI
- 340.6056
- Rent YoY
- —
- Metro
- Lakeland-Winter Haven, FL
- State GDP YoY
- ▲ 3.28%
- F500 in state
- 36
Industry mix (Fortune 500 HQ in FL)
| Industry | F500 HQs | Revenue |
|---|---|---|
| Industrial Technology | 2 | $29B |
|
||
| Insurance | 2 | $17B |
|
||
| Retail | 1 | $60B |
|
||
| Technology Distribution | 1 | $58B |
|
||
| Homebuilding | 1 | $35B |
|
||
| Technology Manufacturing | 1 | $35B |
|
||
Price history
+516.6% since first listed16 events — show timeline
- 2026-05-08 Listed $144,900 Stellar MLS as Distributed by MLS Grid
- 2026-03-31 Listing Removed — Stellar MLS as Distributed by MLS Grid
- 2026-03-20 Price Changed $144,900 Stellar MLS as Distributed by MLS Grid
- 2026-01-29 Price Changed $149,900 Stellar MLS as Distributed by MLS Grid
- 2025-11-30 Price Changed $159,900 Stellar MLS as Distributed by MLS Grid
- 2025-10-07 Listed $169,900 Stellar MLS as Distributed by MLS Grid
- 2024-09-24 Sold (Public Records) $55,000 Public Records
- 2010-11-02 Listed $64,900 Stellar MLS as Distributed by MLS Grid
- 2008-02-12 Listed $89,000 Stellar MLS as Distributed by MLS Grid
- 2006-12-12 Listed $115,000 Stellar MLS as Distributed by MLS Grid
- 2006-07-27 Listed $124,900 Stellar MLS as Distributed by MLS Grid
- 2005-11-10 Listed $89,900 Stellar MLS as Distributed by MLS Grid
- 2005-09-07 Sold (Public Records) $45,000 Public Records
- 2005-08-26 Sold (MLS) $45,000 Stellar MLS as Distributed by MLS Grid
- 2005-07-19 Listed $53,900 Stellar MLS as Distributed by MLS Grid
- 1995-10-27 Sold (Public Records) $23,500 Public Records
Property tax history
+8.4%/yrLatest (2025): $2,142 · -14.6% YoY. Source: county tax records.
Cash-flow waterfall
monthlySold comps — $/sqft
last 12 mo · ≤1 miLoading sold comps…