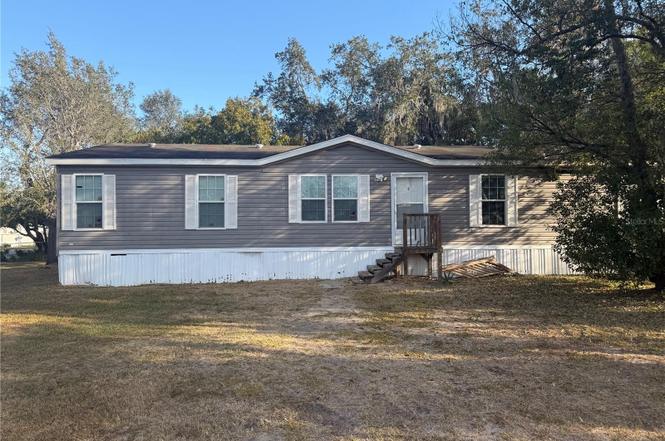
6412 Old Lake Wilson Rd · Loughman, FL
Flood risk 1/10 · Minimal
- FEMA flood zone
- X (unshaded)
- Chance of flooding over 30 yrs
- 0.0%
- Est. flood insurance / yr
- $507 – $1,088
Fire risk 4/10 · Minor
- Est. fire insurance / yr
- $947 – $1,759
Heat risk 8/10 · Major
- Hot days now (above 108°F)
- 7 days/yr
- Hot days in 30 yrs
- 24 days/yr
Wind risk 9/10 · Severe
- Chance of severe wind over 30 yrs
- 99.0%
Air-quality risk 1/10 · Minimal
- Unhealthy air days now
- 0 days/yr
- Unhealthy air days in 30 yrs
- 0 days/yr
Risk factors via First Street. Map © Google.
Why this score? — see what drove the C+ grade
The composite is a weighted blend of 9 inputs, each scored 0–100. Each bar is that input's sub-score; the figure is the points it added to the 100-point composite (weight × sub-score).
- Cash flow +24.9/30.0
- DSCR +8.1/10.0
- ARV discount +7.5/15.0
- 1% rule +5.7/10.0
- Appreciation +4.1/10.0
- Schools +3.5/10.0
- Livability +3.1/5.0
- Rent growth +2.5/5.0
- Condition / age +2.5/5.0
$229,000
🖨 Deal sheet 📄 Offer letter ✓ Due diligence
Listing remarks
* New on Market * 4 Bedroom - 2 Bathroom double wide mobile home on large lot. * Over 1600 sq ft. No HOA! 2018 Model in great condition. Laminate wood flooring, upgraded kitchen. Open floor plan. Great location close to I4 and Disney. Please schedule your showing today!
Key facts
- Open floor plan
- Large lot
- Upgraded kitchen
Tags
Neighborhood map
What this means for you Summary
Snapshot
- This is a 4-bed/2.0-bath manufactured listed at $229k.
Deal economics
- At list price, monthly cash flow is $495 ($6k/yr) — positive.
- The deal already cash-flows at list — no discount required.
- Meets the 1% rule at list price ($2k rent vs $229k).
- Cap rate 8.9% vs local median 3.8% in Loughman — top-decile yield for the area; either an underpriced asset or a hidden risk that comps aren't pricing in. Stress-test before assuming the spread holds.
Location & tenants
- Location reads 61/100 on livability (#781 in FL) — a middle-class / working-renter tenant base. Strengths: housing A+, crime A-; Watch: schools F, amenities F, commute F.
- Polk (suburban): math 39% / reading 43% proficiency, ranked #62 of 73 in FL (top 85%) — families likely to look elsewhere, expect single-tenant / working-renter base with shorter leases.
- Market conditions: Rents soft (-0.2%/yr); 773 active listings in the ZIP; 31 comparable units currently listed for rent nearby; rentals at typical pace (median 19d on market — plan ~3-4 weeks tenant-placement turnaround); 10,384 units permitted in Polk County in 2024 (1,716 in 5+ unit buildings).
- This rent runs 39% of the median local income ($75k/yr) — at the standard rent-burdened threshold; future hikes will face affordability resistance.
Forward outlook
- Local home prices are declining (-1.8%/yr); year-one equity from $2k of loan paydown is wiped out by about $4k of value loss. Plan a longer hold.
- Polk County population projected at +33% by 2050 — long-run rental-demand tailwind backs the buy-and-hold thesis.
Negotiation context
- Only 13 days on market — expect competitive offers; lowballing is unlikely to land.
- Current owner paid $38k; list at $229k implies a 503% gain — meaningful room to come down on a strong offer.
Risks & watch-outs
- Climate carrying-cost: severe wind risk, 99% chance of damaging wind over 30y; extreme-heat days projected 7→24/yr by 2055 (HVAC capex compounding) — expect insurance premiums to compound above CPI over the hold.
Questions for the listing agent
- Is there a deadline driving the sale (1031 exchange, divorce, estate, relocation)? That informs how much negotiation room exists.
- Schools are F-rated, which usually means shorter tenancies and higher turnover. Who's the typical renter profile here, and what's been the actual vacancy rate?
- What's the average days-on-market for RENTAL listings here right now (not sales)? A rising rental-DOM trend means longer vacancies and softer asking-rent achievability than the comps imply.
- What's the recent tenant-quality profile in this submarket — average credit score on applications, eviction rate, late-payment / NSF rate, and stable-employment percentage? A property-management company in the area should have these aggregated.
- How much new for-sale + rental construction is in the pipeline within 1–3 miles? Heavy new supply typically softens prices + rents 12–24 months out; constrained supply supports both.
Investment metrics
- 1% rule
- 1.07% ✓
- Cap rate
- 8.89%
- Cash-on-cash
- 9.26%
- DSCR
- 1.41
- GRM
- 7.8
CMA / ARV
No comps found within radius.
Projected returns pro-forma
-1.83% appreciation · 0.0% rent growth · sell at horizon
- IRR
- -0.5%
- Equity multiple
- 0.98×
- Total profit
- $-1,414
- Equity at exit
- $46,274
- IRR
- 4.4%
- Equity multiple
- 1.34×
- Total profit
- $21,673
- Equity at exit
- $41,274
Cash invested: $64,120 (down + closing). Projections, not guarantees.
Landlord ↔ Tenant lean methodology
- Overall (STATE)
- 87 Strongly Landlord-Friendly
- State Florida
- 87 Strongly Landlord-Friendly · R+3
- County
- — inherits STATE
- City
- — inherits STATE
ZIP-level market 33896
- Home prices YoY
- -0.8%
- Rents YoY
- -0.2%
- Active inventory
- 773
- Price-to-rent
- 7.8×
Monthly cashflow live
- Estimated rent
- $2,449 high interval (Pro) →
- Mortgage (P&I)
- −$1,201
- Tax from tax record
- −$143 /mo · $1,718/yr
- Insurance
- −$95
- HOA
- −$0
- Vacancy / Maint / Mgmt
- −$514
- Net cashflow
- $495
Break-even live
UW: 25.0% down · 7.5% · 30yr · 1.5% tax · 5.0% vac · 8.0% maint · 8.0% mgmt
Financing live
Cash to close
- Down payment
- $57,250
- Closing costs
- $6,870
- Reserves months
- —
- Total cash needed
- —
Loan-product check · same deal, 3 products live
Conventional
25% down · 7.5% · 30yr
- Down + closing
- —
- Monthly P&I
- —
- Monthly cashflow
- —
- DSCR
- —
- Eligible?
- —
Personal DTI + credit; lowest rate.
DSCR
20% down · 8.5% · 30yr
- Down + closing
- —
- Monthly P&I
- —
- Monthly cashflow
- —
- DSCR
- —
- Eligible?
- —
No personal income docs; deal must DSCR.
Hard money
10% down · 12.0% · 12mo
- Down + closing
- —
- Monthly P&I
- —
- Monthly cashflow
- —
- DSCR
- —
- Eligible?
- —
Short-term bridge; refi at stabilization.
Rent comps 31 comps
| Address | Beds | Baths | Sqft | Rent | $/sqft | DOM | Units | Dist |
|---|---|---|---|---|---|---|---|---|
| 333 Scrub Jay Way Davenport, FL | 4.0 | 3.0 | 1918 | $2,250 | $1.17 | 3d | 1 | 0.23mi |
| 248 Scrub Jay Way Davenport, FL | 3.0 | 3.0 | 1594 | $2,365 | $1.48 | 19d | 1 | 0.27mi |
| 165 Scrub Jay Way Davenport, FL | 5.0 | 3.0 | 1662 | $2,600 | $1.56 | 14d | 1 | 0.28mi |
| 356 Earlmont Pl Davenport, FL | 4.0 | 3.0 | 1597 | $2,550 | $1.60 | 23d | 1 | 0.28mi |
| 1737 Royal Ridge Dr Davenport, FL | 4.0 | 3.5 | 1746 | $2,500 | $1.43 | 23d | 1 | 0.34mi |
| 1126 Sandy Ridge Dr Davenport, FL | 5.0 | 3.0 | 1662 | $3,000 | $1.81 | 3d | 1 | 0.35mi |
| 205 Paradise Woods Pl Davenport, FL | 3.0 | 2.0 | 1232 | $2,149 | $1.74 | 14d | 1 | 0.41mi |
| 519 Thousand Oaks Blvd Davenport, FL | 3.0 | 2.0 | 1532 | $2,175 | $1.42 | 3d | 1 | 0.45mi |
| 1014 Cypress Pointe Blvd Davenport, FL | 5.0 | 4.0 | 2110 | $3,200 | $1.52 | 23d | 1 | 0.53mi |
| 136 Starbird Ct Davenport, FL | 4.0 | 3.0 | 1662 | $2,600 | $1.56 | 14d | 1 | 0.74mi |
| 376 Tanglewood Dr Davenport, FL | 4.0 | 2.0 | 1851 | $2,400 | $1.30 | 23d | 1 | 0.76mi |
| 1416 Thousand Oaks Blvd Davenport, FL | 4.0 | 3.0 | 1357 | $2,100 | $1.55 | 23d | 1 | 0.76mi |
| 289 Siesta Vista Ct Davenport, FL | 3.0 | 2.0 | 1815 | $2,100 | $1.16 | 23d | 1 | 0.80mi |
| 120 Reserve Dr Davenport, FL | 5.0 | 3.0 | 1790 | $2,500 | $1.40 | 23d | 1 | 1.02mi |
| 200 Village Blvd Davenport, FL | 1.0–3.0 | 1.0–2.0 | 1040 | $1,887 | $1.81 | 2d | 28 | 1.22mi |
| 231 Salamanca Rd Davenport, FL | 4.0 | 2.0 | 1840 | $2,120 | $1.15 | 23d | 1 | 1.27mi |
| 817 Terrace Ridge Cir #817 Davenport, FL | 3.0 | 2.0 | 1542 | $1,795 | $1.16 | 21d | 1 | 1.28mi |
| 818 Terrace Ridge Cir #818 Davenport, FL | 3.0 | 2.0 | 1542 | $2,300 | $1.49 | 14d | 1 | 1.28mi |
| 502 Viola Dr Davenport, FL | 5.0 | 4.0 | 2195 | $2,900 | $1.32 | 23d | 1 | 1.29mi |
| 151 Granada Blvd Davenport, FL | 4.0 | 3.0 | 2059 | $2,500 | $1.21 | 13d | 1 | 1.31mi |
| 260 Hamlet Loop Davenport, FL | 4.0 | 2.0 | 2100 | $2,500 | $1.19 | 2d | 1 | 1.32mi |
| 447 Arbor Lakes Dr Davenport, FL | 3.0 | 2.5 | 1507 | $1,850 | $1.23 | 21d | 1 | 1.34mi |
| 419 Arbor Lakes Dr Davenport, FL | 3.0 | 2.5 | 1724 | $1,900 | $1.10 | 23d | 1 | 1.34mi |
| 467 Arbor Lakes Dr Davenport, FL | 3.0 | 2.5 | 1507 | $1,825 | $1.21 | 23d | 1 | 1.35mi |
| 471 Arbor Lakes Dr Davenport, FL | 3.0 | 2.5 | 1724 | $1,980 | $1.15 | 11d | 1 | 1.35mi |
| 364 Arbor Lakes Dr Davenport, FL | 3.0 | 3.0 | 1724 | $1,890 | $1.10 | 13d | 1 | 1.42mi |
| 364 Arbor Lakes Dr Davenport, FL | 3.0 | 2.5 | 1674 | $1,890 | $1.13 | 23d | 1 | 1.42mi |
| 364 Arbor Lakes Dr Davenport, FL | 3.0 | 2.5 | 1724 | $1,890 | $1.10 | 14d | 1 | 1.42mi |
| 2110 Lynwind Blvd Davenport, FL | 1.0–3.0 | 1.0–2.0 | 1057 | $2,504 | $2.37 | 3d | 41 | 1.42mi |
| 1305 Farkleberry LN Davenport, FL | 1.0–3.0 | 1.0–2.0 | 1060 | $2,385 | $2.25 | 3d | 172 | 1.43mi |
| 241 Arbor Lakes Dr Davenport, FL | 3.0 | 2.5 | 1507 | $1,800 | $1.19 | 23d | 1 | 1.50mi |
Listing history 4 events
-
2025-12-07status Pending
-
2025-11-24$229,000 Active
-
2012-03-16soldstatus $38,000
-
2005-08-24soldstatus $67,000
ⓘ Source: listings_history table (triggers on properties + properties_extension) + one-shot
backfill from property_details.listing_events for pre-trigger history.
Tax reassessment forecast FL · Resets to sale price
- Current annual tax
- $1,718 · $143/mo
- Projected year-2 tax
- $1,901 · $158/mo
- Expected delta
- +$183/yr (+$15/mo · 10.6%)
ⓘ Screening estimate from a state-policy table — verify with the county assessor before closing.
Climate risk First Street
- Flood 1/10 Low FEMA zone X (unshaded) · 0% chance over 30 yrs
- Wildfire 4/10 Moderate
- Heat 8/10 Severe 7 d/yr ≥108°F today · 24 d/yr by 30 yrs out
- Wind 9/10 Extreme 99% chance of damaging wind over 30 yrs
- Air quality 1/10 Low 0 unhealthy d/yr today · 0 by 30 yrs out
Nearby sold comps map
Loading sold comps map…
Walkable amenities ~0.75 mi
Loading nearby amenities…
Taxation est. · year 1
- Rental income
- $29,383
- − Mortgage interest
- −$12,828
- − Property taxes
- −$1,718
- − Insurance
- −$1,145
- − Repairs & maintenance
- −$2,351
- − Management
- −$2,351
- − Depreciation
- −$6,662
- Taxable income
- $2,329
- Est. tax owed @ 24.0%
- −$559
- After-tax cash flow
- $5,380/yr
For passive investors: Depreciation is non-cash, so a rental often shows a tax loss while cash-flowing — sheltering income. Rental losses are passive: they offset passive income freely, and up to $25,000/yr can offset ordinary (W-2) income if you actively participate and your MAGI is under $100k (phasing out to $0 by $150k); unused losses carry forward. On sale, claimed depreciation is recaptured at up to 25%, and gains may owe capital-gains tax (a 1031 exchange can defer both). Figures are a year-1 estimate at your 24.0% rate — not tax advice; consult a CPA.
Schools (NCES district)
- District
- Polk
- NCES district ID
- 1201590
- Math proficiency
- 39% ▼ -11.00%
- Reading proficiency
- 43% ▼ -4.00%
- Median HH income
- $43,979
- Composite
- 34.74/100
- National rank
- #5132
- State rank
- #62 of 73 in FL
Livability — Loughman
- Score
- 61/100
- State rank
- #781
- US rank
- #17702
Category grades
Schools grade is shown separately in the Schools card above.
Census & demographics
- Census place
- Loughman, FL
- County
- Polk County · 740,051 people
- City population
- 23,652
- Metro
- Lakeland-Winter Haven, FL
- Population (ZIP)
- 26,731
- Household income
- $74,668
- Rent vs Own
- Severe rent burden
- 1490.0
Population outlook (Polk County) Hauer SSP2
- Today (2025)
- 752,975 people
- By 2030
- 804,621 · +6.9%
- By 2040
- 906,117 · +20.3%
- By 2050
- 1,000,476 · +32.9%
- By 2075
- 1,197,520 · +59.0%
- By 2100
- 1,271,518 · +68.9%
Race, ethnicity, and origin ACS 2023
- Neighborhood character
- Diverse neighborhood (Simpson 0.65)
- Race & ethnicity
- White 44% Hispanic / Latino 38% Two or more races 14% Black 10% Asian 2%
- Hispanic origin (detail)
- Mexican 2% Puerto Rican 15% Cuban 4% Dominican 3%
- Common ancestry
- Romanian 3% Estonian 2% Portuguese 2%
- Foreign-born
- 18% · Canada, Jamaica
- Languages at home
- 64% English-only · Spanish 31% Other Indo-European 2% Tagalog/Filipino 1%
Political lean MEDSL · Polk
- 2024 margin
- Strong R (+20.7) · D 39.2% · R 59.9%
- 2008→2024 swing
- -14.6pp toward R · 2008: -6.1pp · 2024: -20.7pp
- All cycles
- 2024: R+20.7 2020: R+14.4 2016: R+14.1 2012: R+6.8 2008: R+6.1
Not yet ingested
- Civics
- —
Market trends
- HPI YoY
- ▼ -1.83%
- Current HPI
- 219.4726
- Rent YoY
- ▼ -0.19%
- Metro
- Lakeland-Winter Haven, FL
- State GDP YoY
- ▲ 3.28%
- F500 in state
- 36
Industry mix (Fortune 500 HQ in FL)
| Industry | F500 HQs | Revenue |
|---|---|---|
| Industrial Technology | 2 | $29B |
|
||
| Insurance | 2 | $17B |
|
||
| Retail | 1 | $60B |
|
||
| Technology Distribution | 1 | $58B |
|
||
| Homebuilding | 1 | $35B |
|
||
| Technology Manufacturing | 1 | $35B |
|
||
Price history
+241.8% since first listed4 events — show timeline
- 2025-12-07 Pending — Stellar MLS as Distributed by MLS Grid
- 2025-11-24 Listed $229,000 Stellar MLS as Distributed by MLS Grid
- 2012-03-16 Sold (Public Records) $38,000 Public Records
- 2005-08-24 Sold (Public Records) $67,000 Public Records
Property tax history
+8.9%/yrLatest (2025): $1,718 · +10.0% YoY. Source: county tax records.
Cash-flow waterfall
monthlySold comps — $/sqft
last 12 mo · ≤1 miLoading sold comps…