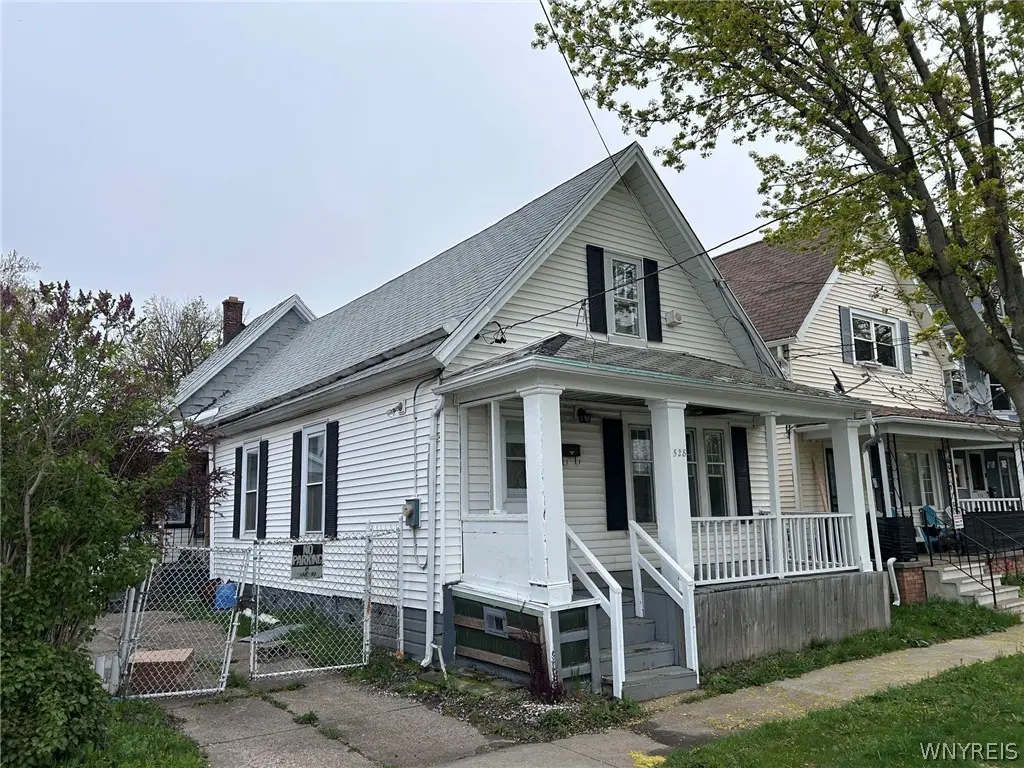
528 Fulton St · Buffalo, NY
Flood risk 7/10 · Major
- FEMA flood zone
- X (unshaded)
- Chance of flooding over 30 yrs
- 0.78%
- Est. flood insurance / yr
- $507 – $1,088
Fire risk 1/10 · Minimal
- Est. fire insurance / yr
- $691 – $1,283
Heat risk 3/10 · Minor
- Hot days now (above 91°F)
- 7 days/yr
- Hot days in 30 yrs
- 15 days/yr
Wind risk 1/10 · Minimal
- Chance of severe wind over 30 yrs
- —
Air-quality risk 4/10 · Minor
- Unhealthy air days now
- 4 days/yr
- Unhealthy air days in 30 yrs
- 9 days/yr
Risk factors via First Street. Map © Google.
Why this score? — see what drove the A grade
The composite is a weighted blend of 9 inputs, each scored 0–100. Each bar is that input's sub-score; the figure is the points it added to the 100-point composite (weight × sub-score).
- Cash flow +30.0/30.0
- ARV discount +15.0/15.0
- 1% rule +10.0/10.0
- DSCR +10.0/10.0
- Appreciation +10.0/10.0
- Rent growth +5.0/5.0
- Livability +3.9/5.0
- Schools +3.3/10.0
- Condition / age +2.5/5.0
$90,000
🖨 Deal sheet (PDF) 📄 Offer letter ✓ Due diligence
Listing remarks
Affordable living in the heart of Buffalo’s First Ward! Welcome to 528 Fulton Street—this 3-bedroom, 1-bath home offers a spacious living area, formal dining room, and an eat-in kitchen with plenty of potential. Recent mechanical updates include a hot water tank (2025) and furnace (2024), adding peace of mind for the next owner. Exterior features include low-maintenance vinyl siding, and a generous driveway with a storage shed for added convenience. Great for owner occupant or investment. Showings begin immediately
Key facts
- Hot water tank
- Formal dining room
- Spacious living area
Tags
Property features AI
Exterior
- Parking: No garage
- Utilities: Electricity connected; Public water connected; Sewer connected
- Home design: Single-story; Resale property
- Construction: Vinyl siding; PEX plumbing; Asphalt roof; Pillar/post/pier foundation; Built (existing)
- Exterior features: Concrete driveway; Open porch
Interior
- Kitchen: Gas oven; Gas range
- Bedrooms: Three bedrooms (all on the main level)
- Flooring: Vinyl; Varied flooring
- Bathrooms: One full bathroom (on the main level)
- Heating & cooling: Forced air heating; Gas heating
- Interior features: Living/dining room; Bedroom on main level; Crawl space basement
- Laundry & utility: Gas water heater
Neighborhood map
What this means for you Summary
Snapshot
- This is a 3-bed/1.0-bath single-family listed at $90k.
Deal economics
- At list price, monthly cash flow is $841 ($10k/yr) — positive.
- The deal already cash-flows at list — no discount required.
- Meets the 1% rule at list price ($2k rent vs $90k).
- Recommended offer: $87k (3.0% below list) — sets the bar for market timing.
- Cap rate 18.4% vs local median 8.0% in Buffalo — top-decile yield for the area; either an underpriced asset or a hidden risk that comps aren't pricing in. Stress-test before assuming the spread holds.
Location & tenants
- Location reads 77/100 on livability (#195 in NY, #3,011 nationally) — a middle-class / working-renter tenant base. Strengths: commute A+, housing A+, health & safety A+; Watch: crime F, employment D-.
- Buffalo City School District (urban): math 41% / reading 40% proficiency, ranked #535 of 590 in NY (top 91%) — families likely to look elsewhere, expect single-tenant / working-renter base with shorter leases; 75% free/reduced lunch — lower-income household profile, screen leases tightly.
- Zoned schools: International School (math 8% / reading 17%, grade F, #2,048 of 2,108 statewide, top 97%, 981 students, 92% FRL); Hutchinson Central Technical High School (math 96% / reading 32%, grade B-, #807 of 1,100 statewide, top 73%, 1,175 students, 78% FRL).
- Market conditions: Rents rising fast (+12.7%/yr); 94 active listings in the ZIP; 12 comparable units currently listed for rent nearby; rentals at typical pace (median 17d on market — plan ~3-4 weeks tenant-placement turnaround); 1,244 units permitted in Erie County in 2024 (563 in 5+ unit buildings).
- This rent runs 40% of the median local income ($54k/yr) — at the standard rent-burdened threshold; future hikes will face affordability resistance.
Forward outlook
- In year one you build about $10k of equity ($622 loan paydown + $9k appreciation (10.0% local appreciation)).
- At projected returns (10.0% appreciation + 8.0% rent growth), your $25k cash investment doubles in ~2 years — after that, you're playing with house money.
- By year 4, paydown + projected appreciation supports a ~$34k cash-out refi (75% LTV) — recoverable capital for the next deal without selling this one.
Negotiation context
- It's been on market 50 days — a 3% lower offer ($87k) is reasonable based on typical stale-listing flexibility.
Risks & watch-outs
- Watch-outs: flood insurance adds $66/mo; built in 1915 — expect roof / HVAC / electrical / plumbing capex.
- Climate carrying-cost: major flood risk — expect insurance premiums to compound above CPI over the hold.
Questions for the listing agent
- It's been on market 50 days. Have you received any prior offers? Is the seller open to a 3% concession, seller financing, or rate buy-down credit?
- Built in 1915 — when were the roof, HVAC, electrical panel, plumbing, and water heater last replaced?
- What's the actual annual flood-insurance premium (NFIP or private), and is the property in a SFHA with mandatory coverage?
- Is there a deadline driving the sale (1031 exchange, divorce, estate, relocation)? That informs how much negotiation room exists.
- Crime grade is F in this area — have there been break-ins, vandalism, or insurance claims at this property in the last 3 years? What carrier currently insures it and at what premium?
- What's the average days-on-market for RENTAL listings here right now (not sales)? A rising rental-DOM trend means longer vacancies and softer asking-rent achievability than the comps imply.
- What's the recent tenant-quality profile in this submarket — average credit score on applications, eviction rate, late-payment / NSF rate, and stable-employment percentage? A property-management company in the area should have these aggregated.
- How much new for-sale + rental construction is in the pipeline within 1–3 miles? Heavy new supply typically softens prices + rents 12–24 months out; constrained supply supports both.
Investment metrics
- 1% rule
- 2.02% ✓
- Cap rate
- 18.40%
- Cash-on-cash
- 43.22%
- DSCR
- 2.92
- GRM
- 4.1
CMA / ARV
- ARV (median comp)
- $147,670
- List price
- $90,000
- Delta
- -39.05%
- Verdict
- UNDERPRICED
- Comps
- 20 within 1.0 mi
Show comp detail 8 sales within ~0.75 mi
| Address | Dist | Beds/Ba | Sqft | Sold | Price | $/sf | Match |
|---|---|---|---|---|---|---|---|
| 33 Owahn Pl | 0.43mi | 3/1.0 | 998 (-5%) | 2mo | $130,750 | $131 | 70 |
| 225 Alabama St | 0.46mi | 4/1.0 (+1) | 1,055 (+0%) | 7mo | $50,000 | $47 | 67 |
| 17 Clifford St | 0.38mi | 3/1.0 | 1,040 (-1%) | 20mo | $55,000 | $53 | 64 |
| 190 Hamburg St | 0.40mi | 3/1.0 | 980 (-7%) | 18mo | $130,000 | $133 | 55 |
| 160 Selkirk St | 0.50mi | 4/1.0 (+1) | 1,171 (+12%) | 7mo | $150,000 | $128 | 47 |
| 444 S Division St Unit N | 0.74mi | 3/1.0 | 1,028 (-2%) | 19mo | $200,000 | $195 | 46 |
| 118 Smith St | 0.39mi | 2/1.0 (-1) | 902 (-14%) | 18mo | $135,000 | $150 | 39 |
| 136 Tennessee St | 0.63mi | 3/1.0 | 1,196 (+14%) | 10mo | $75,000 | $63 | 39 |
Match score weights: distance 35% · size 25% · config 20% · recency 20%. Top-matched comps best support the ARV.
Projected returns pro-forma
10.0% appreciation · 8.0% rent growth · sell at horizon
- IRR
- 58.7%
- Equity multiple
- 5.45×
- Total profit
- $112,227
- Equity at exit
- $81,079
- IRR
- 54.3%
- Equity multiple
- 13.39×
- Total profit
- $312,219
- Equity at exit
- $174,850
Cash invested: $25,200 (down + closing). Projections, not guarantees.
Landlord ↔ Tenant lean methodology
- Overall (STATE)
- 15 Strongly Tenant-Friendly
- State New York
- 15 Strongly Tenant-Friendly · D+10
- County
- — inherits STATE
- City
- — inherits STATE
ZIP-level market 14210
- Home prices YoY
- 13.8%
- Rents YoY
- 12.7%
- Active inventory
- 94
- Price-to-rent
- 4.1×
Monthly cashflow live
- Estimated rent
- $1,821 high interval (Pro) →
- Mortgage (P&I)
- −$472
- Tax from tax record
- −$21 /mo · $254/yr
- Insurance
- −$38
- Flood insurance flood zone
- −$66 /mo · $798/yr
- HOA
- −$0
- Vacancy / Maint / Mgmt
- −$382
- Net cashflow
- $841
Break-even live
Sensitivity live
| Price | -10% $892 | -5% $867 | +0% $841 | +5% $816 | +10% $790 |
|---|---|---|---|---|---|
| Rent | -10% $697 | -5% $769 | +0% $841 | +5% $913 | +10% $985 |
| Rate | -1.0pp $887 | -0.5pp $864 | base $841 | +0.5pp $818 | +1.0pp $794 |
UW: 25.0% down · 7.5% · 30yr · 1.5% tax · 5.0% vac · 8.0% maint · 8.0% mgmt
Financing live
Cash to close
- Down payment
- $22,500
- Closing costs
- $2,700
- Reserves months
- —
- Total cash needed
- —
Loan-product check · same deal, 3 products live
Conventional
25% down · 7.5% · 30yr
- Down + closing
- —
- Monthly P&I
- —
- Monthly cashflow
- —
- DSCR
- —
- Eligible?
- —
Personal DTI + credit; lowest rate.
DSCR
20% down · 8.5% · 30yr
- Down + closing
- —
- Monthly P&I
- —
- Monthly cashflow
- —
- DSCR
- —
- Eligible?
- —
No personal income docs; deal must DSCR.
Hard money
10% down · 12.0% · 12mo
- Down + closing
- —
- Monthly P&I
- —
- Monthly cashflow
- —
- DSCR
- —
- Eligible?
- —
Short-term bridge; refi at stabilization.
Rent comps 12 comps
| Address | Beds | Baths | Sqft | Rent | $/sqft | DOM | Units | Dist |
|---|---|---|---|---|---|---|---|---|
| 141 Vandalia St Unit Lower back Buffalo, NY | 2.0 | 1.0 | 850 | $1,075 | $1.26 | 45d | 1 | 0.46mi |
| 140 Seymour St Unit First Floor Buffalo, NY | 2.0 | 1.0 | 1300 | $1,800 | $1.38 | 5d | 1 | 0.48mi |
| 140 Seymour St Buffalo, NY | 2.0 | 1.0 | 1300 | $1,800 | $1.38 | 25d | 1 | 0.48mi |
| 225 Louisiana St Buffalo, NY | 1.0–3.0 | 1.0–2.0 | 1164 | $2,653 | $2.28 | 3d | 7 | 0.71mi |
| 230 Scott St Buffalo, NY | 1.0–2.0 | 1.0–2.0 | 1285 | $2,325 | $1.81 | 3d | 4 | 0.84mi |
| 149 Swan St #404 Buffalo, NY | 2.0 | 2.0 | 1237 | $2,050 | $1.66 | 13d | 1 | 1.13mi |
| 149 Swan St #404 Buffalo, NY | 2.0 | 2.0 | 1237 | $2,100 | $1.70 | 25d | 1 | 1.13mi |
| 47 Lester St Unit Main Floor Buffalo, NY | 3.0 | 1.0 | 900 | $1,000 | $1.11 | 45d | 1 | 1.21mi |
| 237 Main St Buffalo, NY | 1.0–3.0 | 1.5–2.5 | 1608 | $4,035 | $2.51 | 3d | 9 | 1.38mi |
| 700 Hopkins St Buffalo, NY | 3.0 | 1.0 | 1100 | $1,225 | $1.11 | 16d | 1 | 1.40mi |
| 696 Hopkins St Unit 2 Buffalo, NY | 2.0 | 1.0 | 750 | $950 | $1.27 | 45d | 1 | 1.40mi |
| 465 Washington St Buffalo, NY | 1.0–2.0 | 1.0–2.0 | 1388 | $2,285 | $1.65 | 4d | 5 | 1.50mi |
Listing history 17 events
-
2026-06-21days on market $90,000 Active 50 DOM
-
2026-06-18days on market $90,000 Active 47 DOM
-
2026-06-17days on market $90,000 Active 46 DOM
-
2026-06-16days on market $90,000 Active 45 DOM
-
2026-06-15days on market $90,000 Active 44 DOM
-
2026-06-13days on market $90,000 Active 42 DOM
-
2026-06-13days on market $90,000 Active 41 DOM
-
2026-06-10days on market $90,000 Active 39 DOM
-
2026-06-09days on market $90,000 Active 38 DOM
-
2026-06-08days on market $90,000 Active 37 DOM
-
2026-06-07days on market $90,000 Active 36 DOM
-
2026-06-03days on market $90,000 Active 32 DOM
-
2026-06-02days on market $90,000 Active 31 DOM
-
2026-06-01days on market $90,000 Active 30 DOM
-
2026-06-01price $90,000 Active 29 DOM
-
2026-05-31days on market $100,000 Active 29 DOM
-
2026-05-01$100,000 Active 532-char remark
ⓘ Source: listings_history table (triggers on properties + properties_extension) + one-shot
backfill from property_details.listing_events for pre-trigger history.
Tax reassessment forecast NY · Partial reset (capped growth)
- Current annual tax
- $254 · $21/mo
- Projected year-2 tax
- $888 · $74/mo
- Expected delta
- +$633/yr (+$53/mo · 249.1%)
ⓘ Screening estimate from a state-policy table — verify with the county assessor before closing.
Climate risk First Street
- Flood 7/10 Severe FEMA zone X (unshaded) · 78% chance over 30 yrs
- Wildfire 1/10 Low
- Heat 3/10 Moderate 7 d/yr ≥91°F today · 15 d/yr by 30 yrs out
- Wind 1/10 Low
- Air quality 4/10 Moderate 4 unhealthy d/yr today · 9 by 30 yrs out
Nearby sold comps map
Loading sold comps map…
Walkable amenities ~0.75 mi
Loading nearby amenities…
Taxation est. · year 1
- Rental income
- $21,848
- − Mortgage interest
- −$5,041
- − Property taxes
- −$254
- − Insurance
- −$1,248
- − Repairs & maintenance
- −$1,748
- − Management
- −$1,748
- − Depreciation
- −$2,618
- Taxable income
- $9,191
- Est. tax owed @ 24.0%
- −$2,206
- After-tax cash flow
- $7,889/yr
For passive investors: Depreciation is non-cash, so a rental often shows a tax loss while cash-flowing — sheltering income. Rental losses are passive: they offset passive income freely, and up to $25,000/yr can offset ordinary (W-2) income if you actively participate and your MAGI is under $100k (phasing out to $0 by $150k); unused losses carry forward. On sale, claimed depreciation is recaptured at up to 25%, and gains may owe capital-gains tax (a 1031 exchange can defer both). Figures are a year-1 estimate at your 24.0% rate — not tax advice; consult a CPA.
Schools (NCES district)
- District
- Buffalo City School District
- NCES district ID
- 3605850
- Math proficiency
- 41% ▲ 11.00%
- Reading proficiency
- 40% ▲ 7.00%
- Median HH income
- $31,665
- Composite
- 33.17/100
- National rank
- #5544
- State rank
- #535 of 590 in NY
Livability — Buffalo
- Score
- 77/100
- State rank
- #195
- US rank
- #3011
Category grades
Schools grade is shown separately in the Schools card above.
Census & demographics
- Census place
- Buffalo, NY
- County
- Erie County · 714,559 people
- City population
- 440,021
- Metro
- Buffalo-Cheektowaga, NY
- Population (ZIP)
- 15,563
- Household income
- $54,197
- Rent vs Own
- Severe rent burden
- 959.0
Population outlook (Erie County) Hauer SSP2
- Today (2025)
- 933,037 people
- By 2030
- 935,181 · +0.2%
- By 2040
- 928,531 · -0.5%
- By 2050
- 905,725 · -2.9%
- By 2075
- 834,037 · -10.6%
- By 2100
- 708,033 · -24.1%
Race, ethnicity, and origin ACS 2023
- Neighborhood character
- Predominantly White (79%)
- Race & ethnicity
- White 79% Two or more races 8% Black 8% Hispanic / Latino 7% Asian 1%
- Hispanic origin (detail)
- Puerto Rican 6%
- Common ancestry
- Romanian 21% Lithuanian 2% Serbian 1%
- Foreign-born
- 2% · Canada, China
- Languages at home
- 95% English-only · Spanish 2% Arabic 1% Other Indo-European 1%
Political lean MEDSL · Erie
- 2024 margin
- Lean D (+9.7) · D 54.8% · R 45.2%
- 2008→2024 swing
- -7.9pp toward R · 2008: 17.5pp · 2024: 9.7pp
- All cycles
- 2024: D+9.7 2020: D+14.7 2016: D+4.8 2012: D+15.6 2008: D+17.5
Not yet ingested
- Civics
- —
Market trends
- HPI YoY
- ▲ 52.34%
- Current HPI
- 431.7951
- Rent YoY
- ▲ 12.67%
- Metro
- Buffalo-Cheektowaga, NY
- State GDP YoY
- ▲ 2.60%
- F500 in state
- 92
Industry mix (Fortune 500 HQ in NY)
| Industry | F500 HQs | Revenue |
|---|---|---|
| Financial Services | 10 | $950B |
|
||
| Consumer Goods | 9 | $162B |
|
||
| Insurance | 4 | $225B |
|
||
| Telecommunications | 2 | $144B |
|
||
| Pharmaceuticals | 2 | $112B |
|
||
| Media / Entertainment | 2 | $69B |
|
||
Price history
-10.0% since first listed2 events — show timeline
- 2026-05-31 Price Changed $90,000 WNYREIS
- 2026-05-01 Listed $100,000 WNYREIS
Property tax history
+8.4%/yrLatest (2025): $254 · +37.5% YoY. Source: county tax records.
Cash-flow waterfall
monthlySold comps — $/sqft
last 12 mo · ≤1 miLoading sold comps…