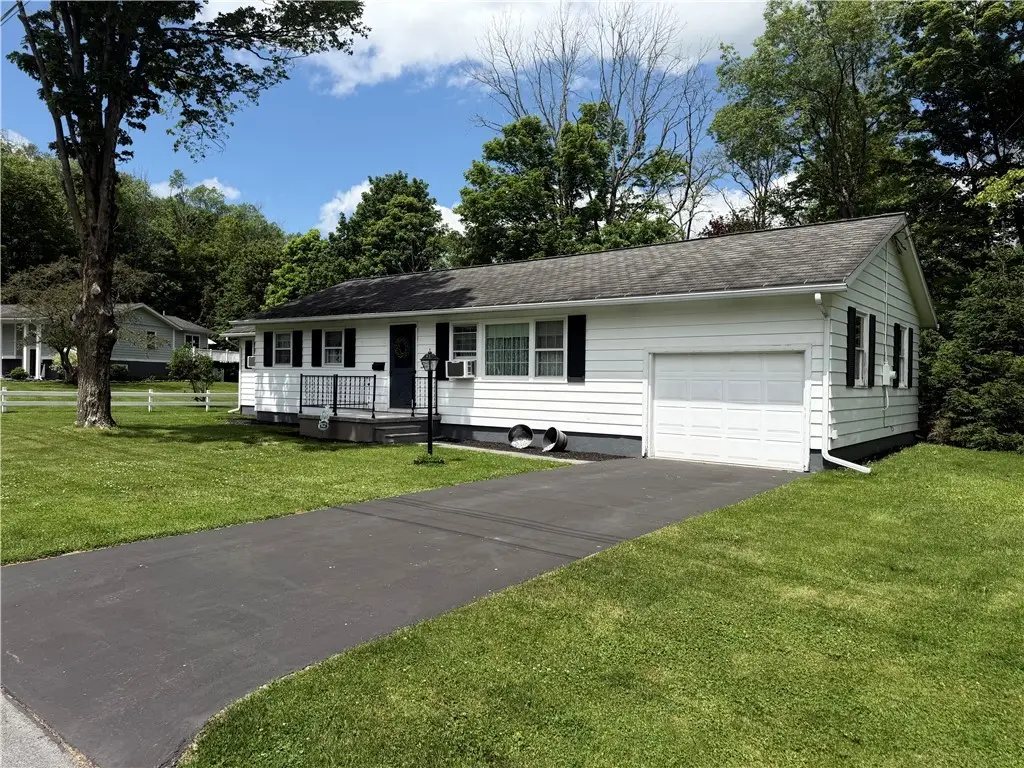
10 Flynn St · Walton, NY
Flood risk 1/10 · Minimal
- FEMA flood zone
- X (unshaded)
- Chance of flooding over 30 yrs
- 0.0%
- Est. flood insurance / yr
- $473 – $860
Fire risk 1/10 · Minimal
- Est. fire insurance / yr
- $691 – $1,283
Heat risk 2/10 · Minimal
- Hot days now (above 90°F)
- 8 days/yr
- Hot days in 30 yrs
- 18 days/yr
Wind risk 2/10 · Minimal
- Chance of severe wind over 30 yrs
- 1.0%
Air-quality risk 2/10 · Minimal
- Unhealthy air days now
- 0 days/yr
- Unhealthy air days in 30 yrs
- 1 days/yr
Risk factors via First Street. Map © Google.
Why this score? — see what drove the B- grade
The composite is a weighted blend of 9 inputs, each scored 0–100. Each bar is that input's sub-score; the figure is the points it added to the 100-point composite (weight × sub-score).
- Cash flow +26.1/30.0
- DSCR +8.8/10.0
- Appreciation +7.9/10.0
- ARV discount +7.5/15.0
- 1% rule +7.1/10.0
- Schools +3.5/10.0
- Livability +3.5/5.0
- Rent growth +2.5/5.0
- Condition / age +2.5/5.0
$239,000
🖨 Deal sheet 📄 Offer letter ✓ Due diligence
Listing remarks
A very beautiful 3-bedroom home with two full baths, newly installed laminate flooring throughout, and a spacious attached garage This home is immaculate and on a cul-de-sac with only 6 homes on the street. This is also located close to conveniences, a Village Park, and fine dining. The blacktop driveway is beautiful and makes easy access to the house. There is also a newly installed large deck in the back of the house which is perfect for entertaining and relaxing. There is also a very beautiful large basement which could be used for entertaining or storage area. This is a gorgeous home!
Key facts
- Blacktop driveway
- Large basement
- Cul-de-sac
Tags
Property features AI
Exterior
- Parking: Attached garage with 2 spaces; Garage includes electricity and storage
- Utilities: Electricity connected; Public water connected; Sewer connected
- Home design: One-story single-family home; Existing construction
- Construction: Frame construction with vinyl siding; Asphalt roof; Poured foundation and slab
- Exterior features: Blacktop driveway; Deck; Property on a cul-de-sac; Rectangular lot (approx. 0.3 acre, dimensions 106 x 150); Frontage on a main thoroughfare
Interior
- Kitchen: Dishwasher; Electric cooktop; Microwave; Refrigerator
- Bedrooms: 3 main-level bedrooms
- Flooring: Hardwood; Laminate; Varies
- Bathrooms: 2 full bathrooms (both on the main level)
- Heating & cooling: Electric baseboard heating; Window air conditioning units
- Interior features: Eat-in kitchen; Pull-down attic stairs; Full basement
- Laundry & utility: Laundry in basement; Gas water heater
Neighborhood map
What this means for you Summary
Snapshot
- This is a 3-bed/2.0-bath single-family listed at $239k.
Deal economics
- At list price, monthly cash flow is $599 ($7k/yr) — positive.
- The deal already cash-flows at list — no discount required.
- Meets the 1% rule at list price ($3k rent vs $239k).
Location & tenants
- Location reads 70/100 on livability (#443 in NY) — a middle-class / working-renter tenant base. Strengths: cost of living A+, health & safety A+; Watch: schools D+, amenities F, commute F.
- Walton Central School District (town): math 36% / reading 47% proficiency, ranked #510 of 590 in NY (top 86%) — families likely to look elsewhere, expect single-tenant / working-renter base with shorter leases.
- Market conditions: 57 active listings in the ZIP; 66 units permitted in Delaware County in 2024 (0 in 5+ unit buildings).
Forward outlook
- In year one you build about $16k of equity ($2k loan paydown + $14k appreciation (5.8% local appreciation)).
- Delaware County population projected at -27% by 2050 — secular population decline; favor cash flow + early exit over multi-decade hold.
- At projected returns (5.8% appreciation + 3.0% rent growth), your $67k cash investment doubles in ~3 years — after that, you're playing with house money.
- By year 3, paydown + projected appreciation supports a ~$38k cash-out refi (75% LTV) — recoverable capital for the next deal without selling this one.
Negotiation context
- Only 9 days on market — expect competitive offers; lowballing is unlikely to land.
Questions for the listing agent
- Built in 1974 — when were the roof, HVAC, electrical panel, plumbing, and water heater last replaced?
- Is there a deadline driving the sale (1031 exchange, divorce, estate, relocation)? That informs how much negotiation room exists.
- Schools are D-rated, which usually means shorter tenancies and higher turnover. Who's the typical renter profile here, and what's been the actual vacancy rate?
- What's the average days-on-market for RENTAL listings here right now (not sales)? A rising rental-DOM trend means longer vacancies and softer asking-rent achievability than the comps imply.
- What's the recent tenant-quality profile in this submarket — average credit score on applications, eviction rate, late-payment / NSF rate, and stable-employment percentage? A property-management company in the area should have these aggregated.
- How much new for-sale + rental construction is in the pipeline within 1–3 miles? Heavy new supply typically softens prices + rents 12–24 months out; constrained supply supports both.
Investment metrics
- 1% rule
- 1.21% ✓
- Cap rate
- 9.30%
- Cash-on-cash
- 10.74%
- DSCR
- 1.48
- GRM
- 6.9
CMA / ARV
- ARV (on-the-fly)
- $104,832
- Comps found
- 9
Show comp detail 9 sales within ~0.75 mi
| Address | Dist | Beds/Ba | Sqft | Sold | Price | $/sf | Match |
|---|---|---|---|---|---|---|---|
| 82 Saint John St | 0.09mi | 4/2.0 (+1) | 1,408 (+5%) | 3mo | $110,000 | $78 | 80 |
| 79 Liberty St | 0.21mi | 3/2.0 | 1,440 (+7%) | 1mo | $267,500 | $186 | 77 |
| 57 Liberty St | 0.31mi | 4/2.0 (+1) | 1,431 (+6%) | 14mo | $65,000 | $45 | 58 |
| 211 Old Prospect Ave | 0.72mi | 3/2.0 | 1,365 (+2%) | 11mo | $140,000 | $103 | 55 |
| 13 Liberty St | 0.53mi | 3/1.0 | 1,400 (+4%) | 14mo | $37,000 | $26 | 53 |
| 5 Ogden St | 0.57mi | 3/1.0 | 1,320 (-2%) | 18mo | $62,000 | $47 | 52 |
| 23 Shepard St | 0.28mi | 3/1.0 | 1,160 (-14%) | 12mo | $35,000 | $30 | 50 |
| 82 Griswold St | 0.42mi | 3/1.0 | 1,188 (-12%) | 12mo | $132,355 | $111 | 47 |
| 81 Park St | 0.55mi | 3/1.5 | 1,536 (+14%) | 19mo | $230,000 | $150 | 33 |
Match score weights: distance 35% · size 25% · config 20% · recency 20%. Top-matched comps best support the ARV.
Projected returns pro-forma
5.79% appreciation · 3.0% rent growth · sell at horizon
- IRR
- 23.8%
- Equity multiple
- 2.56×
- Total profit
- $104,289
- Equity at exit
- $147,146
- IRR
- 22.7%
- Equity multiple
- 5.15×
- Total profit
- $277,834
- Equity at exit
- $264,207
Cash invested: $66,920 (down + closing). Projections, not guarantees.
Landlord ↔ Tenant lean methodology
- Overall (STATE)
- 15 Strongly Tenant-Friendly
- State New York
- 15 Strongly Tenant-Friendly · D+10
- County
- — inherits STATE
- City
- — inherits STATE
ZIP-level market 13856
- Home prices YoY
- 1.8%
- Active inventory
- 57
- Price-to-rent
- 6.9×
Monthly cashflow live
- Estimated rent
- $2,893 medium interval (Pro) →
- Mortgage (P&I)
- −$1,253
- Tax from tax record
- −$334 /mo · $4,005/yr
- Insurance
- −$100
- HOA
- −$0
- Vacancy / Maint / Mgmt
- −$608
- Net cashflow
- $599
Break-even live
UW: 25.0% down · 7.5% · 30yr · 1.5% tax · 5.0% vac · 8.0% maint · 8.0% mgmt
Financing live
Cash to close
- Down payment
- $59,750
- Closing costs
- $7,170
- Reserves months
- —
- Total cash needed
- —
Loan-product check · same deal, 3 products live
Conventional
25% down · 7.5% · 30yr
- Down + closing
- —
- Monthly P&I
- —
- Monthly cashflow
- —
- DSCR
- —
- Eligible?
- —
Personal DTI + credit; lowest rate.
DSCR
20% down · 8.5% · 30yr
- Down + closing
- —
- Monthly P&I
- —
- Monthly cashflow
- —
- DSCR
- —
- Eligible?
- —
No personal income docs; deal must DSCR.
Hard money
10% down · 12.0% · 12mo
- Down + closing
- —
- Monthly P&I
- —
- Monthly cashflow
- —
- DSCR
- —
- Eligible?
- —
Short-term bridge; refi at stabilization.
Listing history 7 events
-
2026-06-12statusdays on market $239,000 Pending 9 DOM
-
2026-06-09days on market $239,000 Active 7 DOM
-
2026-06-08days on market $239,000 Active 6 DOM
-
2026-06-07days on market $239,000 Active 5 DOM
-
2026-06-07days on market $239,000 Active 4 DOM
-
2026-06-03remarks 595-char remark
-
2026-06-03$239,000 Active 1 DOM
ⓘ Source: listings_history table (triggers on properties + properties_extension) + one-shot
backfill from property_details.listing_events for pre-trigger history.
Tax reassessment forecast NY · Partial reset (capped growth)
- Current annual tax
- $4,005 · $334/mo
- Projected year-2 tax
- $4,022 · $335/mo
- Expected delta
- +$17/yr (+$1/mo · 0.4%)
ⓘ Screening estimate from a state-policy table — verify with the county assessor before closing.
Climate risk First Street
- Flood 1/10 Low FEMA zone X (unshaded) · 0% chance over 30 yrs
- Wildfire 1/10 Low
- Heat 2/10 Low 8 d/yr ≥90°F today · 18 d/yr by 30 yrs out
- Wind 2/10 Low 100% chance of damaging wind over 30 yrs
- Air quality 2/10 Low 0 unhealthy d/yr today · 1 by 30 yrs out
Nearby sold comps map
Loading sold comps map…
Walkable amenities ~0.75 mi
Loading nearby amenities…
Taxation est. · year 1
- Rental income
- $34,714
- − Mortgage interest
- −$13,388
- − Property taxes
- −$4,005
- − Insurance
- −$1,195
- − Repairs & maintenance
- −$2,777
- − Management
- −$2,777
- − Depreciation
- −$6,953
- Taxable income
- $3,620
- Est. tax owed @ 24.0%
- −$869
- After-tax cash flow
- $6,316/yr
For passive investors: Depreciation is non-cash, so a rental often shows a tax loss while cash-flowing — sheltering income. Rental losses are passive: they offset passive income freely, and up to $25,000/yr can offset ordinary (W-2) income if you actively participate and your MAGI is under $100k (phasing out to $0 by $150k); unused losses carry forward. On sale, claimed depreciation is recaptured at up to 25%, and gains may owe capital-gains tax (a 1031 exchange can defer both). Figures are a year-1 estimate at your 24.0% rate — not tax advice; consult a CPA.
Schools (NCES district)
- District
- Walton Central School District
- NCES district ID
- 3629820
- Math proficiency
- 36% ▬ 0.00%
- Reading proficiency
- 47% ▲ 3.00%
- Median HH income
- $41,231
- Composite
- 34.86/100
- National rank
- #5088
- State rank
- #510 of 590 in NY
Livability — Walton
- Score
- 70/100
- State rank
- #443
- US rank
- #7789
Category grades
Schools grade is shown separately in the Schools card above.
Census & demographics
- Census place
- Walton, NY
- Population (ZIP)
- 5,915
Population outlook (Delaware County) Hauer SSP2
- Today (2025)
- 42,668 people
- By 2030
- 40,337 · -5.5%
- By 2040
- 35,514 · -16.8%
- By 2050
- 31,265 · -26.7%
- By 2075
- 24,455 · -42.7%
- By 2100
- 19,529 · -54.2%
Race, ethnicity, and origin ACS 2023
- Neighborhood character
- Predominantly White (90%)
- Race & ethnicity
- White 90% Black 5% Two or more races 5% Hispanic / Latino 2%
- Common ancestry
- Iranian 7% Slovak 3% Lithuanian 3%
- Foreign-born
- 3% · Canada, Philippines
- Languages at home
- 94% English-only · Spanish 2% Other Indo-European 1% French/Haitian/Cajun 1%
Political lean MEDSL · Delaware
- 2024 margin
- R (+19.8) · D 40.1% · R 59.9%
- 2008→2024 swing
- -14.6pp toward R · 2008: -5.2pp · 2024: -19.8pp
- All cycles
- 2024: R+19.8 2020: R+18.4 2016: R+29.2 2012: R+9.6 2008: R+5.2
Not yet ingested
- Civics
- —
Market trends
- HPI YoY
- ▲ 5.79%
- Current HPI
- 331.9799
- Rent YoY
- —
- Metro
- —
- State GDP YoY
- ▲ 2.60%
- F500 in state
- 92
Industry mix (Fortune 500 HQ in NY)
| Industry | F500 HQs | Revenue |
|---|---|---|
| Financial Services | 10 | $950B |
|
||
| Consumer Goods | 9 | $162B |
|
||
| Insurance | 4 | $225B |
|
||
| Telecommunications | 2 | $144B |
|
||
| Pharmaceuticals | 2 | $112B |
|
||
| Media / Entertainment | 2 | $69B |
|
||
Price history
1 event — show timeline
- 2026-06-02 Listed $239,000 UNYREIS
Property tax history
+1.7%/yrLatest (2025): $4,005 · -0.6% YoY. Source: county tax records.
Cash-flow waterfall
monthlySold comps — $/sqft
last 12 mo · ≤1 miLoading sold comps…