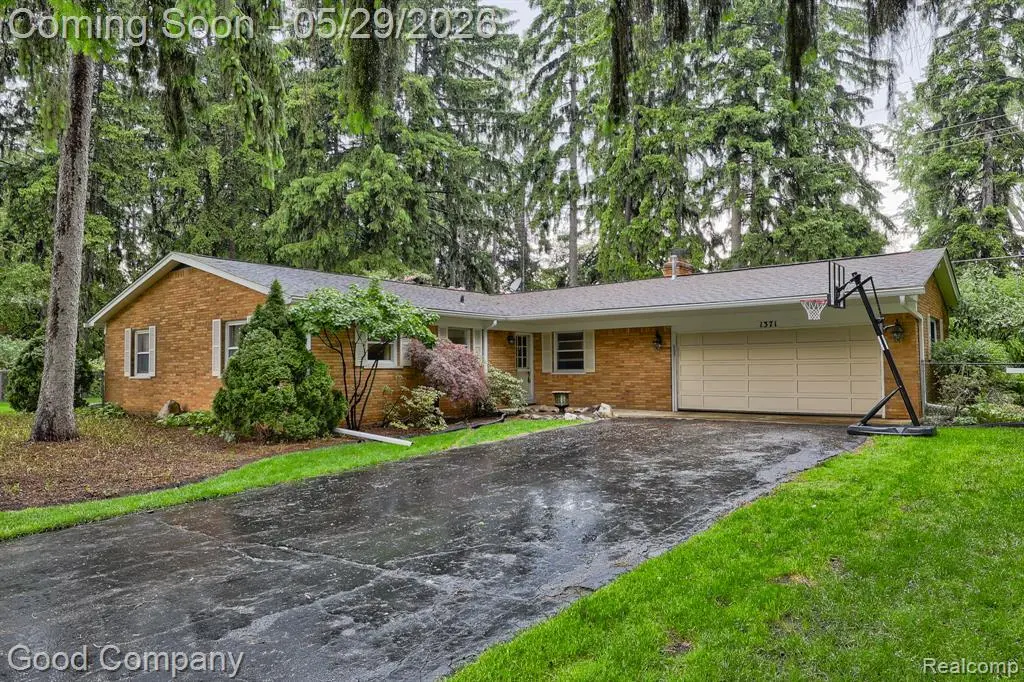
1371 Winchcombe Dr · Auburn Hills, MI
Flood risk 1/10 · Minimal
- FEMA flood zone
- X (unshaded)
- Chance of flooding over 30 yrs
- 0.0%
- Est. flood insurance / yr
- $473 – $860
Fire risk 1/10 · Minimal
- Est. fire insurance / yr
- $784 – $1,456
Heat risk 2/10 · Minimal
- Hot days now (above 98°F)
- 7 days/yr
- Hot days in 30 yrs
- 15 days/yr
Wind risk 2/10 · Minimal
- Chance of severe wind over 30 yrs
- —
Air-quality risk 3/10 · Minor
- Unhealthy air days now
- 2 days/yr
- Unhealthy air days in 30 yrs
- 5 days/yr
Risk factors via First Street. Map © Google.
Why this score? — see what drove the C+ grade
The composite is a weighted blend of 9 inputs, each scored 0–100. Each bar is that input's sub-score; the figure is the points it added to the 100-point composite (weight × sub-score).
- Cash flow +25.4/30.0
- ARV discount +8.9/15.0
- DSCR +8.4/10.0
- 1% rule +6.3/10.0
- Livability +3.8/5.0
- Schools +3.7/10.0
- Rent growth +2.5/5.0
- Condition / age +2.5/5.0
- Appreciation +0.0/10.0
$299,900
🖨 Deal sheet 📄 Offer letter ✓ Due diligence
Listing remarks
* * * All offers are due Monday, June 1, 2026 at 12:00PM. * * * Wonderful brick ranch in Bloomfield Hills with a spacious floor plan, cozy family room, full basement, and a stunning backyard oasis on a large, beautifully landscaped lot. Bright living room with a large picture window and crown molding flows into an open dining area featuring a chandelier and ceiling medallion. Roomy kitchen with wood cabinetry, ample counter space, and a window over the sink. Family room features hardwood floors, a beautiful brick fireplace, a sliding door to the back patio, and access to the attached two-car garage. Large primary bedroom includes an en suite full bath with retro pink tile. Second bedro
Key facts
- 0.52 acre lot
- 2 garage spots
- Built 1964
Property features AI
Exterior
- Parking: Attached 2-car garage
- Utilities: Public water; Natural gas for heat and water heater
- Home design: Residential single-story home; Built in 1964; Entry-level primary living spaces; Frontage approximately 150 feet; Lot about 0.52 acres
- Construction: Brick construction; Basement foundation
- Exterior features: Brick exterior; Fenced yard; Patio; Porch; Paved street
Interior
- Kitchen: Kitchen on the entry level (approx. 12 x 10); Dishwasher; Disposal; Microwave; Range/Oven
- Bedrooms: Three bedrooms on the entry level (approx. 15 x 12; 11 x 11; ~9')
- Bathrooms: Two full bathrooms on the entry level (bathroom sizes ~8 x 5 and ~8 x 7)
- Heating & cooling: Baseboard heating; Natural gas heating/fuel
- Interior features: Fireplace (family room, natural); Unfinished basement
- Laundry & utility: Washer and dryer included; Gas water heater
Neighborhood map
What this means for you Summary
Snapshot
- This is a 3-bed/2.0-bath single-family listed at $300k.
Deal economics
- At list price, monthly cash flow is $693 ($8k/yr) — positive.
- The deal already cash-flows at list — no discount required.
- Meets the 1% rule at list price ($3k rent vs $300k).
- Cap rate 9.1% vs local median 4.3% in Auburn Hills — top-decile yield for the area; either an underpriced asset or a hidden risk that comps aren't pricing in. Stress-test before assuming the spread holds.
Location & tenants
- Location reads 76/100 on livability (#151 in MI, #3,766 nationally) — a middle-class / working-renter tenant base. Strengths: commute A+, cost of living A+, housing A+; Watch: crime D+, schools D, amenities F.
- Avondale School District (suburban): math 34% / reading 48% proficiency, ranked #162 of 540 in MI (top 30%) — families likely to look elsewhere, expect single-tenant / working-renter base with shorter leases.
- Market conditions: 128 active listings in the ZIP; 6 comparable units currently listed for rent nearby; rentals leasing fast (median 2d on market — plan ~1-2 weeks tenant-placement turnaround); high-income renter base; 2,614 units permitted in Oakland County in 2024 (721 in 5+ unit buildings).
Forward outlook
- Local home prices are declining (-3.0%/yr); year-one equity from $2k of loan paydown is wiped out by about $9k of value loss. Plan a longer hold.
- Oakland County population projected at +10% by 2050 — modest demand growth; plan on rents tracking national, not racing it.
Negotiation context
- Only 5 days on market — expect competitive offers; lowballing is unlikely to land.
- Current owner paid $221k; 36% above their basis — modest negotiation headroom, anchor on the comps not their cost.
Questions for the listing agent
- Built in 1964 — when were the roof, HVAC, electrical panel, plumbing, and water heater last replaced?
- Is there a deadline driving the sale (1031 exchange, divorce, estate, relocation)? That informs how much negotiation room exists.
- Schools are D-rated, which usually means shorter tenancies and higher turnover. Who's the typical renter profile here, and what's been the actual vacancy rate?
- Crime grade is D in this area — have there been break-ins, vandalism, or insurance claims at this property in the last 3 years? What carrier currently insures it and at what premium?
- What's the average days-on-market for RENTAL listings here right now (not sales)? A rising rental-DOM trend means longer vacancies and softer asking-rent achievability than the comps imply.
- What's the recent tenant-quality profile in this submarket — average credit score on applications, eviction rate, late-payment / NSF rate, and stable-employment percentage? A property-management company in the area should have these aggregated.
- How much new for-sale + rental construction is in the pipeline within 1–3 miles? Heavy new supply typically softens prices + rents 12–24 months out; constrained supply supports both.
Investment metrics
- 1% rule
- 1.13% ✓
- Cap rate
- 9.07%
- Cash-on-cash
- 9.90%
- DSCR
- 1.44
- GRM
- 7.4
CMA / ARV
- ARV (on-the-fly)
- $309,379
- Comps found
- 12
Show comp detail 12 sales within ~0.75 mi
| Address | Dist | Beds/Ba | Sqft | Sold | Price | $/sf | Match |
|---|---|---|---|---|---|---|---|
| 1371 Winchcombe Dr | 0.00mi | 3/2.0 | 1,603 (0%) | 0mo | $315,000 | $197 | 100 |
| 1299 Winchcombe Dr | 0.17mi | 3/2.0 | 1,589 (-1%) | 5mo | $350,000 | $220 | 87 |
| 1310 Winchcombe Dr | 0.15mi | 3/1.5 | 1,589 (-1%) | 10mo | $390,000 | $245 | 81 |
| 903 Coughlan St | 0.30mi | 3/2.0 | 1,667 (+4%) | 19mo | $275,000 | $165 | 63 |
| 575 S Briarvale Dr | 0.54mi | 3/1.5 | 1,484 (-7%) | 1mo | $286,000 | $193 | 60 |
| 3221 Bessie St | 0.70mi | 3/1.5 | 1,534 (-4%) | 6mo | $305,000 | $199 | 53 |
| 1530 Ashover Dr | 0.36mi | 3/2.0 | 1,827 (+14%) | 10mo | $427,400 | $234 | 52 |
| 306 Oakmont | 0.67mi | 2/2.0 (-1) | 1,556 (-3%) | 15mo | $235,000 | $151 | 46 |
| 915 S Squirrel Rd | 0.58mi | 2/2.0 (-1) | 1,489 (-7%) | 15mo | $265,000 | $178 | 44 |
| 3929 N Briarvale Rd | 0.53mi | 4/2.0 (+1) | 1,726 (+8%) | 22mo | $326,000 | $189 | 39 |
| 225 Oakmont | 0.73mi | 3/2.0 | 1,496 (-7%) | 20mo | $285,000 | $191 | 38 |
| 295 Oakmont St | 0.67mi | 3/2.5 | 1,766 (+10%) | 14mo | $285,500 | $162 | 38 |
Match score weights: distance 35% · size 25% · config 20% · recency 20%. Top-matched comps best support the ARV.
Projected returns pro-forma
-3.0% appreciation · 3.0% rent growth · sell at horizon
- IRR
- -1.4%
- Equity multiple
- 0.95×
- Total profit
- $-4,479
- Equity at exit
- $44,716
- IRR
- 8.3%
- Equity multiple
- 1.63×
- Total profit
- $52,880
- Equity at exit
- $25,930
Cash invested: $83,972 (down + closing). Projections, not guarantees.
Landlord ↔ Tenant lean methodology
- Overall (STATE)
- 62 Landlord-Friendly
- State Michigan
- 62 Landlord-Friendly · EVEN
- County
- — inherits STATE
- City
- — inherits STATE
ZIP-level market 48304
- Active inventory
- 128
- Price-to-rent
- 7.4×
Monthly cashflow live
- Estimated rent
- $3,375 high interval (Pro) →
- Mortgage (P&I)
- −$1,573
- Tax from tax record
- −$276 /mo · $3,310/yr
- Insurance
- −$125
- HOA
- −$0
- Vacancy / Maint / Mgmt
- −$709
- Net cashflow
- $693
Break-even live
UW: 25.0% down · 7.5% · 30yr · 1.5% tax · 5.0% vac · 8.0% maint · 8.0% mgmt
Financing live
Cash to close
- Down payment
- $74,975
- Closing costs
- $8,997
- Reserves months
- —
- Total cash needed
- —
Loan-product check · same deal, 3 products live
Conventional
25% down · 7.5% · 30yr
- Down + closing
- —
- Monthly P&I
- —
- Monthly cashflow
- —
- DSCR
- —
- Eligible?
- —
Personal DTI + credit; lowest rate.
DSCR
20% down · 8.5% · 30yr
- Down + closing
- —
- Monthly P&I
- —
- Monthly cashflow
- —
- DSCR
- —
- Eligible?
- —
No personal income docs; deal must DSCR.
Hard money
10% down · 12.0% · 12mo
- Down + closing
- —
- Monthly P&I
- —
- Monthly cashflow
- —
- DSCR
- —
- Eligible?
- —
Short-term bridge; refi at stabilization.
Rent comps 6 comps
| Address | Beds | Baths | Sqft | Rent | $/sqft | DOM | Units | Dist |
|---|---|---|---|---|---|---|---|---|
| 3200 South Blvd Bloomfield Hills, MI | 2.0–3.0 | 2.0 | 1782 | $4,250 | $2.38 | 2d | 1 | 0.67mi |
| 920 Heritage Dr Bloomfield Township, MI | 2.0 | 2.0 | 1804 | $3,600 | $2.00 | 2d | 1 | 0.71mi |
| 124 Optimist Auburn Hills, MI | 2.0–3.0 | 2.0–2.5 | 1914 | $3,535 | $1.85 | 2d | 9 | 1.17mi |
| 192 Raleigh Ave Auburn Hills, MI | 2.0 | 2.0 | 1700 | $2,400 | $1.41 | 44d | 1 | 1.25mi |
| 201 N Squirrel Rd Auburn Hills, MI | 2.0–3.0 | 2.5–3.0 | 1475 | $2,320 | $1.57 | 2d | 14 | 1.36mi |
| 676 Sheffield Rd Auburn Hills, MI | 3.0 | 1.5 | 1421 | $2,495 | $1.76 | 2d | 1 | 1.40mi |
Listing history 7 events
-
2026-06-02statusdays on market $299,900 Pending 5 DOM
-
2026-06-01days on market $299,900 Active 4 DOM
-
2026-05-31days on market $299,900 Active 3 DOM
-
2026-05-22historical $299,900
-
2000-08-30soldstatus $221,000
-
2000-08-07soldstatus $221,000
-
2000-07-02$219,900
ⓘ Source: listings_history table (triggers on properties + properties_extension) + one-shot
backfill from property_details.listing_events for pre-trigger history.
Tax reassessment forecast MI · Partial reset (capped growth)
- Current annual tax
- $3,310 · $276/mo
- Projected year-2 tax
- $3,964 · $330/mo
- Expected delta
- +$654/yr (+$55/mo · 19.8%)
ⓘ Screening estimate from a state-policy table — verify with the county assessor before closing.
Climate risk First Street
- Flood 1/10 Low FEMA zone X (unshaded) · 0% chance over 30 yrs
- Wildfire 1/10 Low
- Heat 2/10 Low 7 d/yr ≥98°F today · 15 d/yr by 30 yrs out
- Wind 2/10 Low
- Air quality 3/10 Moderate 2 unhealthy d/yr today · 5 by 30 yrs out
Nearby sold comps map
Loading sold comps map…
Walkable amenities ~0.75 mi
Loading nearby amenities…
Taxation est. · year 1
- Rental income
- $40,501
- − Mortgage interest
- −$16,799
- − Property taxes
- −$3,310
- − Insurance
- −$1,500
- − Repairs & maintenance
- −$3,240
- − Management
- −$3,240
- − Depreciation
- −$8,724
- Taxable income
- $3,688
- Est. tax owed @ 24.0%
- −$885
- After-tax cash flow
- $7,429/yr
For passive investors: Depreciation is non-cash, so a rental often shows a tax loss while cash-flowing — sheltering income. Rental losses are passive: they offset passive income freely, and up to $25,000/yr can offset ordinary (W-2) income if you actively participate and your MAGI is under $100k (phasing out to $0 by $150k); unused losses carry forward. On sale, claimed depreciation is recaptured at up to 25%, and gains may owe capital-gains tax (a 1031 exchange can defer both). Figures are a year-1 estimate at your 24.0% rate — not tax advice; consult a CPA.
Schools (NCES district)
- District
- Avondale School District
- NCES district ID
- 2603690
- Math proficiency
- 34% ▼ -8.00%
- Reading proficiency
- 48% ▼ -4.00%
- Median HH income
- $71,549
- Composite
- 37.33/100
- National rank
- #4442
- State rank
- #162 of 540 in MI
Livability — Auburn Hills
- Score
- 76/100
- State rank
- #151
- US rank
- #3766
Category grades
Schools grade is shown separately in the Schools card above.
Census & demographics
- County
- Oakland County · 1,009,092 people
- City population
- 24,514
- Metro
- Detroit-Warren-Dearborn, MI
- Population (ZIP)
- 17,387
- Household income
- $143,204
- Rent vs Own
- Severe rent burden
- 85.0
Population outlook (Oakland County) Hauer SSP2
- Today (2025)
- 1,335,747 people
- By 2030
- 1,375,100 · +2.9%
- By 2040
- 1,435,385 · +7.5%
- By 2050
- 1,469,250 · +10.0%
- By 2075
- 1,531,946 · +14.7%
- By 2100
- 1,450,485 · +8.6%
Race, ethnicity, and origin ACS 2023
- Neighborhood character
- Predominantly White (79%)
- Race & ethnicity
- White 79% Asian 10% Two or more races 4% Black 4% Hispanic / Latino 2%
- Common ancestry
- Romanian 6% Lithuanian 3% Slovak 2%
- Foreign-born
- 17% · China, Canada, South Korea
- Languages at home
- 79% English-only · Other Indo-European 6% Arabic 5% Other Asian/Pacific 3%
Political lean MEDSL · Oakland
- 2024 margin
- D (+10.6) · D 54.4% · R 43.8% · Other 1.9%
- 2008→2024 swing
- -3.9pp toward R · 2008: 14.5pp · 2024: 10.6pp
- All cycles
- 2024: D+10.6 2020: D+14.1 2016: D+8.1 2012: D+8.1 2008: D+14.5
Not yet ingested
- Civics
- —
Market trends
- HPI YoY
- ▼ -195.96%
- Current HPI
- 160.6477
- Rent YoY
- —
- Metro
- Detroit-Warren-Dearborn, MI
- State GDP YoY
- ▲ 1.37%
- F500 in state
- 28
Industry mix (Fortune 500 HQ in MI)
| Industry | F500 HQs | Revenue |
|---|---|---|
| Automotive Parts | 3 | $48B |
|
||
| Automotive | 2 | $372B |
|
||
| Chemicals | 1 | $45B |
|
||
| Automotive Retail | 1 | $29B |
|
||
| Healthcare / Medical Devices | 1 | $23B |
|
||
| Automotive Technology | 1 | $20B |
|
||
Price history
+36.4% since first listed4 events — show timeline
- 2026-05-22 Coming Soon $299,900 MiRealSource-MiMLS
- 2000-08-30 Sold (Public Records) $221,000 Public Records
- 2000-08-07 Sold (MLS) $221,000 REALCOMP
- 2000-07-02 Listed $219,900 REALCOMP
Property tax history
+2.1%/yrLatest (2025): $3,310 · +2.7% YoY. Source: county tax records.
Cash-flow waterfall
monthlySold comps — $/sqft
last 12 mo · ≤1 miLoading sold comps…