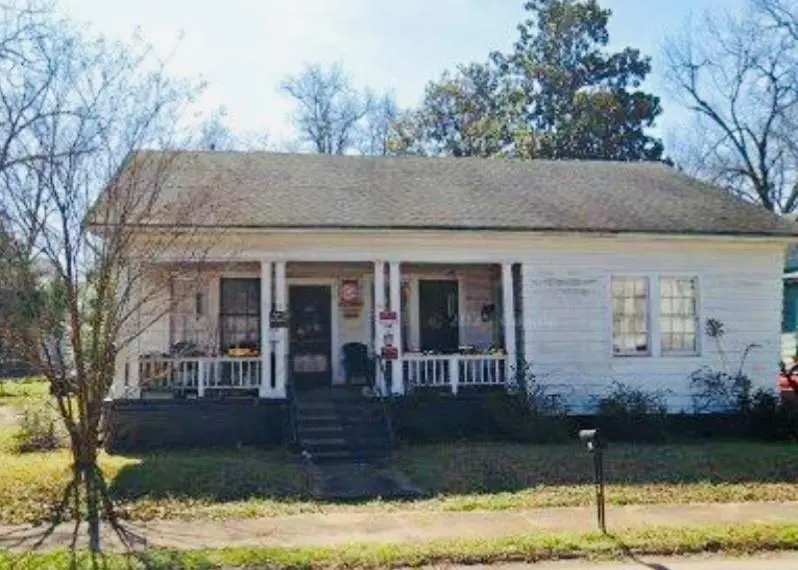
1016 Nicholson · Richland, GA
Flood risk 1/10 · Minimal
- FEMA flood zone
- X (unshaded)
- Chance of flooding over 30 yrs
- 0.0%
- Est. flood insurance / yr
- $507 – $1,088
Fire risk 5/10 · Moderate
- Est. fire insurance / yr
- $963 – $1,789
Heat risk 7/10 · Major
- Hot days now (above 107°F)
- 7 days/yr
- Hot days in 30 yrs
- 18 days/yr
Wind risk 8/10 · Major
- Chance of severe wind over 30 yrs
- 80.0%
Air-quality risk 2/10 · Minimal
- Unhealthy air days now
- 2 days/yr
- Unhealthy air days in 30 yrs
- 2 days/yr
Risk factors via First Street. Map © Google.
Why this score? — see what drove the A- grade
The composite is a weighted blend of 9 inputs, each scored 0–100. Each bar is that input's sub-score; the figure is the points it added to the 100-point composite (weight × sub-score).
- Cash flow +30.0/30.0
- ARV discount +15.0/15.0
- 1% rule +10.0/10.0
- DSCR +10.0/10.0
- Appreciation +5.0/10.0
- Livability +3.0/5.0
- Schools +2.7/10.0
- Rent growth +2.5/5.0
- Condition / age +2.5/5.0
$59,999
🖨 Deal sheet 📄 Offer letter ✓ Due diligence
Listing remarks MLS
Seller Motivated To Sell! Attention investors and value-add buyers! This historic 3-bedroom, 3-bath home offers approximately 1,773 square feet of living space on a corner lot in the heart of Richland, Georgia. Originally built in 1925, the property features spacious rooms, a large front porch and a detached outbuilding for additional storage or potential utility. The home sits on approximately 0.37 acres. With its solid footprint, vintage character, and strong rental or resale potential, this property presents an excellent opportunity for investors seeking to expand their portfolio in a growing Southwest Georgia market. The corner-lot location provides added visibility and accessibility, while the home's generous layout creates multiple options for renovation and value enhancement. Whether you're looking for a long-term rental, fix-and-flip project, or affordable investment property with upside potential, 1016 Nicholson Street offers the chance to acquire a sizable home at an attractive price point. Bring your vision and unlock the potential of this unique investment opportunity.
Key facts
- Vintage character
- Large front porch
- Detached outbuilding
Tags
Property features AI
Exterior
- Parking: Driveway; Open parking available
- Utilities: Public water; Public sewer; Electricity available; Natural gas available; Cable available; Phone available; Underground utilities
- Home design: Single-level (one story); Resale property; Deed book legal description available
- Construction: Wood siding; Composition roof; Block foundation
- Exterior features: Front porch; City street frontage; Asphalt road access
Interior
- Kitchen: Electric cooktop; No additional kitchen features listed
- Bedrooms: Three main-level bedrooms
- Flooring: Hardwood flooring
- Bathrooms: Three full bathrooms (all on the main level); Master bath has no special features listed
- Heating & cooling: Central heating; Ceiling fan(s) for cooling
- Interior features: Other interior features; No common walls; Den; Crawl space basement
- Laundry & utility: Laundry in common area
Neighborhood map
What this means for you Summary
Snapshot
- This is a 3-bed/3.0-bath single-family listed at $60k.
Deal economics
- At list price, monthly cash flow is $710 ($9k/yr) — positive.
- The deal already cash-flows at list — no discount required.
- Meets the 1% rule at list price ($1k rent vs $60k).
Location & tenants
- Location reads 59/100 on livability (#410 in GA) — a working-class tenant base; expect higher turnover. Strengths: cost of living A+, housing A+, crime A; Watch: amenities F, commute F, employment F.
- Stewart County (rural): math 35% / reading 26% proficiency, ranked #141 of 187 in GA (top 75%) — families likely to look elsewhere, expect single-tenant / working-renter base with shorter leases; 87% free/reduced lunch — lower-income household profile, screen leases tightly.
- Zoned schools: Stewart County Elementary School (math 8% / reading 12%, grade F, #1,092 of 1,228 statewide, top 91%, 192 students, 100% FRL); Stewart County Middle School (math 17% / reading 27%, grade F, #333 of 470 statewide, top 72%, 96 students, 100% FRL); Stewart County High School (math 10% / reading 30%, grade F, #232 of 424 statewide, top 56%, 119 students, 100% FRL).
- Zoned-school proficiency averages 17% at this address vs 30% district-wide (-13 pts) — the specific schools serving this property underperform the Stewart County average; the district grade overstates school quality for this exact location.
- Market conditions: 12 active listings in the ZIP; 2 units permitted in Stewart County in 2024 (0 in 5+ unit buildings).
Forward outlook
- In year one you build about $2k of equity ($415 loan paydown + $2k appreciation (3.0% local appreciation)).
- Stewart County population projected at +10% by 2050 — modest demand growth; plan on rents tracking national, not racing it.
- At projected returns (3.0% appreciation + 3.0% rent growth), your $17k cash investment doubles in ~2 years — after that, you're playing with house money.
Negotiation context
- Only 10 days on market — expect competitive offers; lowballing is unlikely to land.
- 4 sale attempts since 3y ago with the ask held roughly flat each time — persistent listings suggest the price (not the market) is what's stuck; bring a comps-based counter.
Risks & watch-outs
- Watch-outs: built in 1925 — expect roof / HVAC / electrical / plumbing capex.
- Climate carrying-cost: severe wind risk, 80% chance of damaging wind over 30y; moderate wildfire risk; extreme-heat days projected 7→18/yr by 2055 (HVAC capex compounding) — expect insurance premiums to compound above CPI over the hold.
Questions for the listing agent
- Built in 1925 — when were the roof, HVAC, electrical panel, plumbing, and water heater last replaced?
- Is there a deadline driving the sale (1031 exchange, divorce, estate, relocation)? That informs how much negotiation room exists.
- Schools are F-rated, which usually means shorter tenancies and higher turnover. Who's the typical renter profile here, and what's been the actual vacancy rate?
- What's the average days-on-market for RENTAL listings here right now (not sales)? A rising rental-DOM trend means longer vacancies and softer asking-rent achievability than the comps imply.
- What's the recent tenant-quality profile in this submarket — average credit score on applications, eviction rate, late-payment / NSF rate, and stable-employment percentage? A property-management company in the area should have these aggregated.
- How much new for-sale + rental construction is in the pipeline within 1–3 miles? Heavy new supply typically softens prices + rents 12–24 months out; constrained supply supports both.
Investment metrics
- 1% rule
- 2.32% ✓
- Cap rate
- 20.50%
- Cash-on-cash
- 50.74%
- DSCR
- 3.26
- GRM
- 3.6
CMA / ARV
- ARV (on-the-fly)
- $115,245
- Comps found
- 1
Show comp detail 1 sale within ~0.75 mi
| Address | Dist | Beds/Ba | Sqft | Sold | Price | $/sf | Match |
|---|---|---|---|---|---|---|---|
| 309 Clements St | 0.34mi | 3/2.0 | 1,626 (-8%) | 20mo | $106,500 | $65 | 50 |
Match score weights: distance 35% · size 25% · config 20% · recency 20%. Top-matched comps best support the ARV.
Projected returns pro-forma
3.0% appreciation · 3.0% rent growth · sell at horizon
- IRR
- 55.9%
- Equity multiple
- 4.12×
- Total profit
- $52,475
- Equity at exit
- $26,978
- IRR
- 55.5%
- Equity multiple
- 8.35×
- Total profit
- $123,416
- Equity at exit
- $41,577
Cash invested: $16,800 (down + closing). Projections, not guarantees.
Landlord ↔ Tenant lean methodology
- Overall (STATE)
- 90 Strongly Landlord-Friendly
- State Georgia
- 90 Strongly Landlord-Friendly · R+3
- County
- — inherits STATE
- City
- — inherits STATE
ZIP-level market 31825
- Active inventory
- 12
- Price-to-rent
- 3.6×
Monthly cashflow live
- Estimated rent
- $1,390 medium interval (Pro) →
- Mortgage (P&I)
- −$315
- Tax from tax record
- −$48 /mo · $579/yr
- Insurance
- −$25
- HOA
- −$0
- Vacancy / Maint / Mgmt
- −$292
- Net cashflow
- $710
Break-even live
UW: 25.0% down · 7.5% · 30yr · 1.5% tax · 5.0% vac · 8.0% maint · 8.0% mgmt
Financing live
Cash to close
- Down payment
- $15,000
- Closing costs
- $1,800
- Reserves months
- —
- Total cash needed
- —
Loan-product check · same deal, 3 products live
Conventional
25% down · 7.5% · 30yr
- Down + closing
- —
- Monthly P&I
- —
- Monthly cashflow
- —
- DSCR
- —
- Eligible?
- —
Personal DTI + credit; lowest rate.
DSCR
20% down · 8.5% · 30yr
- Down + closing
- —
- Monthly P&I
- —
- Monthly cashflow
- —
- DSCR
- —
- Eligible?
- —
No personal income docs; deal must DSCR.
Hard money
10% down · 12.0% · 12mo
- Down + closing
- —
- Monthly P&I
- —
- Monthly cashflow
- —
- DSCR
- —
- Eligible?
- —
Short-term bridge; refi at stabilization.
Listing history 9 events
-
2026-06-18days on market $59,999 Active 10 DOM
-
2026-06-17days on market $59,999 Active 9 DOM
-
2026-06-16days on market $59,999 Active 8 DOM
-
2026-06-15days on market $59,999 Active 7 DOM
-
2026-06-14days on market $59,999 Active 5 DOM
-
2026-06-13days on market $59,999 Active 4 DOM
-
2026-06-10days on market $59,999 Active 2 DOM
-
2026-06-09remarks 699-char remark
-
2026-06-09$59,999 Active 1 DOM
ⓘ Source: listings_history table (triggers on properties + properties_extension) + one-shot
backfill from property_details.listing_events for pre-trigger history.
Tax reassessment forecast GA · Resets to sale price
- Current annual tax
- $579 · $48/mo
- Projected year-2 tax
- $579 · $48/mo
- Expected delta
- $0/yr ($0/mo · 0.0%)
ⓘ Screening estimate from a state-policy table — verify with the county assessor before closing.
Climate risk First Street
- Flood 1/10 Low FEMA zone X (unshaded) · 0% chance over 30 yrs
- Wildfire 5/10 Major
- Heat 7/10 Severe 7 d/yr ≥107°F today · 18 d/yr by 30 yrs out
- Wind 8/10 Severe 80% chance of damaging wind over 30 yrs
- Air quality 2/10 Low 2 unhealthy d/yr today · 2 by 30 yrs out
Nearby sold comps map
Loading sold comps map…
Walkable amenities ~0.75 mi
Loading nearby amenities…
Taxation est. · year 1
- Rental income
- $16,682
- − Mortgage interest
- −$3,361
- − Property taxes
- −$579
- − Insurance
- −$300
- − Repairs & maintenance
- −$1,335
- − Management
- −$1,335
- − Depreciation
- −$1,745
- Taxable income
- $8,028
- Est. tax owed @ 24.0%
- −$1,927
- After-tax cash flow
- $6,598/yr
For passive investors: Depreciation is non-cash, so a rental often shows a tax loss while cash-flowing — sheltering income. Rental losses are passive: they offset passive income freely, and up to $25,000/yr can offset ordinary (W-2) income if you actively participate and your MAGI is under $100k (phasing out to $0 by $150k); unused losses carry forward. On sale, claimed depreciation is recaptured at up to 25%, and gains may owe capital-gains tax (a 1031 exchange can defer both). Figures are a year-1 estimate at your 24.0% rate — not tax advice; consult a CPA.
Schools (NCES district)
- District
- Stewart County
- NCES district ID
- 1304590
- Math proficiency
- 35% ▲ 9.00%
- Reading proficiency
- 26% ▲ 8.00%
- Median HH income
- $26,971
- Composite
- 27.25/100
- National rank
- #12434
- State rank
- #141 of 187 in GA
Livability — Richland
- Score
- 59/100
- State rank
- #410
- US rank
- #20252
Category grades
Schools grade is shown separately in the Schools card above.
Census & demographics
- Census place
- Richland, GA
- Population (ZIP)
- 2,733
Population outlook (Stewart County) Hauer SSP2
- Today (2025)
- 5,873 people
- By 2030
- 6,241 · +6.3%
- By 2040
- 6,569 · +11.9%
- By 2050
- 6,461 · +10.0%
- By 2075
- 5,819 · -0.9%
- By 2100
- 5,086 · -13.4%
Race, ethnicity, and origin ACS 2023
- Neighborhood character
- Diverse neighborhood (Simpson 0.56)
- Race & ethnicity
- Black 58% White 32% Two or more races 6% Hispanic / Latino 5%
- Hispanic origin (detail)
- Mexican 3% Cuban 2%
- Common ancestry
- Slovak 2% Italian 1%
- Foreign-born
- 3% · Canada
- Languages at home
- 94% English-only · Spanish 5% French/Haitian/Cajun 1%
Political lean MEDSL · Stewart
- 2024 margin
- D (+16.3) · D 58.0% · R 41.8%
- 2008→2024 swing
- -8.5pp toward R · 2008: 24.8pp · 2024: 16.3pp
- All cycles
- 2024: D+16.3 2020: D+19.1 2016: D+20.2 2012: D+27.6 2008: D+24.8
Not yet ingested
- Civics
- —
Market trends
- HPI YoY
- —
- Current HPI
- —
- Rent YoY
- —
- Metro
- —
- State GDP YoY
- ▲ 2.66%
- F500 in state
- 28
Industry mix (Fortune 500 HQ in GA)
| Industry | F500 HQs | Revenue |
|---|---|---|
| Paper / Packaging | 2 | $29B |
|
||
| Retail | 1 | $160B |
|
||
| Transportation / Logistics | 1 | $91B |
|
||
| Airlines | 1 | $62B |
|
||
| Consumer Goods | 1 | $47B |
|
||
| Utilities | 1 | $25B |
|
||
Price history
-24.1% since first listed10 events — show timeline
- 2026-06-08 Listed $59,999 FMLS
- 2026-06-08 Listed $59,999 GAMLS
- 2023-05-10 Listing Removed — GAMLS
- 2023-05-04 Sold (Public Records) $90,000 Public Records
- 2023-04-24 Sold (MLS) $90,000 CBOR
- 2023-04-13 Pending — CBOR
- 2023-03-29 Listed $129,999 CBOR
- 2023-03-28 Listed $129,999 GAMLS
- 2022-12-21 Sold (Public Records) $63,000 Public Records
- 2006-12-01 Sold (Public Records) $79,000 Public Records
Property tax history
+0.7%/yrLatest (2025): $579 · +3.9% YoY. Source: county tax records.
Cash-flow waterfall
monthlySold comps — $/sqft
last 12 mo · ≤1 miLoading sold comps…