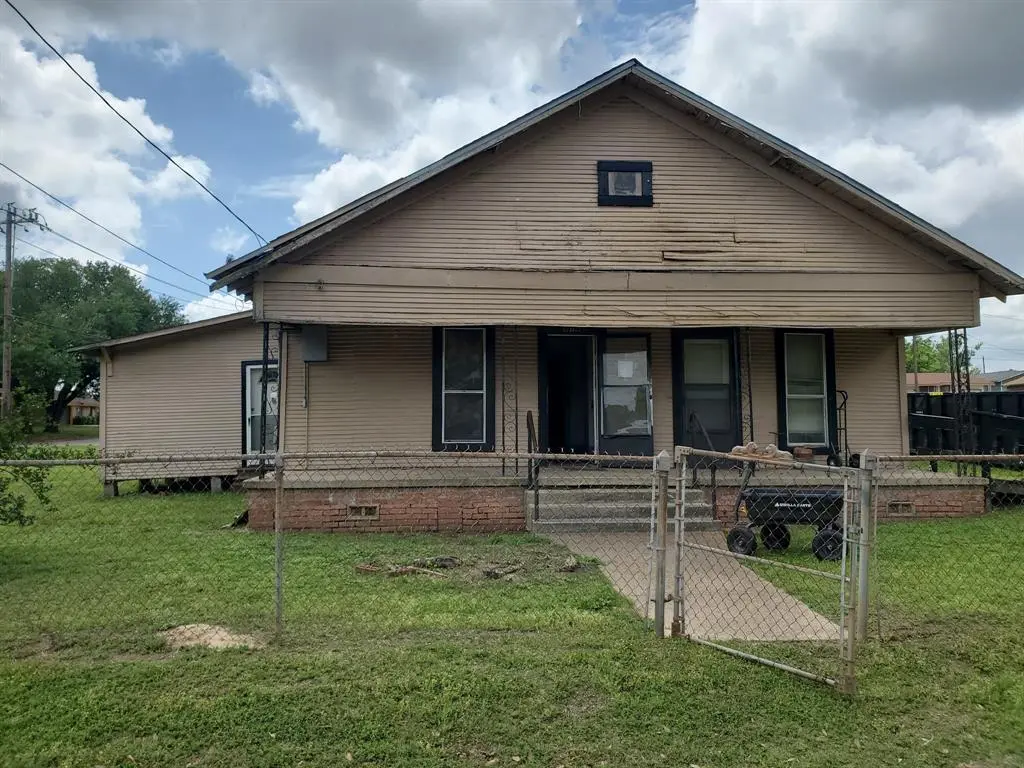
414 Barker St · Athens, TX
Flood risk 1/10 · Minimal
- FEMA flood zone
- X (unshaded)
- Chance of flooding over 30 yrs
- 0.0%
- Est. flood insurance / yr
- $507 – $1,088
Fire risk 4/10 · Minor
- Est. fire insurance / yr
- $1,222 – $2,270
Heat risk 7/10 · Major
- Hot days now (above 110°F)
- 7 days/yr
- Hot days in 30 yrs
- 26 days/yr
Wind risk 6/10 · Moderate
- Chance of severe wind over 30 yrs
- 66.0%
Air-quality risk 2/10 · Minimal
- Unhealthy air days now
- 0 days/yr
- Unhealthy air days in 30 yrs
- 1 days/yr
Risk factors via First Street. Map © Google.
Why this score? — see what drove the B- grade
The composite is a weighted blend of 9 inputs, each scored 0–100. Each bar is that input's sub-score; the figure is the points it added to the 100-point composite (weight × sub-score).
- Cash flow +30.0/30.0
- 1% rule +10.0/10.0
- DSCR +10.0/10.0
- ARV discount +7.5/15.0
- Livability +3.6/5.0
- Schools +2.9/10.0
- Rent growth +2.5/5.0
- Condition / age +2.5/5.0
- Appreciation +0.0/10.0
$50,000
🖨 Deal sheet 📄 Offer letter ✓ Due diligence
Listing remarks
Investor opportunity with upside potential in Athens, TX! This 3-bed, 2-bath home was built in 1912. The property requires an extensive rehab and is ideal for a savvy investor, handyman, or renovation-focused buyer looking for their next project. With major TLC needed throughout, this home presents an opportunity to renovate, add value, and customize the layout to fit your strategy. No repairs will be completed by the seller. A repair estimate and scope of work are available for review, making it easy to evaluate costs and plan improvements. The existing footprint offers flexibility for multiple exit strategies, including rental use, long-term hold, or a full resale. Situated in an establis
Key facts
- Extensive rehab
- Upside potential
- 0.28 acre lot
Tags
Property features AI
Finance
- Other: Property listed for sale; possession at closing/funding; Located in Henderson County, subdivision ATHENS
- Financial info: Seller is offering cash or owner-financing (owner will carry); Treat as clear loan status; no second mortgage indicated
- HOA & community: No homeowners association
Exterior
- Parking: No garage, carport, or covered parking
- Utilities: City water; City sewer; No municipal utility district
- Home design: Single-family residence; One story; Residential property
- Construction: Built in 1912; Frame construction with vinyl siding and wood; Pillar/post/pier foundation
- Exterior features: Level lot; Lot dimensions approximately 60 x 203
Interior
- Kitchen: No appliances included
- Bedrooms: 3 bedrooms (all on the main level); Primary bedroom on the main level
- Flooring: Carpet; Tile; Vinyl
- Bathrooms: 2 full bathrooms
- Interior features: One living area and one dining area; Other interior features
- Laundry & utility: No laundry appliances listed
Neighborhood map
What this means for you Summary
Snapshot
- This is a 3-bed/2.0-bath single-family listed at $50k.
Deal economics
- At list price, monthly cash flow is $659 ($8k/yr) — positive.
- The deal already cash-flows at list — no discount required.
- Meets the 1% rule at list price ($1k rent vs $50k).
- Recommended offer: $49k (1.5% below list) — sets the bar for market timing.
- Cap rate 22.1% vs local median 2.5% in Athens — top-decile yield for the area; either an underpriced asset or a hidden risk that comps aren't pricing in. Stress-test before assuming the spread holds.
Location & tenants
- Location reads 72/100 on livability (#241 in TX) — a middle-class / working-renter tenant base. Strengths: cost of living A+, health & safety A+, housing A; Watch: crime D+, amenities F, commute F.
- Athens ISD (town): math 34% / reading 34% proficiency, ranked #548 of 826 in TX (top 66%) — families likely to look elsewhere, expect single-tenant / working-renter base with shorter leases; 62% free/reduced lunch — lower-income household profile, screen leases tightly.
- Zoned schools: Central Athens (math 42% / reading 36%, grade F, #1,651 of 4,322 statewide, top 39%, 587 students, 76% FRL).
- Market conditions: 188 active listings in the ZIP; 6 comparable units currently listed for rent nearby; rentals lingering (median 44d on market — plan ~5-8 weeks vacancy on turnover, expect pricing pressure); 50% of comp listings sitting > 30 days — soft ceiling on asking rent; 263 units permitted in Henderson County in 2024 (0 in 5+ unit buildings).
Forward outlook
- Local home prices are declining (-3.0%/yr); year-one equity from $346 of loan paydown is wiped out by about $2k of value loss. Plan a longer hold.
- At projected returns (-3.0% appreciation + 3.0% rent growth), your $14k cash investment doubles in ~3 years — after that, you're playing with house money.
Negotiation context
- It's been on market 21 days — a 2% lower offer ($49k) is reasonable based on typical stale-listing flexibility.
Risks & watch-outs
- Watch-outs: property tax is 3.4% of price; built in 1912 — expect roof / HVAC / electrical / plumbing capex.
- Climate carrying-cost: major wind risk, 66% chance of damaging wind over 30y; extreme-heat days projected 7→26/yr by 2055 (HVAC capex compounding) — expect insurance premiums to compound above CPI over the hold.
Questions for the listing agent
- Built in 1912 — when were the roof, HVAC, electrical panel, plumbing, and water heater last replaced?
- Property tax is high relative to price — has the assessment been appealed recently, and will the sale trigger a re-assessment?
- Is there a deadline driving the sale (1031 exchange, divorce, estate, relocation)? That informs how much negotiation room exists.
- Schools are D-rated, which usually means shorter tenancies and higher turnover. Who's the typical renter profile here, and what's been the actual vacancy rate?
- Crime grade is D in this area — have there been break-ins, vandalism, or insurance claims at this property in the last 3 years? What carrier currently insures it and at what premium?
- What's the average days-on-market for RENTAL listings here right now (not sales)? A rising rental-DOM trend means longer vacancies and softer asking-rent achievability than the comps imply.
- What's the recent tenant-quality profile in this submarket — average credit score on applications, eviction rate, late-payment / NSF rate, and stable-employment percentage? A property-management company in the area should have these aggregated.
- How much new for-sale + rental construction is in the pipeline within 1–3 miles? Heavy new supply typically softens prices + rents 12–24 months out; constrained supply supports both.
Investment metrics
- 1% rule
- 2.75% ✓
- Cap rate
- 22.11%
- Cash-on-cash
- 56.50%
- DSCR
- 3.51
- GRM
- 3.0
CMA / ARV
- ARV (on-the-fly)
- $211,720
- Comps found
- 9
Show comp detail 9 sales within ~0.75 mi
| Address | Dist | Beds/Ba | Sqft | Sold | Price | $/sf | Match |
|---|---|---|---|---|---|---|---|
| 715 N Hamlett St | 0.23mi | 3/2.0 | 1,300 (-3%) | 6mo | $224,900 | $173 | 79 |
| 602 N Wofford St | 0.47mi | 3/2.0 | 1,332 (-1%) | 2mo | $209,900 | $158 | 75 |
| 211 Central Park Ct | 0.45mi | 3/2.0 | 1,225 (-9%) | 0mo | $269,500 | $220 | 64 |
| 829 N Prairieville St | 0.50mi | 2/2.5 (-1) | 1,238 (-8%) | 2mo | $55,000 | $44 | 55 |
| 705 Bob St | 0.40mi | 3/1.0 | 1,200 (-10%) | 8mo | $85,000 | $71 | 53 |
| 224 S Pinkerton St | 0.66mi | 2/2.0 (-1) | 1,458 (+9%) | 1mo | $125,000 | $86 | 48 |
| 503 E College St | 0.44mi | 2/2.0 (-1) | 1,527 (+14%) | 6mo | $179,500 | $118 | 46 |
| 610 N Wofford St | 0.48mi | 3/2.0 | 1,200 (-10%) | 20mo | $199,900 | $167 | 43 |
| 807 E College St | 0.73mi | 3/2.0 | 1,531 (+14%) | 3mo | $249,900 | $163 | 40 |
Match score weights: distance 35% · size 25% · config 20% · recency 20%. Top-matched comps best support the ARV.
Projected returns pro-forma
-3.0% appreciation · 3.0% rent growth · sell at horizon
- IRR
- 55.0%
- Equity multiple
- 3.42×
- Total profit
- $33,948
- Equity at exit
- $7,455
- IRR
- 60.0%
- Equity multiple
- 6.99×
- Total profit
- $83,904
- Equity at exit
- $4,323
Cash invested: $14,000 (down + closing). Projections, not guarantees.
Landlord ↔ Tenant lean methodology
- Overall (STATE)
- 87 Strongly Landlord-Friendly
- State Texas
- 87 Strongly Landlord-Friendly · R+5
- County
- — inherits STATE
- City
- — inherits STATE
ZIP-level market 75751
- Home prices YoY
- -33.1%
- Active inventory
- 188
- Price-to-rent
- 3.0×
Monthly cashflow live
- Estimated rent
- $1,374 high interval (Pro) →
- Mortgage (P&I)
- −$262
- Tax from tax record
- −$143 /mo · $1,722/yr
- Insurance
- −$21
- HOA
- −$0
- Vacancy / Maint / Mgmt
- −$289
- Net cashflow
- $659
Break-even live
UW: 25.0% down · 7.5% · 30yr · 1.5% tax · 5.0% vac · 8.0% maint · 8.0% mgmt
Financing live
Cash to close
- Down payment
- $12,500
- Closing costs
- $1,500
- Reserves months
- —
- Total cash needed
- —
Loan-product check · same deal, 3 products live
Conventional
25% down · 7.5% · 30yr
- Down + closing
- —
- Monthly P&I
- —
- Monthly cashflow
- —
- DSCR
- —
- Eligible?
- —
Personal DTI + credit; lowest rate.
DSCR
20% down · 8.5% · 30yr
- Down + closing
- —
- Monthly P&I
- —
- Monthly cashflow
- —
- DSCR
- —
- Eligible?
- —
No personal income docs; deal must DSCR.
Hard money
10% down · 12.0% · 12mo
- Down + closing
- —
- Monthly P&I
- —
- Monthly cashflow
- —
- DSCR
- —
- Eligible?
- —
Short-term bridge; refi at stabilization.
Rent comps 6 comps
| Address | Beds | Baths | Sqft | Rent | $/sqft | DOM | Units | Dist |
|---|---|---|---|---|---|---|---|---|
| 722 Wofford St Athens, TX | 3.0 | 2.0 | 1299 | $1,432 | $1.10 | 20d | 1 | 0.44mi |
| 409 Royal St Apt 5 Athens, TX | 2.0 | 1.0 | 950 | $950 | $1.00 | 43d | 1 | 0.52mi |
| 207 W College St Unit 102 Athens, TX | 2.0 | 1.0 | 900 | $865 | $0.96 | 43d | 1 | 0.64mi |
| 215 Wood St Athens, TX | 1.0–2.0 | 1.0–2.0 | 762 | $1,520 | $1.99 | 13d | 4 | 0.67mi |
| 900 E Corsicana St Athens, TX | 2.0 | 1.0–2.0 | 767 | $1,339 | $1.74 | 13d | 6 | 0.74mi |
| 300 Lila Ln Athens, TX | 2.0 | 2.0 | 932 | $1,350 | $1.45 | 43d | 1 | 1.22mi |
Listing history 17 events
-
2026-06-19days on market $50,000 Active 21 DOM
-
2026-06-18days on market $50,000 Active 20 DOM
-
2026-06-17days on market $50,000 Active 19 DOM
-
2026-06-17price $50,000 Active 18 DOM
-
2026-06-16days on market $58,500 Active 18 DOM
-
2026-06-15days on market $58,500 Active 17 DOM
-
2026-06-14days on market $58,500 Active 15 DOM
-
2026-06-12days on market $58,500 Active 14 DOM
-
2026-06-09days on market $58,500 Active 11 DOM
-
2026-06-08days on market $58,500 Active 10 DOM
-
2026-06-07days on market $58,500 Active 9 DOM
-
2026-06-05days on market $58,500 Active 6 DOM
-
2026-06-03days on market $58,500 Active 5 DOM
-
2026-06-02days on market $58,500 Active 4 DOM
-
2026-06-01days on market $58,500 Active 3 DOM
-
2026-05-31days on market $58,500 Active 2 DOM
-
2026-05-29$58,500 Active
ⓘ Source: listings_history table (triggers on properties + properties_extension) + one-shot
backfill from property_details.listing_events for pre-trigger history.
Tax reassessment forecast TX · Resets to sale price
- Current annual tax
- $1,722 · $143/mo
- Projected year-2 tax
- $1,722 · $143/mo
- Expected delta
- $0/yr ($0/mo · 0.0%)
ⓘ Screening estimate from a state-policy table — verify with the county assessor before closing.
Climate risk First Street
- Flood 1/10 Low FEMA zone X (unshaded) · 0% chance over 30 yrs
- Wildfire 4/10 Moderate
- Heat 7/10 Severe 7 d/yr ≥110°F today · 26 d/yr by 30 yrs out
- Wind 6/10 Major 66% chance of damaging wind over 30 yrs
- Air quality 2/10 Low 0 unhealthy d/yr today · 1 by 30 yrs out
Nearby sold comps map
Loading sold comps map…
Walkable amenities ~0.75 mi
Loading nearby amenities…
Taxation est. · year 1
- Rental income
- $16,491
- − Mortgage interest
- −$2,801
- − Property taxes
- −$1,722
- − Insurance
- −$250
- − Repairs & maintenance
- −$1,319
- − Management
- −$1,319
- − Depreciation
- −$1,455
- Taxable income
- $7,625
- Est. tax owed @ 24.0%
- −$1,830
- After-tax cash flow
- $6,079/yr
For passive investors: Depreciation is non-cash, so a rental often shows a tax loss while cash-flowing — sheltering income. Rental losses are passive: they offset passive income freely, and up to $25,000/yr can offset ordinary (W-2) income if you actively participate and your MAGI is under $100k (phasing out to $0 by $150k); unused losses carry forward. On sale, claimed depreciation is recaptured at up to 25%, and gains may owe capital-gains tax (a 1031 exchange can defer both). Figures are a year-1 estimate at your 24.0% rate — not tax advice; consult a CPA.
Schools (NCES district)
- District
- Athens ISD
- NCES district ID
- 4808870
- Math proficiency
- 34% ▼ -9.00%
- Reading proficiency
- 34% ▼ -4.00%
- Median HH income
- $41,617
- Composite
- 28.73/100
- National rank
- #6680
- State rank
- #548 of 826 in TX
Livability — Athens
- Score
- 72/100
- State rank
- #241
- US rank
- #5796
Category grades
Schools grade is shown separately in the Schools card above.
Census & demographics
- Census place
- Athens, TX
- County
- Henderson County · 34,977 people
- City population
- 18,644
- Metro
- Athens, TX
- Population (ZIP)
- 18,644
- Household income
- $70,620
- Rent vs Own
- Severe rent burden
- 535.0
Population outlook (Henderson County) Hauer SSP2
- Today (2025)
- 80,471 people
- By 2030
- 80,608 · +0.2%
- By 2040
- 80,087 · -0.5%
- By 2050
- 78,208 · -2.8%
- By 2075
- 72,423 · -10.0%
- By 2100
- 61,012 · -24.2%
Race, ethnicity, and origin ACS 2023
- Neighborhood character
- Diverse neighborhood (Simpson 0.56)
- Race & ethnicity
- White 60% Hispanic / Latino 24% Two or more races 18% Black 10% Asian 2%
- Hispanic origin (detail)
- Mexican 22%
- Common ancestry
- Slovak 2% Romanian 1% Italian 1%
- Foreign-born
- 8% · Canada
- Languages at home
- 79% English-only · Spanish 19% Other Asian/Pacific 1%
Political lean MEDSL · Henderson
- 2024 margin
- Solid R (+63.5) · D 18.0% · R 81.4%
- 2008→2024 swing
- -18.8pp toward R · 2008: -44.6pp · 2024: -63.5pp
- All cycles
- 2024: R+63.5 2020: R+60.2 2016: R+60.0 2012: R+54.8 2008: R+44.6
Not yet ingested
- Civics
- —
Market trends
- HPI YoY
- ▼ -95.19%
- Current HPI
- 192.3973
- Rent YoY
- —
- Metro
- Athens, TX
- State GDP YoY
- ▲ 3.95%
- F500 in state
- 110
Industry mix (Fortune 500 HQ in TX)
| Industry | F500 HQs | Revenue |
|---|---|---|
| Energy | 16 | $1,198B |
|
||
| Technology | 5 | $198B |
|
||
| Engineering / Construction | 4 | $72B |
|
||
| Energy Services | 3 | $60B |
|
||
| Utilities | 3 | $41B |
|
||
| Healthcare | 2 | $330B |
|
||
Price history
1 event — show timeline
- 2026-05-29 Listed $58,500 NTREIS
Property tax history
+6.6%/yrLatest (2025): $1,722 · +0.2% YoY. Source: county tax records.
Cash-flow waterfall
monthlySold comps — $/sqft
last 12 mo · ≤1 miLoading sold comps…