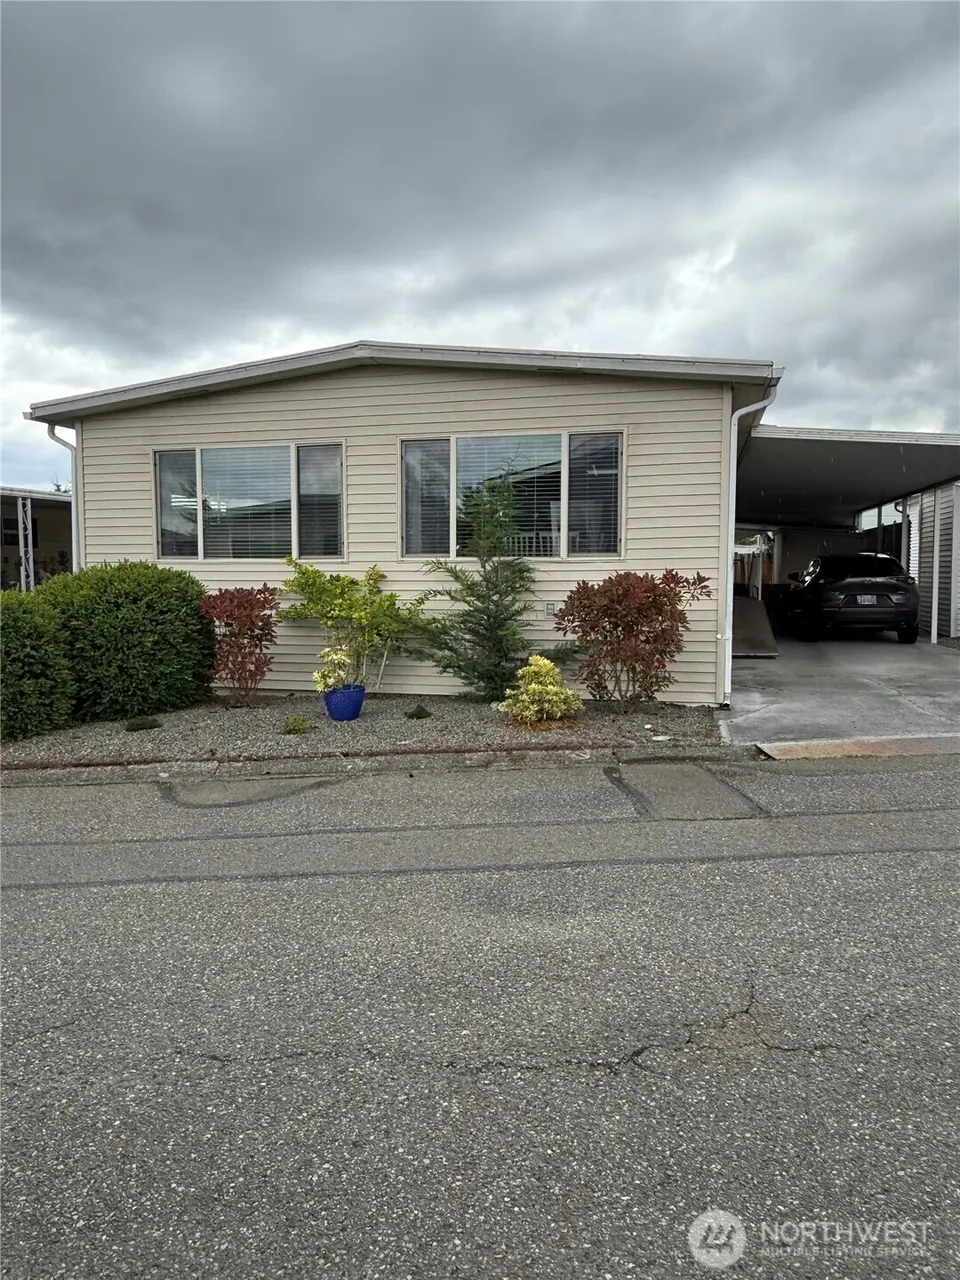
1415 84th St SE #89 · Everett, WA
Flood risk No data
- FEMA flood zone
- —
- Chance of flooding over 30 yrs
- —
- Est. flood insurance / yr
- —
Fire risk No data
- Est. fire insurance / yr
- —
Heat risk No data
- Hot days now (above threshold)
- —
- Hot days in 30 yrs
- —
Wind risk No data
- Chance of severe wind over 30 yrs
- —
Air-quality risk No data
- Unhealthy air days now
- —
- Unhealthy air days in 30 yrs
- —
Risk factors via First Street. Map © Google.
Why this score? — see what drove the C grade
The composite is a weighted blend of 9 inputs, each scored 0–100. Each bar is that input's sub-score; the figure is the points it added to the 100-point composite (weight × sub-score).
- Cash flow +27.0/30.0
- DSCR +9.3/10.0
- 1% rule +6.2/10.0
- Schools +5.9/10.0
- Livability +3.7/5.0
- Condition / age +2.5/5.0
- Rent growth +1.7/5.0
- ARV discount +0.0/15.0
- Appreciation +0.0/10.0
$185,000
🖨 Deal sheet (PDF) 📄 Offer letter ✓ Due diligence
Listing remarks
Major price adjustment $14,950.. .. . Seller will pay $3000 towards buyers closing costs as well. Enjoy the ultimate convenience with this stunning, beautifully remodeled, move-in-ready manufactured home in the desirable 55+ Mobile Country Club community. Whether you are looking for a primary residence or a hassle-free second home, this property offers everything you need to start living comfortably from day one. Fully furnished (optional). Freshly painted interior, new electrical light switches and outlets, custom lighting fixtures, canned lighting in family room and kitchen. Quartz counters, refinished cabinet exteriors, and extensive use of beautiful tile backsplash, also used for decora
Key facts
- Canned lighting
- 2 parking spots
- Community pool
Tags
Property features AI
Finance
- Other: Taxes listed (buyer to verify); Directions: From 7th Ave and 84th St turn on 84th; this dead ends into park
- Financial info: Listing terms: Cash or Conventional; Land lease: $852
- HOA & community: Park approved for sale; Mobile Country Club park with clubhouse, exercise room, laundry, and pool; Approximately 210 homes in park; Senior community
Exterior
- Parking: Carport; RV parking available in park
- Utilities: Electric energy source; Public water (City of Everett); Public sewer (City of Everett); Power provided by PUD; Electric water heater; Internet: Xfinity
- Home design: Manufactured double-wide home; One story; Manufactured after 06/15/1976: No; Mobile home remains
- Construction: Metal/vinyl construction materials; Composition roof
- Exterior features: Metal/vinyl exterior; Patio/porch/deck
Interior
- Kitchen: Dishwasher; Garbage disposal; Microwave; Refrigerator; Stove/Range
- Bedrooms: 2 bedrooms
- Flooring: Laminate; Carpet
- Bathrooms: 1 full bath; 1 three-quarter bath; 1 bathtub; 1 shower
- Heating & cooling: Forced air heating; Wall unit cooling
- Interior features: Water heater; Skylights; Drapes
- Laundry & utility: Washer; Dryer; Utility room
Neighborhood map
What this means for you Summary
Snapshot
- This is a 2-bed/2.0-bath manufactured listed at $185k.
Deal economics
- At list price, monthly cash flow is $516 ($6k/yr) — positive.
- The deal already cash-flows at list — no discount required.
- Meets the 1% rule at list price ($2k rent vs $185k).
- Recommended offer: $179k (3.0% below list) — sets the bar for market timing.
- Cap rate 9.6% vs local median 2.5% in Everett — top-decile yield for the area; either an underpriced asset or a hidden risk that comps aren't pricing in. Stress-test before assuming the spread holds.
Location & tenants
- Location reads 73/100 on livability (#199 in WA) — a middle-class / working-renter tenant base. Strengths: commute A+, housing A, health & safety A; Watch: schools C-, crime D+, amenities F.
- Everett School District (urban): math 60% / reading 72% proficiency, ranked #26 of 291 in WA (top 9%) — acceptable for families but not a draw, mixed tenant base, ~2y average lease.
- Market conditions: Rents falling (-3.2%/yr); 275 active listings in the ZIP; 40 comparable units currently listed for rent nearby; rentals leasing fast (median 6d on market — plan ~1-2 weeks tenant-placement turnaround); solid renter incomes; 3,982 units permitted in Snohomish County in 2024 (1,492 in 5+ unit buildings).
Forward outlook
- Local home prices are declining (-3.0%/yr); year-one equity from $1k of loan paydown is wiped out by about $6k of value loss. Plan a longer hold.
- Snohomish County population projected at +30% by 2050 — long-run rental-demand tailwind backs the buy-and-hold thesis.
Negotiation context
- It's been on market 34 days — a 3% lower offer ($179k) is reasonable based on typical stale-listing flexibility.
Questions for the listing agent
- It's been on market 34 days. Have you received any prior offers? Is the seller open to a 3% concession, seller financing, or rate buy-down credit?
- Built in 1974 — when were the roof, HVAC, electrical panel, plumbing, and water heater last replaced?
- Is there a deadline driving the sale (1031 exchange, divorce, estate, relocation)? That informs how much negotiation room exists.
- Crime grade is D in this area — have there been break-ins, vandalism, or insurance claims at this property in the last 3 years? What carrier currently insures it and at what premium?
- What's the average days-on-market for RENTAL listings here right now (not sales)? A rising rental-DOM trend means longer vacancies and softer asking-rent achievability than the comps imply.
- What's the recent tenant-quality profile in this submarket — average credit score on applications, eviction rate, late-payment / NSF rate, and stable-employment percentage? A property-management company in the area should have these aggregated.
- How much new for-sale + rental construction is in the pipeline within 1–3 miles? Heavy new supply typically softens prices + rents 12–24 months out; constrained supply supports both.
Investment metrics
- 1% rule
- 1.12% ✓
- Cap rate
- 9.64%
- Cash-on-cash
- 11.94%
- DSCR
- 1.53
- GRM
- 7.5
CMA / ARV
- ARV (median comp)
- $128,000
- List price
- $185,000
- Delta
- 44.53%
- Verdict
- OVERPRICED
- Comps
- 9 within 1.0 mi
Show comp detail 9 sales within ~0.75 mi
| Address | Dist | Beds/Ba | Sqft | Sold | Price | $/sf | Match |
|---|---|---|---|---|---|---|---|
| 1415 84th St SE #36 | 0.00mi | 2/2.0 | 1,152 (0%) | 2mo | $150,000 | $130 | 98 |
| 1415 84th St SE #80 | 0.00mi | 2/2.0 | 1,194 (+4%) | 7mo | $140,000 | $117 | 88 |
| 1415 84th St SE #11 | 0.00mi | 2/2.0 | 1,200 (+4%) | 8mo | $145,000 | $121 | 86 |
| 1415 84th St SE #104 | 0.00mi | 2/2.0 | 1,242 (+8%) | 1mo | $75,000 | $60 | 86 |
| 1415 84th St SE #45 | 0.00mi | 2/2.0 | 1,240 (+8%) | 10mo | $65,000 | $52 | 79 |
| 1415 84th St SE #97 | 0.00mi | 2/2.0 | 1,240 (+8%) | 16mo | $110,000 | $89 | 74 |
| 1415 84th St SE #110 | 0.00mi | 2/2.0 | 1,232 (+7%) | 17mo | $200,000 | $162 | 74 |
| 1415 84th St SE #9 | 0.00mi | 2/2.0 | 1,000 (-13%) | 12mo | $164,950 | $165 | 68 |
| 1415 SE 84th St #122 | 0.00mi | 2/2.0 | 1,242 (+8%) | 23mo | $125,000 | $101 | 68 |
Match score weights: distance 35% · size 25% · config 20% · recency 20%. Top-matched comps best support the ARV.
Projected returns pro-forma
-3.0% appreciation · 0.0% rent growth · sell at horizon
- IRR
- -1.7%
- Equity multiple
- 0.94×
- Total profit
- $-3,264
- Equity at exit
- $27,584
- IRR
- 4.7%
- Equity multiple
- 1.30×
- Total profit
- $15,765
- Equity at exit
- $15,995
Cash invested: $51,800 (down + closing). Projections, not guarantees.
Landlord ↔ Tenant lean methodology
- Overall (STATE)
- 28 Tenant-Leaning
- State Washington
- 28 Tenant-Leaning · D+8
- County
- — inherits STATE
- City
- — inherits STATE
ZIP-level market 98208
- Rents YoY
- -3.2%
- Active inventory
- 275
- Price-to-rent
- 7.5×
Monthly cashflow live
- Estimated rent
- $2,066 high interval (Pro) →
- Mortgage (P&I)
- −$970
- Tax from tax record
- −$69 /mo · $831/yr
- Insurance
- −$77
- HOA
- −$0
- Vacancy / Maint / Mgmt
- −$434
- Net cashflow
- $516
Break-even live
Sensitivity live
| Price | -10% $620 | -5% $568 | +0% $516 | +5% $463 | +10% $411 |
|---|---|---|---|---|---|
| Rent | -10% $352 | -5% $434 | +0% $516 | +5% $597 | +10% $679 |
| Rate | -1.0pp $609 | -0.5pp $563 | base $516 | +0.5pp $468 | +1.0pp $419 |
UW: 25.0% down · 7.5% · 30yr · 1.5% tax · 5.0% vac · 8.0% maint · 8.0% mgmt
Financing live
Cash to close
- Down payment
- $46,250
- Closing costs
- $5,550
- Reserves months
- —
- Total cash needed
- —
Loan-product check · same deal, 3 products live
Conventional
25% down · 7.5% · 30yr
- Down + closing
- —
- Monthly P&I
- —
- Monthly cashflow
- —
- DSCR
- —
- Eligible?
- —
Personal DTI + credit; lowest rate.
DSCR
20% down · 8.5% · 30yr
- Down + closing
- —
- Monthly P&I
- —
- Monthly cashflow
- —
- DSCR
- —
- Eligible?
- —
No personal income docs; deal must DSCR.
Hard money
10% down · 12.0% · 12mo
- Down + closing
- —
- Monthly P&I
- —
- Monthly cashflow
- —
- DSCR
- —
- Eligible?
- —
Short-term bridge; refi at stabilization.
Rent comps 40 comps
| Address | Beds | Baths | Sqft | Rent | $/sqft | DOM | Units | Dist |
|---|---|---|---|---|---|---|---|---|
| 9009 W Mall Dr Everett, WA | 1.0–2.0 | 1.0–2.0 | 830 | $2,502 | $3.01 | 0d | 19 | 0.23mi |
| 1224 Kossuth Ave Everett, WA | 2.0 | 1.0 | 1375 | $2,700 | $1.96 | 20d | 1 | 0.44mi |
| 233 Dorn Ave Unit 1 Everett, WA | 2.0 | 1.0 | 944 | $1,950 | $2.07 | 11d | 1 | 0.74mi |
| 8102 Evergreen Way Everett, WA | 1.0–5.0 | 1.0–2.0 | 1390 | $2,058 | $1.48 | 0d | 16 | 0.75mi |
| 207 Dorn Ave Unit 2H Everett, WA | 2.0 | 1.0 | 780 | $1,795 | $2.30 | 15d | 1 | 0.76mi |
| 115 Dorn Ave Everett, WA | 2.0 | 1.0–2.0 | 946 | $1,738 | $1.84 | 17d | 1 | 0.80mi |
| 1007 75th St SE Everett, WA | 2.0 | 1.5 | 1059 | $1,695 | $1.60 | 0d | 1 | 0.84mi |
| 618 75th St SE Unit 206 Everett, WA | 2.0 | 1.0 | 833 | $1,700 | $2.04 | 25d | 1 | 0.86mi |
| 618 75th St SE Everett, WA | 3.0 | 2.0 | 1232 | $2,400 | $1.95 | 11d | 1 | 0.86mi |
| 618 75th St SE Everett, WA | 2.0 | 1.0 | 833 | $1,750 | $2.10 | 25d | 1 | 0.86mi |
| 1915 75th St SE Unit 1H Everett, WA | 3.0 | 1.5 | 1300 | $2,500 | $1.92 | 25d | 1 | 0.89mi |
| 10101 7th Ave SE Everett, WA | 1.0–3.0 | 1.0–2.0 | 1073 | $2,277 | $2.12 | 0d | 15 | 0.90mi |
| 8920 Evergreen Way Everett, WA | 2.0 | 1.0 | 567 | $1,750 | $3.08 | 0d | 7 | 0.91mi |
| 701 75th St SE Everett, WA | 1.0–3.0 | 1.0 | 820 | $1,850 | $2.26 | 5d | 5 | 0.92mi |
| 747 75th St SE Everett, WA | 2.0 | 1.0 | 864 | $1,722 | $1.99 | 5d | 1 | 0.96mi |
| 120 W Casino Rd Everett, WA | 1.0–2.0 | 1.0–1.5 | 818 | $1,992 | $2.43 | 0d | 13 | 1.00mi |
| 2319 75th St SE Everett, WA | 3.0 | 2.0 | 1112 | $2,745 | $2.47 | 25d | 1 | 1.00mi |
| 1304 Bruskrud Rd Everett, WA | 2.0 | 1.5–2.0 | 900 | $2,000 | $2.22 | 0d | 5 | 1.03mi |
| 120 SE Everett Mall Way Everett, WA | 1.0–2.0 | 1.0–2.0 | 813 | $2,134 | $2.62 | 0d | 43 | 1.13mi |
| 6911 Rainier Dr Unit 11-07 Everett, WA | 2.0 | 1.5 | 1008 | $2,095 | $2.08 | 5d | 1 | 1.13mi |
| 6911 Rainier Dr Unit 11-03 Everett, WA | 2.0 | 1.5 | 1008 | $1,695 | $1.68 | 25d | 1 | 1.13mi |
| 2220 Monroe Ave Everett, WA | 3.0 | 1.0 | 930 | $2,799 | $3.01 | 0d | 1 | 1.15mi |
| 222 W Marilyn Ave Everett, WA | 3.0 | 1.0 | 1000 | $2,400 | $2.40 | 17d | 1 | 1.25mi |
| 8710 5th Ave W Everett, WA | 2.0 | 2.0 | 950 | $2,028 | $2.14 | 0d | 11 | 1.28mi |
| 8530 5th Ave W Everett, WA | 1.0–2.0 | 1.0 | 808 | $1,595 | $1.97 | 5d | 2 | 1.28mi |
| 8220 5th Ave W Apt F Everett, WA | 2.0 | 1.0 | 950 | $1,595 | $1.68 | 0d | 1 | 1.29mi |
| 215 100th St SW Everett, WA | 2.0 | 2.0 | 856 | $1,845 | $2.16 | 5d | 1 | 1.32mi |
| 6609 Cady Rd Unit 2 Everett, WA | 2.0 | 1.5 | 1386 | $2,225 | $1.61 | 25d | 1 | 1.34mi |
| 611 W Casino Rd Unit 2A Everett, WA | 1.0 | 1.0 | 700 | $1,350 | $1.93 | 0d | 1 | 1.34mi |
| 611 W Casino Rd Unit 3A Everett, WA | 1.0 | 1.0 | 753 | $1,400 | $1.86 | 3d | 1 | 1.34mi |
| 611 W Casino Rd Everett, WA | 1.0 | 1.0 | 753 | $1,400 | $1.86 | 0d | 1 | 1.34mi |
| 611 W Casino Rd Everett, WA | 1.0 | 1.0 | 700 | $1,350 | $1.93 | 44d | 1 | 1.34mi |
| 507 Madison St Apt A Everett, WA | 3.0 | 2.0 | 1014 | $2,449 | $2.42 | 0d | 1 | 1.35mi |
| 702 W Casino Rd Everett, WA | 1.0–2.0 | 1.0–1.5 | 850 | $1,749 | $2.06 | 5d | 21 | 1.36mi |
| 711 W Casino Rd Everett, WA | 1.0–2.0 | 1.0 | 770 | $1,801 | $2.34 | 0d | 5 | 1.38mi |
| 9925 4th Ave W Apt 6 Everett, WA | 2.0 | 2.0 | 1000 | $1,445 | $1.45 | 2d | 1 | 1.39mi |
| 9925 4th Ave W Apt 9 Everett, WA | 1.0 | 1.0 | 800 | $1,245 | $1.56 | 2d | 1 | 1.39mi |
| 2505 Madison St Unit A Everett, WA | 3.0 | 1.0 | 1040 | $2,800 | $2.69 | 25d | 1 | 1.39mi |
| 9615 Holly Dr Everett, WA | 1.0–2.0 | 1.0 | 645 | $2,220 | $3.44 | 5d | 1 | 1.41mi |
| 2601 106th Pl SE Everett, WA | 3.0 | 2.0 | 1221 | $3,245 | $2.66 | 13d | 1 | 1.45mi |
Listing history 15 events
-
2026-06-18days on market $185,000 Active 34 DOM
-
2026-06-17days on market $185,000 Active 33 DOM
-
2026-06-16days on market $185,000 Active 32 DOM
-
2026-06-15days on market $185,000 Active 31 DOM
-
2026-06-13days on market $185,000 Active 29 DOM
-
2026-06-13pricedays on market $185,000 Active 28 DOM
-
2026-06-09days on market $199,950 Active 25 DOM
-
2026-06-08days on market $199,950 Active 24 DOM
-
2026-06-07days on market $199,950 Active 23 DOM
-
2026-06-04days on market $199,950 Active 20 DOM
-
2026-06-03days on market $199,950 Active 19 DOM
-
2026-06-02days on market $199,950 Active 18 DOM
-
2026-06-01days on market $199,950 Active 17 DOM
-
2026-05-31days on market $199,950 Active 16 DOM
-
2026-05-15$199,950 Active
ⓘ Source: listings_history table (triggers on properties + properties_extension) + one-shot
backfill from property_details.listing_events for pre-trigger history.
Tax reassessment forecast WA · Resets to sale price
- Current annual tax
- $831 · $69/mo
- Projected year-2 tax
- $1,813 · $151/mo
- Expected delta
- +$982/yr (+$82/mo · 118.1%)
ⓘ Screening estimate from a state-policy table — verify with the county assessor before closing.
Nearby sold comps map
Loading sold comps map…
Walkable amenities ~0.75 mi
Loading nearby amenities…
Taxation est. · year 1
- Rental income
- $24,791
- − Mortgage interest
- −$10,363
- − Property taxes
- −$831
- − Insurance
- −$925
- − Repairs & maintenance
- −$1,983
- − Management
- −$1,983
- − Depreciation
- −$5,382
- Taxable income
- $3,324
- Est. tax owed @ 24.0%
- −$798
- After-tax cash flow
- $5,389/yr
For passive investors: Depreciation is non-cash, so a rental often shows a tax loss while cash-flowing — sheltering income. Rental losses are passive: they offset passive income freely, and up to $25,000/yr can offset ordinary (W-2) income if you actively participate and your MAGI is under $100k (phasing out to $0 by $150k); unused losses carry forward. On sale, claimed depreciation is recaptured at up to 25%, and gains may owe capital-gains tax (a 1031 exchange can defer both). Figures are a year-1 estimate at your 24.0% rate — not tax advice; consult a CPA.
Schools (NCES district)
- District
- Everett School District
- NCES district ID
- 5302670
- Math proficiency
- 60% ▲ 1.00%
- Reading proficiency
- 72% ▲ 1.00%
- Median HH income
- $66,815
- Composite
- 59.0/100
- National rank
- #1964
- State rank
- #26 of 291 in WA
Livability — Everett
- Score
- 73/100
- State rank
- #199
- US rank
- #5489
Category grades
Schools grade is shown separately in the Schools card above.
Census & demographics
- Census place
- Everett, WA
- County
- Snohomish County · 786,756 people
- City population
- 173,457
- Metro
- Seattle-Tacoma-Bellevue, WA
- Population (ZIP)
- 60,915
- Household income
- $103,705
- Rent vs Own
- Severe rent burden
- 1617.0
Population outlook (Snohomish County) Hauer SSP2
- Today (2025)
- 899,800 people
- By 2030
- 960,975 · +6.8%
- By 2040
- 1,074,447 · +19.4%
- By 2050
- 1,171,954 · +30.2%
- By 2075
- 1,384,849 · +53.9%
- By 2100
- 1,497,296 · +66.4%
Race, ethnicity, and origin ACS 2023
- Neighborhood character
- Diverse neighborhood (Simpson 0.65)
- Race & ethnicity
- White 55% Asian 17% Hispanic / Latino 14% Two or more races 13% Black 5%
- Hispanic origin (detail)
- Mexican 10%
- Common ancestry
- Portuguese 5% Italian 3% Slovak 2%
- Foreign-born
- 27% · Canada, Vietnam, South Korea
- Languages at home
- 66% English-only · Spanish 9% Vietnamese 4% Other Asian/Pacific 4%
Political lean MEDSL · Snohomish
- 2024 margin
- D (+19.0) · D 57.8% · R 38.9% · Other 3.3%
- 2008→2024 swing
- +0.1pp no change · 2008: 18.9pp · 2024: 19.0pp
- All cycles
- 2024: D+19.0 2020: D+20.6 2016: D+16.6 2012: D+16.2 2008: D+18.9
Not yet ingested
- Civics
- —
Market trends
- HPI YoY
- ▼ -884.74%
- Current HPI
- 337.856
- Rent YoY
- ▼ -3.16%
- Metro
- Seattle-Tacoma-Bellevue, WA
- State GDP YoY
- ▲ 4.65%
- F500 in state
- 22
Industry mix (Fortune 500 HQ in WA)
| Industry | F500 HQs | Revenue |
|---|---|---|
| Retail | 2 | $269B |
|
||
| Technology / Retail | 1 | $638B |
|
||
| Technology | 1 | $245B |
|
||
| Telecommunications | 1 | $38B |
|
||
| Food / Beverage | 1 | $36B |
|
||
| Automotive / Trucks | 1 | $34B |
|
||
Price history
-7.5% since first listed2 events — show timeline
- 2026-06-12 Price Changed $185,000 NWMLS as Distributed by MLS Grid
- 2026-05-15 Listed $199,950 NWMLS as Distributed by MLS Grid
Property tax history
+9.7%/yrLatest (2026): $831 · +5.2% YoY. Source: county tax records.
Cash-flow waterfall
monthlySold comps — $/sqft
last 12 mo · ≤1 miLoading sold comps…