6324 212th St SW #5 · Lynnwood, WA
Flood risk No data
- FEMA flood zone
- —
- Chance of flooding over 30 yrs
- —
- Est. flood insurance / yr
- —
Fire risk No data
- Est. fire insurance / yr
- —
Heat risk No data
- Hot days now (above threshold)
- —
- Hot days in 30 yrs
- —
Wind risk No data
- Chance of severe wind over 30 yrs
- —
Air-quality risk No data
- Unhealthy air days now
- —
- Unhealthy air days in 30 yrs
- —
Risk factors via First Street. Map © Google.
Why this score? — see what drove the B grade
The composite is a weighted blend of 9 inputs, each scored 0–100. Each bar is that input's sub-score; the figure is the points it added to the 100-point composite (weight × sub-score).
- Cash flow +30.0/30.0
- 1% rule +10.0/10.0
- DSCR +10.0/10.0
- ARV discount +7.5/15.0
- Schools +5.4/10.0
- Livability +3.9/5.0
- Rent growth +3.1/5.0
- Condition / age +2.5/5.0
- Appreciation +0.0/10.0
$125,000
🖨 Deal sheet 📄 Offer letter ✓ Due diligence
Listing remarks
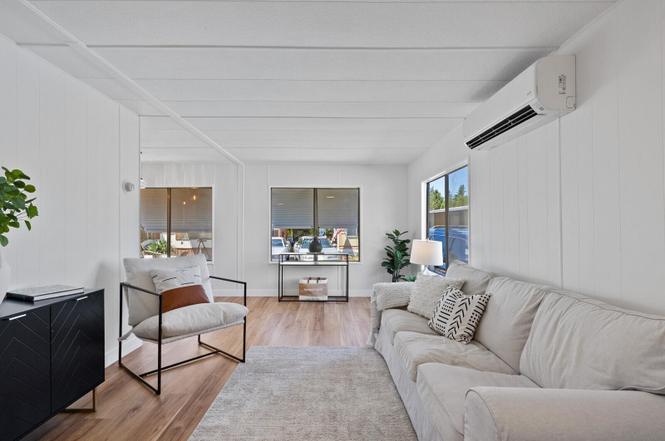
Luxury living at an affordable price in Lynnwood! Welcome home to this beautifully updated, fully refreshed 2-bedroom, 1-bath residence offering 800 sq. ft. of stylish and comfortable living. Recent improvements include new luxury vinyl plank flooring, custom cabinetry, quartz countertops, custom tile backsplash and shower surround, updated light fixtures, stainless steel appliances, updated plumbing, and a new water heater. Enjoy year-round comfort with a newer heat pump and A/C. Step outside to a spacious covered deck—perfect for entertaining or relaxing—plus two storage sheds for all your extra storage needs. The quaint backyard is maintained by the HOA, allowing for low-main
Key facts
- Custom cabinetry
- Quartz countertops
- Updated flooring
Tags
Property features AI
Finance
- Other: Estimated building area 800 square feet; Tie down foundation; On market date: June 17, 2026; MLS status: Active
- Financial info: Accepts cash and conventional financing; Buyer brokerage compensation 3%
- HOA & community: Manufactured home park approved for sale; 12 homes in the park; Pets allowed; Land lease: $950
Exterior
- Parking: Uncovered open parking (1 space)
- Utilities: Electric energy source; Public water; Power by PUD; Electric water heater
- Home design: Manufactured double-wide home; Updated/remodeled condition; One level; Brook model; Entry level; Mobile home remains
- Construction: Metal/vinyl construction; Tie down foundation; See remarks roof
- Exterior features: Metal/vinyl exterior; Awnings; Patio/porch/deck; Located on a dead-end street
Interior
- Kitchen: Dishwasher; Microwave; Refrigerator; Stove/Range
- Bedrooms: 2 bedrooms
- Flooring: Vinyl plank; Carpet
- Bathrooms: 1 full bathroom with tub and shower
- Heating & cooling: Ductless heating; Has cooling
- Interior features: Water heater; Vaulted ceilings; Walk-in closet; Entry; Dining room; Living room
- Laundry & utility: Washer; Dryer
Neighborhood map
What this means for you Summary
Snapshot
- This is a 2-bed/1.0-bath manufactured listed at $125k.
Deal economics
- At list price, monthly cash flow is $727 ($9k/yr) — positive.
- The deal already cash-flows at list — no discount required.
- Meets the 1% rule at list price ($2k rent vs $125k).
- Cap rate 13.3% vs local median 2.2% in Lynnwood — top-decile yield for the area; either an underpriced asset or a hidden risk that comps aren't pricing in. Stress-test before assuming the spread holds.
Location & tenants
- Location reads 77/100 on livability (#150 in WA, #3,226 nationally) — a middle-class / working-renter tenant base. Strengths: commute A+, health & safety A+, employment A; Watch: crime F, cost of living F.
- Edmonds School District (suburban): math 54% / reading 65% proficiency, ranked #53 of 291 in WA (top 18%) — acceptable for families but not a draw, mixed tenant base, ~2y average lease.
- Market conditions: Rents rising (+2.2%/yr); 184 active listings in the ZIP; 40 comparable units currently listed for rent nearby; rentals leasing fast (median 5d on market — plan ~1-2 weeks tenant-placement turnaround); solid renter incomes; 3,982 units permitted in Snohomish County in 2024 (1,492 in 5+ unit buildings).
Forward outlook
- Local home prices are declining (-3.0%/yr); year-one equity from $864 of loan paydown is wiped out by about $4k of value loss. Plan a longer hold.
- Snohomish County population projected at +30% by 2050 — long-run rental-demand tailwind backs the buy-and-hold thesis.
- At projected returns (-3.0% appreciation + 2.2% rent growth), your $35k cash investment doubles in ~6 years — after that, you're playing with house money.
Negotiation context
- Only 1 days on market — expect competitive offers; lowballing is unlikely to land.
Questions for the listing agent
- Built in 1973 — when were the roof, HVAC, electrical panel, plumbing, and water heater last replaced?
- Is there a deadline driving the sale (1031 exchange, divorce, estate, relocation)? That informs how much negotiation room exists.
- Crime grade is F in this area — have there been break-ins, vandalism, or insurance claims at this property in the last 3 years? What carrier currently insures it and at what premium?
- What's the average days-on-market for RENTAL listings here right now (not sales)? A rising rental-DOM trend means longer vacancies and softer asking-rent achievability than the comps imply.
- What's the recent tenant-quality profile in this submarket — average credit score on applications, eviction rate, late-payment / NSF rate, and stable-employment percentage? A property-management company in the area should have these aggregated.
- How much new for-sale + rental construction is in the pipeline within 1–3 miles? Heavy new supply typically softens prices + rents 12–24 months out; constrained supply supports both.
Investment metrics
- 1% rule
- 1.61% ✓
- Cap rate
- 13.28%
- Cash-on-cash
- 24.94%
- DSCR
- 2.11
- GRM
- 5.2
CMA / ARV
No comps found within radius.
Projected returns pro-forma
-3.0% appreciation · 2.25% rent growth · sell at horizon
- IRR
- 17.5%
- Equity multiple
- 1.70×
- Total profit
- $24,589
- Equity at exit
- $18,638
- IRR
- 25.5%
- Equity multiple
- 3.15×
- Total profit
- $75,085
- Equity at exit
- $10,808
Cash invested: $35,000 (down + closing). Projections, not guarantees.
Landlord ↔ Tenant lean methodology
- Overall (STATE)
- 28 Tenant-Leaning
- State Washington
- 28 Tenant-Leaning · D+8
- County
- — inherits STATE
- City
- — inherits STATE
ZIP-level market 98036
- Rents YoY
- 2.2%
- Active inventory
- 184
- Price-to-rent
- 5.2×
Monthly cashflow live
- Estimated rent
- $2,014 high interval (Pro) →
- Mortgage (P&I)
- −$656
- Tax est. 1.5%
- −$156 /mo · $1,875/yr
- Insurance
- −$52
- HOA
- −$0
- Vacancy / Maint / Mgmt
- −$423
- Net cashflow
- $727
Break-even live
UW: 25.0% down · 7.5% · 30yr · 1.5% tax · 5.0% vac · 8.0% maint · 8.0% mgmt
Financing live
Cash to close
- Down payment
- $31,250
- Closing costs
- $3,750
- Reserves months
- —
- Total cash needed
- —
Loan-product check · same deal, 3 products live
Conventional
25% down · 7.5% · 30yr
- Down + closing
- —
- Monthly P&I
- —
- Monthly cashflow
- —
- DSCR
- —
- Eligible?
- —
Personal DTI + credit; lowest rate.
DSCR
20% down · 8.5% · 30yr
- Down + closing
- —
- Monthly P&I
- —
- Monthly cashflow
- —
- DSCR
- —
- Eligible?
- —
No personal income docs; deal must DSCR.
Hard money
10% down · 12.0% · 12mo
- Down + closing
- —
- Monthly P&I
- —
- Monthly cashflow
- —
- DSCR
- —
- Eligible?
- —
Short-term bridge; refi at stabilization.
Rent comps 40 comps
| Address | Beds | Baths | Sqft | Rent | $/sqft | DOM | Units | Dist |
|---|---|---|---|---|---|---|---|---|
| 21011 67th Ave W Unit 7 Lynnwood, WA | 1.0 | 1.0 | 600 | $1,350 | $2.25 | 24d | 1 | 0.25mi |
| 6601 210th St SW Lynnwood, WA | 1.0–2.0 | 1.0 | 975 | $1,830 | $1.88 | 4d | 2 | 0.26mi |
| 6102 St Albion Way Mountlake Terrace, WA | 1.0–2.0 | 1.0 | 862 | $1,740 | $2.02 | 2d | 6 | 0.31mi |
| 6501 208th St SW Lynnwood, WA | 1.0–2.0 | 1.0–2.0 | 850 | $2,119 | $2.49 | 1d | 8 | 0.38mi |
| 20620 60th Ave W Unit D Lynnwood, WA | 3.0 | 2.0 | 1111 | $2,400 | $2.16 | 43d | 1 | 0.42mi |
| 20427 68th Ave W Lynnwood, WA | 1.0–2.0 | 1.0 | 875 | $1,899 | $2.17 | 12d | 8 | 0.56mi |
| 21911 58th Ave W Mountlake Terrace, WA | 2.0 | 1.5 | 1100 | $2,295 | $2.09 | 4d | 1 | 0.57mi |
| 21903 58th Ave W Unit 3G Mountlake Terrace, WA | 2.0 | 1.5 | 1100 | $2,295 | $2.09 | 4d | 1 | 0.61mi |
| 5424 212th St SW Mountlake Terrace, WA | 1.0–2.0 | 1.0 | 763 | $2,995 | $3.93 | 1d | 6 | 0.62mi |
| 21521 73rd Pl W Unit 11 Edmonds, WA | 2.0 | 1.0 | 750 | $1,748 | $2.33 | 43d | 1 | 0.62mi |
| 6008 202nd St SW Unit D Lynnwood, WA | 2.0 | 1.0 | 825 | $1,750 | $2.12 | 16d | 1 | 0.69mi |
| 21416 52nd Ave W Mountlake Terrace, WA | 1.0–2.0 | 1.0 | 700 | $1,875 | $2.68 | 1d | 17 | 0.73mi |
| 7428 208th St SW Edmonds, WA | 2.0 | 1.0 | 792 | $1,949 | $2.46 | 4d | 8 | 0.75mi |
| 5024 212th St SW Unit C Mountlake Terrace, WA | 2.0 | 1.0 | 912 | $1,900 | $2.08 | 43d | 1 | 0.83mi |
| 5812 200th St SW Unit B Lynnwood, WA | 2.0 | 2.0 | 942 | $2,300 | $2.44 | 43d | 1 | 0.83mi |
| 7603 218th St SW Unit A Edmonds, WA | 3.0 | 1.0 | 1000 | $2,250 | $2.25 | 4d | 1 | 0.84mi |
| 5725 200th St SW Lynnwood, WA | 2.0 | 1.0 | 800 | $2,000 | $2.50 | 16d | 1 | 0.91mi |
| 19815 Scriber Lake Rd Lynnwood, WA | 1.0 | 1.0 | 495 | $1,634 | $3.30 | 2d | 10 | 0.92mi |
| 19900 56th Ave W Unit A33 Lynnwood, WA | 1.0 | 1.0 | 675 | $1,645 | $2.44 | 14d | 1 | 0.96mi |
| 5720 198th St SW Lynnwood, WA | 1.0 | 1.0 | 688 | $1,525 | $2.22 | 43d | 1 | 0.97mi |
| 21319 80th Ave W Unit 21317 House Edmonds, WA | 2.0 | 1.0 | 850 | $2,400 | $2.82 | 24d | 1 | 0.98mi |
| 21412 48th Ave W Mountlake Terrace, WA | 1.0–2.0 | 1.0–2.0 | 760 | $2,287 | $3.01 | 1d | 5 | 0.99mi |
| 21323 80th Ave W Edmonds, WA | 1.0–2.0 | 1.0 | 655 | $1,585 | $2.42 | 21d | 2 | 0.99mi |
| 5618 198th St SW Unit 202 Lynnwood, WA | 2.0 | 1.0 | 817 | $1,750 | $2.14 | 3d | 1 | 1.00mi |
| 21112 80th Ave W Edmonds, WA | 2.0 | 1.0 | 1000 | $1,895 | $1.90 | 17d | 1 | 1.06mi |
| 21112 80th Ave W Edmonds, WA | 2.0 | 1.0 | 1000 | $1,895 | $1.90 | 24d | 1 | 1.06mi |
| 4710 212th St SW Mountlake Terrace, WA | 2.0 | 1.0–2.0 | 865 | $2,260 | $2.61 | 2d | 6 | 1.09mi |
| 23400 Highway 99 Edmonds, WA | 2.0 | 1.0–2.0 | 790 | $2,654 | $3.36 | 1d | 14 | 1.11mi |
| 6707 196th St SW Lynnwood, WA | 2.0 | 1.5 | 1000 | $2,449 | $2.45 | 3d | 1 | 1.12mi |
| 22817 Lakeview Dr Mountlake Terrace, WA | 1.0–2.0 | 1.0 | 887 | $2,135 | $2.41 | 1d | 8 | 1.13mi |
| 23005 60th Ave W Mountlake Terrace, WA | 2.0 | 2.0 | 912 | $2,750 | $3.02 | 21d | 1 | 1.15mi |
| 4402 212th St SW Mountlake Terrace, WA | 2.0 | 1.0 | 880 | $2,125 | $2.41 | 4d | 1 | 1.17mi |
| 4403 216th St SW Unit C Mountlake Terrace, WA | 2.0 | 2.0 | 1020 | $2,650 | $2.60 | 4d | 1 | 1.19mi |
| 4800 200th St SW Unit E201 Lynnwood, WA | 2.0 | 2.0 | 971 | $2,300 | $2.37 | 4d | 1 | 1.20mi |
| 7221 196th St SW Lynnwood, WA | 2.0–3.0 | 2.0–2.5 | 1172 | $2,300 | $1.96 | 1d | 4 | 1.23mi |
| 4807 200th St SW Lynnwood, WA | 2.0–3.0 | 1.0 | 935 | $1,550 | $1.66 | 1d | 12 | 1.23mi |
| 19800 50th Ave W Lynnwood, WA | 2.0 | 1.0 | 854 | $1,790 | $2.10 | 2d | 4 | 1.24mi |
| 21010 83rd Ave W Edmonds, WA | 1.0 | 1.0 | 741 | $1,950 | $2.63 | 2d | 1 | 1.26mi |
| 20921 44th Ave W Lynnwood, WA | 2.0–4.0 | 2.0 | 1273 | $1,900 | $1.49 | 1d | 3 | 1.27mi |
| 22906 76th Ave W Edmonds, WA | 2.0 | 1.0 | 800 | $2,222 | $2.78 | 4d | 3 | 1.28mi |
Listing history 2 events
-
2026-06-17remarks 687-char remark
-
2026-06-17$125,000 Active 1 DOM
ⓘ Source: listings_history table (triggers on properties + properties_extension) + one-shot
backfill from property_details.listing_events for pre-trigger history.
Nearby sold comps map
Loading sold comps map…
Walkable amenities ~0.75 mi
Loading nearby amenities…
Taxation est. · year 1
- Rental income
- $24,169
- − Mortgage interest
- −$7,002
- − Property taxes
- −$1,875
- − Insurance
- −$625
- − Repairs & maintenance
- −$1,934
- − Management
- −$1,934
- − Depreciation
- −$3,636
- Taxable income
- $7,164
- Est. tax owed @ 24.0%
- −$1,719
- After-tax cash flow
- $7,008/yr
For passive investors: Depreciation is non-cash, so a rental often shows a tax loss while cash-flowing — sheltering income. Rental losses are passive: they offset passive income freely, and up to $25,000/yr can offset ordinary (W-2) income if you actively participate and your MAGI is under $100k (phasing out to $0 by $150k); unused losses carry forward. On sale, claimed depreciation is recaptured at up to 25%, and gains may owe capital-gains tax (a 1031 exchange can defer both). Figures are a year-1 estimate at your 24.0% rate — not tax advice; consult a CPA.
Schools (NCES district)
- District
- Edmonds School District
- NCES district ID
- 5302400
- Math proficiency
- 54% ▼ -1.00%
- Reading proficiency
- 65% ▬ 0.00%
- Median HH income
- $67,451
- Composite
- 53.94/100
- National rank
- #3026
- State rank
- #53 of 291 in WA
Livability — Lynnwood
- Score
- 77/100
- State rank
- #150
- US rank
- #3226
Category grades
Schools grade is shown separately in the Schools card above.
Census & demographics
- Census place
- Lynnwood, WA
- County
- Snohomish County · 786,756 people
- City population
- 152,865
- Metro
- Seattle-Tacoma-Bellevue, WA
- Population (ZIP)
- 42,370
- Household income
- $88,958
- Rent vs Own
- Severe rent burden
- 1781.0
Population outlook (Snohomish County) Hauer SSP2
- Today (2025)
- 899,800 people
- By 2030
- 960,975 · +6.8%
- By 2040
- 1,074,447 · +19.4%
- By 2050
- 1,171,954 · +30.2%
- By 2075
- 1,384,849 · +53.9%
- By 2100
- 1,497,296 · +66.4%
Race, ethnicity, and origin ACS 2023
- Neighborhood character
- Diverse neighborhood (Simpson 0.63)
- Race & ethnicity
- White 56% Asian 18% Hispanic / Latino 11% Two or more races 9% Black 9%
- Hispanic origin (detail)
- Mexican 8%
- Common ancestry
- Portuguese 5% Italian 4% Lithuanian 2%
- Foreign-born
- 27% · Canada, Vietnam, China
- Languages at home
- 65% English-only · Spanish 8% Other Indo-European 4% Other Asian/Pacific 4%
Political lean MEDSL · Snohomish
- 2024 margin
- D (+19.0) · D 57.8% · R 38.9% · Other 3.3%
- 2008→2024 swing
- +0.1pp no change · 2008: 18.9pp · 2024: 19.0pp
- All cycles
- 2024: D+19.0 2020: D+20.6 2016: D+16.6 2012: D+16.2 2008: D+18.9
Not yet ingested
- Civics
- —
Market trends
- HPI YoY
- ▼ -914.47%
- Current HPI
- 354.9913
- Rent YoY
- ▲ 2.25%
- Metro
- Seattle-Tacoma-Bellevue, WA
- State GDP YoY
- ▲ 4.65%
- F500 in state
- 22
Industry mix (Fortune 500 HQ in WA)
| Industry | F500 HQs | Revenue |
|---|---|---|
| Retail | 2 | $269B |
|
||
| Technology / Retail | 1 | $638B |
|
||
| Technology | 1 | $245B |
|
||
| Telecommunications | 1 | $38B |
|
||
| Food / Beverage | 1 | $36B |
|
||
| Automotive / Trucks | 1 | $34B |
|
||
Price history
1 event — show timeline
- 2026-06-17 Listed $125,000 NWMLS as Distributed by MLS Grid
Property tax history
+9.2%/yrLatest (2026): $227 · +20.5% YoY. Source: county tax records.
Cash-flow waterfall
monthlySold comps — $/sqft
last 12 mo · ≤1 miLoading sold comps…