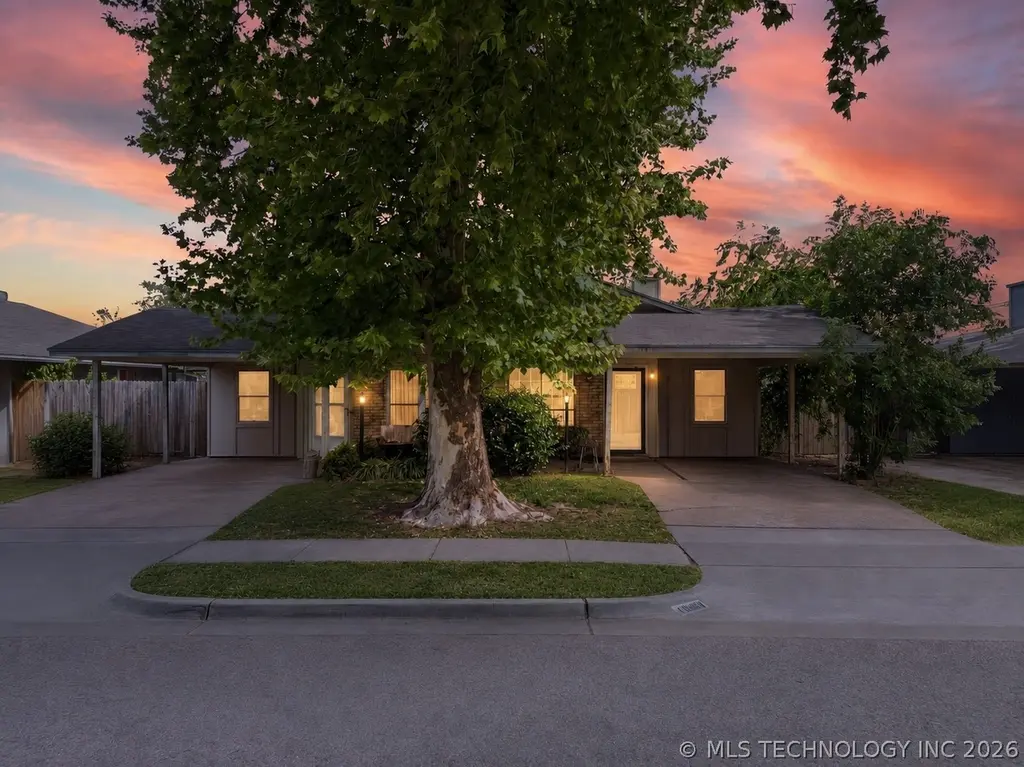
11039 E 15th St · Tulsa, OK
Flood risk 1/10 · Minimal
- FEMA flood zone
- X (unshaded)
- Chance of flooding over 30 yrs
- 0.0%
- Est. flood insurance / yr
- $473 – $860
Fire risk 1/10 · Minimal
- Est. fire insurance / yr
- $2,463 – $4,575
Heat risk 7/10 · Major
- Hot days now (above 110°F)
- 7 days/yr
- Hot days in 30 yrs
- 19 days/yr
Wind risk 2/10 · Minimal
- Chance of severe wind over 30 yrs
- 4.0%
Air-quality risk 2/10 · Minimal
- Unhealthy air days now
- 1 days/yr
- Unhealthy air days in 30 yrs
- 1 days/yr
Risk factors via First Street. Map © Google.
Why this score? — see what drove the B grade
The composite is a weighted blend of 9 inputs, each scored 0–100. Each bar is that input's sub-score; the figure is the points it added to the 100-point composite (weight × sub-score).
- Cash flow +29.9/30.0
- ARV discount +15.0/15.0
- DSCR +10.0/10.0
- 1% rule +8.0/10.0
- Livability +3.8/5.0
- Rent growth +2.5/5.0
- Condition / age +2.5/5.0
- Schools +0.8/10.0
- Appreciation +0.0/10.0
$90,000
🖨 Deal sheet (PDF) 📄 Offer letter ✓ Due diligence
Listing remarks MLS
Investors - All we need is paint & carpet. Air Conditioner 3 or 4 months old. Heat approx 2 years, hot water newer. Pullman bath to hall out of master bath to utility.
Key facts
- Garage
- Community pool
- Built 1975
Property features AI
Finance
- HOA & community: Homeowners association with annual fee; HOA amenities include a park and a pool
Exterior
- Parking: 1-car garage; Carport
- Security: Smoke detector(s); No safety shelter
- Utilities: Public water; Public sewer; Electricity available; Cable available
- Home design: Single-story; North-facing; Slab foundation
- Construction: Stone veneer, stucco, and wood frame construction; Asphalt/fiberglass roof
- Exterior features: Concrete driveway; Patio; Privacy fencing; Mature trees
Interior
- Kitchen: Dishwasher; Oven; Range; Disposal; Electric water heater
- Flooring: Carpet; Laminate; Tile
- Bathrooms: One full bathroom
- Heating & cooling: Central heating (electric and gas); Central air conditioning
- Interior features: Ceiling fan(s); Programmable thermostat; Laminate counters; Aluminum window frames
- Laundry & utility: Washer hookup; Electric dryer hookup
Neighborhood map
What this means for you Summary
Snapshot
- This is a 2-bed/1.0-bath single-family listed at $90k.
Deal economics
- At list price, monthly cash flow is $334 ($4k/yr) — positive.
- The deal already cash-flows at list — no discount required.
- Meets the 1% rule at list price ($1k rent vs $90k).
- Cap rate 10.7% vs local median 3.8% in Tulsa — top-decile yield for the area; either an underpriced asset or a hidden risk that comps aren't pricing in. Stress-test before assuming the spread holds.
Location & tenants
- Location reads 75/100 on livability (#13 in OK, #4,058 nationally) — a middle-class / working-renter tenant base. Strengths: amenities A+, commute A+, cost of living A+; Watch: schools F, crime F, employment D-.
- Tulsa (urban): math 7% / reading 12% proficiency, ranked #250 of 270 in OK (top 93%) — low school quality limits family demand, transient renter base, plan for 1-2y turnover; 76% free/reduced lunch — lower-income household profile, screen leases tightly.
- Market conditions: 38 active listings in the ZIP; 19 comparable units currently listed for rent nearby; rentals at typical pace (median 18d on market — plan ~3-4 weeks tenant-placement turnaround); 2,818 units permitted in Tulsa County in 2024 (518 in 5+ unit buildings).
Forward outlook
- Local home prices are declining (-3.0%/yr); year-one equity from $622 of loan paydown is wiped out by about $3k of value loss. Plan a longer hold.
- Tulsa County population projected at +30% by 2050 — long-run rental-demand tailwind backs the buy-and-hold thesis.
- At projected returns (-3.0% appreciation + 3.0% rent growth), your $25k cash investment doubles in ~8 years — after that, you're playing with house money.
Negotiation context
- Only 8 days on market — expect competitive offers; lowballing is unlikely to land.
- 3 sale attempts since 15y ago with the ask held roughly flat each time — persistent listings suggest the price (not the market) is what's stuck; bring a comps-based counter.
- Current owner paid $26k; list at $90k implies a 246% gain — meaningful room to come down on a strong offer.
Risks & watch-outs
- Climate carrying-cost: extreme-heat days projected 7→19/yr by 2055 (HVAC capex compounding) — expect insurance premiums to compound above CPI over the hold.
Questions for the listing agent
- Built in 1975 — when were the roof, HVAC, electrical panel, plumbing, and water heater last replaced?
- What does the HOA fee cover, when was the last increase, and are there any pending special assessments or reserve-fund shortfalls?
- Is there a deadline driving the sale (1031 exchange, divorce, estate, relocation)? That informs how much negotiation room exists.
- Schools are F-rated, which usually means shorter tenancies and higher turnover. Who's the typical renter profile here, and what's been the actual vacancy rate?
- Crime grade is F in this area — have there been break-ins, vandalism, or insurance claims at this property in the last 3 years? What carrier currently insures it and at what premium?
- What's the average days-on-market for RENTAL listings here right now (not sales)? A rising rental-DOM trend means longer vacancies and softer asking-rent achievability than the comps imply.
- What's the recent tenant-quality profile in this submarket — average credit score on applications, eviction rate, late-payment / NSF rate, and stable-employment percentage? A property-management company in the area should have these aggregated.
- How much new for-sale + rental construction is in the pipeline within 1–3 miles? Heavy new supply typically softens prices + rents 12–24 months out; constrained supply supports both.
Investment metrics
- 1% rule
- 1.30% ✓
- Cap rate
- 10.75%
- Cash-on-cash
- 15.90%
- DSCR
- 1.71
- GRM
- 6.4
CMA / ARV
- ARV (on-the-fly)
- $126,678
- Comps found
- 12
Show comp detail 12 sales within ~0.75 mi
| Address | Dist | Beds/Ba | Sqft | Sold | Price | $/sf | Match |
|---|---|---|---|---|---|---|---|
| 11039 E 15th St | 0.00mi | 2/1.0 | 982 (0%) | 1mo | $80,000 | $81 | 100 |
| 1455 S 112th East Ave | 0.05mi | 2/1.0 | 982 (0%) | 2mo | $115,000 | $117 | 96 |
| 11056 E 14th Ct | 0.02mi | 2/1.0 | 959 (-2%) | 2mo | $101,900 | $106 | 93 |
| 10928 E 16th St | 0.13mi | 2/1.0 | 968 (-1%) | 3mo | $98,900 | $102 | 89 |
| 11618 E 15th St | 0.25mi | 2/1.0 | 983 (+0%) | 1mo | $154,000 | $157 | 88 |
| 11008 E 14th Ct | 0.06mi | 2/1.0 | 1,030 (+5%) | 2mo | $89,500 | $87 | 87 |
| 11525 E 16th St | 0.22mi | 3/2.0 (+1) | 1,012 (+3%) | 5mo | $178,000 | $176 | 72 |
| 1514 S 108th EastPlace | 0.18mi | 2/1.0 | 872 (-11%) | 3mo | $35,000 | $40 | 71 |
| 11720 E 20th St | 0.57mi | 3/1.5 (+1) | 962 (-2%) | 4mo | $181,000 | $188 | 60 |
| 1817 S 119th East Pl E | 0.59mi | 3/1.0 (+1) | 1,029 (+5%) | 7mo | $135,500 | $132 | 53 |
| 10613 E 18th Pl | 0.47mi | 3/1.5 (+1) | 1,100 (+12%) | 7mo | $142,000 | $129 | 45 |
| 1824 S 119th EastAvenue | 0.53mi | 3/2.0 (+1) | 1,123 (+14%) | 0mo | $174,000 | $155 | 42 |
Match score weights: distance 35% · size 25% · config 20% · recency 20%. Top-matched comps best support the ARV.
Projected returns pro-forma
-3.0% appreciation · 3.0% rent growth · sell at horizon
- IRR
- 6.8%
- Equity multiple
- 1.27×
- Total profit
- $6,688
- Equity at exit
- $13,419
- IRR
- 16.1%
- Equity multiple
- 2.32×
- Total profit
- $33,210
- Equity at exit
- $7,782
Cash invested: $25,200 (down + closing). Projections, not guarantees.
Landlord ↔ Tenant lean methodology
- Overall (STATE)
- 83 Strongly Landlord-Friendly
- State Oklahoma
- 83 Strongly Landlord-Friendly · R+20
- County
- — inherits STATE
- City
- — inherits STATE
ZIP-level market 74128
- Home prices YoY
- -21.6%
- Active inventory
- 38
- Price-to-rent
- 6.4×
Monthly cashflow live
- Estimated rent
- $1,171 high interval (Pro) →
- Mortgage (P&I)
- −$472
- Tax from tax record
- −$72 /mo · $860/yr
- Insurance
- −$38
- HOA
- −$10
- Vacancy / Maint / Mgmt
- −$246
- Net cashflow
- $334
Break-even live
Sensitivity live
| Price | -10% $385 | -5% $359 | +0% $334 | +5% $309 | +10% $283 |
|---|---|---|---|---|---|
| Rent | -10% $241 | -5% $288 | +0% $334 | +5% $380 | +10% $427 |
| Rate | -1.0pp $379 | -0.5pp $357 | base $334 | +0.5pp $311 | +1.0pp $287 |
UW: 25.0% down · 7.5% · 30yr · 1.5% tax · 5.0% vac · 8.0% maint · 8.0% mgmt
Financing live
Cash to close
- Down payment
- $22,500
- Closing costs
- $2,700
- Reserves months
- —
- Total cash needed
- —
Loan-product check · same deal, 3 products live
Conventional
25% down · 7.5% · 30yr
- Down + closing
- —
- Monthly P&I
- —
- Monthly cashflow
- —
- DSCR
- —
- Eligible?
- —
Personal DTI + credit; lowest rate.
DSCR
20% down · 8.5% · 30yr
- Down + closing
- —
- Monthly P&I
- —
- Monthly cashflow
- —
- DSCR
- —
- Eligible?
- —
No personal income docs; deal must DSCR.
Hard money
10% down · 12.0% · 12mo
- Down + closing
- —
- Monthly P&I
- —
- Monthly cashflow
- —
- DSCR
- —
- Eligible?
- —
Short-term bridge; refi at stabilization.
Rent comps 19 comps
| Address | Beds | Baths | Sqft | Rent | $/sqft | DOM | Units | Dist |
|---|---|---|---|---|---|---|---|---|
| 1448 S 108th East Pl Tulsa, OK | 2.0 | 1.0 | 982 | $1,350 | $1.37 | 17d | 1 | 0.20mi |
| 1433 S 107th East Ave Tulsa, OK | 1.0–3.0 | 1.0–1.5 | 840 | $999 | $1.19 | 20d | 3 | 0.26mi |
| 2140 S 109th East Ave Unit 2158A Tulsa, OK | 1.0 | 1.0 | 864 | $600 | $0.69 | 25d | 1 | 0.65mi |
| 2140 S 109th East Ave Unit 2142C Tulsa, OK | 2.0 | 1.5 | 1000 | $895 | $0.90 | 25d | 1 | 0.65mi |
| 1018 S 107th East Ave Tulsa, OK | 1.0–2.0 | 1.0 | 807 | $925 | $1.15 | 25d | 6 | 0.65mi |
| 1645 S 101st East Ave Tulsa, OK | 1.0–3.0 | 1.0–2.0 | 1013 | $1,624 | $1.60 | 3d | 35 | 0.66mi |
| 10951 E 23rd St Unit 10967 Tulsa, OK | 2.0 | 1.5 | 800 | $1,149 | $1.44 | 4d | 1 | 0.73mi |
| 10951 E 23rd St Unit 10959 Tulsa, OK | 2.0 | 1.5 | 767 | $1,149 | $1.50 | 25d | 1 | 0.73mi |
| 10951 E 23rd St Unit 10967 D Tulsa, OK | 1.0 | 1.5 | 767 | $1,075 | $1.40 | 25d | 1 | 0.73mi |
| 1129 S 124th East Ave Tulsa, OK | 2.0 | 1.0 | 1100 | $1,100 | $1.00 | 17d | 1 | 0.91mi |
| 9743 E 12th St Tulsa, OK | 1.0–2.0 | 1.0–1.5 | 875 | $975 | $1.11 | 17d | 3 | 0.91mi |
| 10124 E 22nd St Tulsa, OK | 3.0 | 2.0 | 1117 | $1,350 | $1.21 | 16d | 1 | 0.93mi |
| 717 S 101st East Ave Tulsa, OK | 1.0–2.0 | 1.0 | 786 | $1,049 | $1.33 | 3d | 11 | 0.94mi |
| 2319 S 119th East Ave Tulsa, OK | 3.0 | 1.0 | 990 | $1,365 | $1.38 | 25d | 1 | 0.96mi |
| 1801 S 132nd East Pl Tulsa, OK | 2.0–3.0 | 1.5–2.0 | 975 | $1,199 | $1.23 | 22d | 4 | 1.11mi |
| 1801 S 132nd East Pl Tulsa, OK | 2.0–3.0 | 1.0–2.0 | 950 | $1,184 | $1.25 | 3d | 4 | 1.11mi |
| 2756 S 114th East Ave Tulsa, OK | 3.0 | 2.0 | 1120 | $1,650 | $1.47 | 25d | 1 | 1.17mi |
| 912 S 95th East Ave Tulsa, OK | 1.0 | 1.0 | 650 | $765 | $1.18 | 4d | 2 | 1.23mi |
| 444 S Mingo Rd Tulsa, OK | 3.0 | 1.0 | 800 | $1,045 | $1.31 | 17d | 5 | 1.47mi |
HOA detail
- Monthly dues
- $10 · $120/yr
- Likely covers
- water
Listing history 8 events
-
2026-05-15status Pending
-
2026-05-07$90,000 Active
-
2014-06-25soldstatus $26,000 173-char remark
Show marketing remark (173 chars)
Investors - All we need is paint & carpet. Air Conditioner 3 or 4 months old. Heat approx 2 years, hot water newer. Pullman bath to hall out of master bath to utility.
-
2014-05-29historical 173-char remark
Show marketing remark (173 chars)
Investors - All we need is paint & carpet. Air Conditioner 3 or 4 months old. Heat approx 2 years, hot water newer. Pullman bath to hall out of master bath to utility.
-
2014-05-20$35,000 173-char remark
Show marketing remark (173 chars)
Investors - All we need is paint & carpet. Air Conditioner 3 or 4 months old. Heat approx 2 years, hot water newer. Pullman bath to hall out of master bath to utility.
-
2012-04-17historical
-
2011-10-24$25,000
-
1990-02-01soldstatus $23,500
ⓘ Source: listings_history table (triggers on properties + properties_extension) + one-shot
backfill from property_details.listing_events for pre-trigger history.
Tax reassessment forecast OK · Resets to sale price
- Current annual tax
- $860 · $72/mo
- Projected year-2 tax
- $860 · $72/mo
- Expected delta
- $0/yr ($0/mo · 0.0%)
ⓘ Screening estimate from a state-policy table — verify with the county assessor before closing.
Climate risk First Street
- Flood 1/10 Low FEMA zone X (unshaded) · 0% chance over 30 yrs
- Wildfire 1/10 Low
- Heat 7/10 Severe 7 d/yr ≥110°F today · 19 d/yr by 30 yrs out
- Wind 2/10 Low 4% chance of damaging wind over 30 yrs
- Air quality 2/10 Low 1 unhealthy d/yr today · 1 by 30 yrs out
Nearby sold comps map
Loading sold comps map…
Walkable amenities ~0.75 mi
Loading nearby amenities…
Taxation est. · year 1
- Rental income
- $14,053
- − Mortgage interest
- −$5,041
- − Property taxes
- −$860
- − Insurance
- −$450
- − Repairs & maintenance
- −$1,124
- − Management
- −$1,124
- − HOA
- −$120
- − Depreciation
- −$2,618
- Taxable income
- $2,715
- Est. tax owed @ 24.0%
- −$652
- After-tax cash flow
- $3,356/yr
For passive investors: Depreciation is non-cash, so a rental often shows a tax loss while cash-flowing — sheltering income. Rental losses are passive: they offset passive income freely, and up to $25,000/yr can offset ordinary (W-2) income if you actively participate and your MAGI is under $100k (phasing out to $0 by $150k); unused losses carry forward. On sale, claimed depreciation is recaptured at up to 25%, and gains may owe capital-gains tax (a 1031 exchange can defer both). Figures are a year-1 estimate at your 24.0% rate — not tax advice; consult a CPA.
Schools (NCES district)
- District
- Tulsa
- NCES district ID
- 4030240
- Math proficiency
- 7% ▼ -9.00%
- Reading proficiency
- 12% ▼ -7.00%
- Median HH income
- $37,895
- Composite
- 8.04/100
- National rank
- #9919
- State rank
- #250 of 270 in OK
Livability — Tulsa
- Score
- 75/100
- State rank
- #13
- US rank
- #4058
Category grades
Schools grade is shown separately in the Schools card above.
Census & demographics
- Census place
- Tulsa, OK
- County
- Tulsa County · 640,811 people
- City population
- 389,418
- Metro
- Tulsa, OK
- Population (ZIP)
- 13,751
- Household income
- $52,195
- Rent vs Own
- Severe rent burden
- 382.0
Population outlook (Tulsa County) Hauer SSP2
- Today (2025)
- 723,846 people
- By 2030
- 766,033 · +5.8%
- By 2040
- 851,386 · +17.6%
- By 2050
- 938,389 · +29.6%
- By 2075
- 1,166,011 · +61.1%
- By 2100
- 1,350,277 · +86.5%
Race, ethnicity, and origin ACS 2023
- Neighborhood character
- Diverse neighborhood (Simpson 0.69)
- Race & ethnicity
- Hispanic / Latino 39% White 38% Two or more races 23% Black 10% Asian 4% Native American 4%
- Hispanic origin (detail)
- Mexican 32%
- Common ancestry
- Italian 1% Slovak 1% Romanian 1%
- Foreign-born
- 19% · Canada
- Languages at home
- 59% English-only · Spanish 36% Other Asian/Pacific 2% Other Indo-European 1%
Political lean MEDSL · Tulsa
- 2024 margin
- R (+15.2) · D 41.3% · R 56.5% · Other 2.2%
- 2008→2024 swing
- +9.2pp toward D · 2008: -24.5pp · 2024: -15.2pp
- All cycles
- 2024: R+15.2 2020: R+15.6 2016: R+22.9 2012: R+27.4 2008: R+24.5
Not yet ingested
- Civics
- —
Market trends
- HPI YoY
- ▼ -66.16%
- Current HPI
- 240.6763
- Rent YoY
- —
- Metro
- Tulsa, OK
- State GDP YoY
- ▲ 1.55%
- F500 in state
- 6
Industry mix (Fortune 500 HQ in OK)
| Industry | F500 HQs | Revenue |
|---|---|---|
| Energy | 3 | $48B |
|
||
Price history
+283.0% since first listed8 events — show timeline
- 2026-05-15 Pending — MLS Technology, Inc.
- 2026-05-07 Listed $90,000 MLS Technology, Inc.
- 2014-06-25 Sold (MLS) $26,000 MLS Technology, Inc.
- 2014-05-29 Listing Removed — MLS Technology, Inc.
- 2014-05-20 Listed $35,000 MLS Technology, Inc.
- 2012-04-17 Listing Removed — MLS Technology, Inc.
- 2011-10-24 Listed $25,000 MLS Technology, Inc.
- 1990-02-01 Sold (Public Records) $23,500 Public Records
Property tax history
+1.8%/yrLatest (2025): $860 · +8.6% YoY. Source: county tax records.
Cash-flow waterfall
monthlySold comps — $/sqft
last 12 mo · ≤1 miLoading sold comps…