 🏷️ Likely Rental
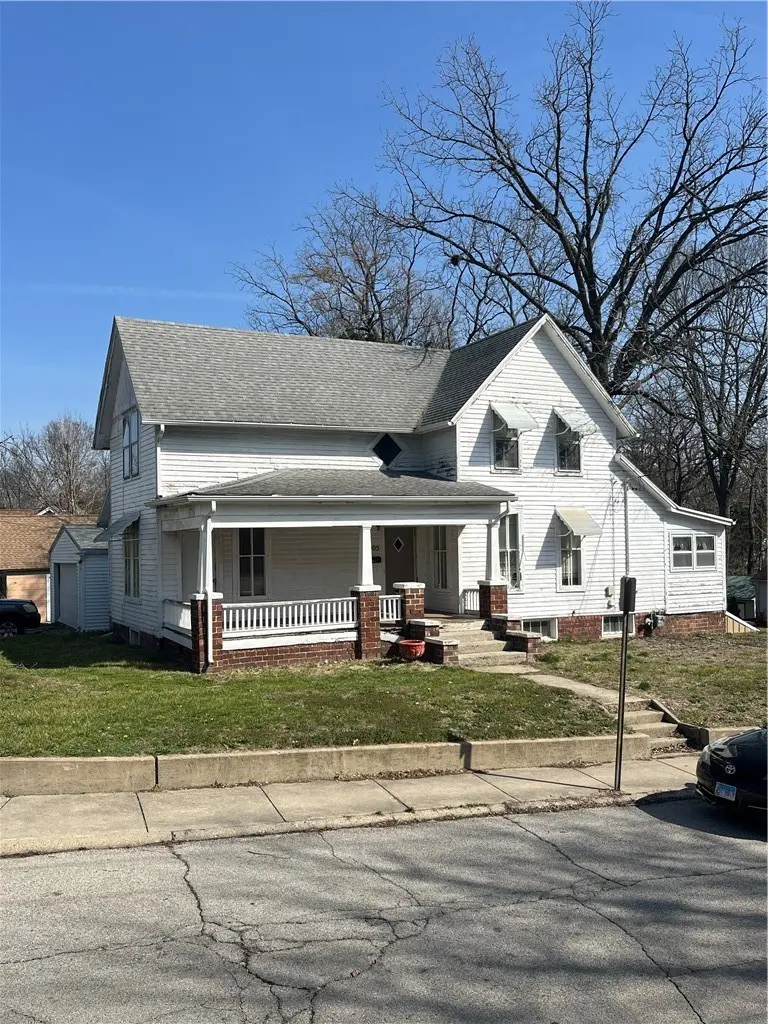
805 Harrison Ave · Charleston, IL
Flood risk 1/10 · Minimal
- FEMA flood zone
- X (unshaded)
- Chance of flooding over 30 yrs
- 0.0%
- Est. flood insurance / yr
- $473 – $860
Fire risk 1/10 · Minimal
- Est. fire insurance / yr
- $804 – $1,492
Heat risk 4/10 · Minor
- Hot days now (above 105°F)
- 7 days/yr
- Hot days in 30 yrs
- 19 days/yr
Wind risk 2/10 · Minimal
- Chance of severe wind over 30 yrs
- 1.0%
Air-quality risk 2/10 · Minimal
- Unhealthy air days now
- 1 days/yr
- Unhealthy air days in 30 yrs
- 1 days/yr
Risk factors via First Street. Map © Google.
Why this score? — see what drove the B- grade
The composite is a weighted blend of 9 inputs, each scored 0–100. Each bar is that input's sub-score; the figure is the points it added to the 100-point composite (weight × sub-score).
- Cash flow +30.0/30.0
- 1% rule +10.0/10.0
- DSCR +10.0/10.0
- ARV discount +7.5/15.0
- Livability +3.7/5.0
- Rent growth +2.5/5.0
- Condition / age +2.5/5.0
- Schools +1.4/10.0
- Appreciation +0.0/10.0
$49,900
🖨 Deal sheet 📄 Offer letter ✓ Due diligence
Listing remarks MLS
Step into this spacious 4-bedroom, 3.5-bath home featuring beautiful inlaid hardwood floors and an abundance of original charm. With large rooms, tall ceilings, and a classic layout, this property offers the perfect opportunity for your vision and creativity. Bring your tools and ideas—this home is ready for your special touch. The expansive basement was previously used as an apartment, offering excellent potential for an income-producing space or additional living quarters. Recent updates include a newer hot water heater and furnace/AC, the roof was new in 2016, giving you a head start on improvements. The home is currently livable, with a recent tenant, but would truly shine with thoughtful updates and renovations. With a motivated seller and endless possibilities, this is a prime opportunity for investors or buyers looking to build equity. Don’t miss your chance to unlock the full potential of this unique property—schedule your showing today!
Key facts
- Recent updates
- Expansive basement
- Unique property
Tags
Neighborhood map
What this means for you Summary
Snapshot
- This is a 3-bed/1.0-bath single-family listed at $50k.
Deal economics
- At list price, monthly cash flow is $433 ($5k/yr) — positive.
- The deal already cash-flows at list — no discount required.
- Meets the 1% rule at list price ($1k rent vs $50k).
- Recommended offer: $48k (3.0% below list) — sets the bar for market timing.
- Cap rate 16.7% vs local median 4.0% in Charleston — top-decile yield for the area; either an underpriced asset or a hidden risk that comps aren't pricing in. Stress-test before assuming the spread holds.
Location & tenants
- Location reads 73/100 on livability (#293 in IL) — a middle-class / working-renter tenant base. Strengths: cost of living A+, housing A+, health & safety A+; Watch: crime C-, amenities C-, schools F.
- Charleston CUSD 1 (town): math 14% / reading 21% proficiency, ranked #489 of 620 in IL (top 79%) — low school quality limits family demand, transient renter base, plan for 1-2y turnover.
- Market conditions: 125 active listings in the ZIP; 34 units permitted in Coles County in 2024 (30 in 5+ unit buildings).
Forward outlook
- Local home prices are declining (-3.0%/yr); year-one equity from $345 of loan paydown is wiped out by about $1k of value loss. Plan a longer hold.
- Coles County population projected to shrink 7% by 2050 — rents likely to lag national; underwrite the cash flow, not the appreciation.
- At projected returns (-3.0% appreciation + 3.0% rent growth), your $14k cash investment doubles in ~4 years — after that, you're playing with house money.
Negotiation context
- It's been on market 48 days — a 3% lower offer ($48k) is reasonable based on typical stale-listing flexibility.
Risks & watch-outs
- Watch-outs: property tax is 4.5% of price; built in 1886 — expect roof / HVAC / electrical / plumbing capex.
Questions for the listing agent
- It's been on market 48 days. Have you received any prior offers? Is the seller open to a 3% concession, seller financing, or rate buy-down credit?
- Built in 1886 — when were the roof, HVAC, electrical panel, plumbing, and water heater last replaced?
- Property tax is high relative to price — has the assessment been appealed recently, and will the sale trigger a re-assessment?
- Is there a deadline driving the sale (1031 exchange, divorce, estate, relocation)? That informs how much negotiation room exists.
- Schools are F-rated, which usually means shorter tenancies and higher turnover. Who's the typical renter profile here, and what's been the actual vacancy rate?
- What's the average days-on-market for RENTAL listings here right now (not sales)? A rising rental-DOM trend means longer vacancies and softer asking-rent achievability than the comps imply.
- What's the recent tenant-quality profile in this submarket — average credit score on applications, eviction rate, late-payment / NSF rate, and stable-employment percentage? A property-management company in the area should have these aggregated.
- How much new for-sale + rental construction is in the pipeline within 1–3 miles? Heavy new supply typically softens prices + rents 12–24 months out; constrained supply supports both.
Investment metrics
- 1% rule
- 2.29% ✓
- Cap rate
- 16.71%
- Cash-on-cash
- 37.22%
- DSCR
- 2.66
- GRM
- 3.6
CMA / ARV
- ARV (median comp)
- $133,189
- List price
- $49,900
- Delta
- -62.53%
- Verdict
- UNDERPRICED
- Comps
- 20 within 1.0 mi
Show comp detail 12 sales within ~0.75 mi
| Address | Dist | Beds/Ba | Sqft | Sold | Price | $/sf | Match |
|---|---|---|---|---|---|---|---|
| 805 Harrison Ave | 0.00mi | 4/3.5 (+1) | 2,004 (0%) | 1mo | $45,000 | $22 | 84 |
| 918 10th St | 0.22mi | 4/2.0 (+1) | 1,976 (-1%) | 3mo | $192,000 | $97 | 76 |
| 829 10th St | 0.13mi | 3/1.5 | 1,846 (-8%) | 4mo | $185,000 | $100 | 75 |
| 845 10th St | 0.15mi | 3/1.5 | 2,157 (+8%) | 12mo | $160,000 | $74 | 68 |
| 875 10th St | 0.19mi | 4/2.0 (+1) | 2,160 (+8%) | 1mo | $156,500 | $72 | 68 |
| 943 2nd St | 0.41mi | 4/2.5 (+1) | 2,021 (+1%) | 6mo | $198,000 | $98 | 63 |
| 1418 10th St | 0.45mi | 3/1.5 | 2,069 (+3%) | 10mo | $126,000 | $61 | 63 |
| 6 Brosam Dr | 0.18mi | 3/2.0 | 1,728 (-14%) | 2mo | $152,500 | $88 | 63 |
| 1015 10th St | 0.36mi | 4/2.0 (+1) | 1,786 (-11%) | 0mo | $212,000 | $119 | 56 |
| 1221 Madison Ave | 0.40mi | 4/3.0 (+1) | 1,944 (-3%) | 10mo | $80,000 | $41 | 56 |
| 409 3rd St | 0.39mi | 3/1.5 | 1,752 (-13%) | 5mo | $55,000 | $31 | 55 |
| 1900 Van Buren Ave | 0.61mi | 3/1.5 | 2,214 (+10%) | 13mo | $157,900 | $71 | 42 |
Match score weights: distance 35% · size 25% · config 20% · recency 20%. Top-matched comps best support the ARV.
Projected returns pro-forma
-3.0% appreciation · 3.0% rent growth · sell at horizon
- IRR
- 33.2%
- Equity multiple
- 2.40×
- Total profit
- $19,609
- Equity at exit
- $7,440
- IRR
- 40.3%
- Equity multiple
- 4.79×
- Total profit
- $52,994
- Equity at exit
- $4,314
Cash invested: $13,972 (down + closing). Projections, not guarantees.
Landlord ↔ Tenant lean methodology
- Overall (STATE)
- 43 Moderately Tenant-Leaning
- State Illinois
- 43 Moderately Tenant-Leaning · D+7
- County
- — inherits STATE
- City
- — inherits STATE
ZIP-level market 61920
- Home prices YoY
- -28.1%
- Active inventory
- 125
- Price-to-rent
- 3.6×
Monthly cashflow live
- Estimated rent
- $1,140 medium interval (Pro) →
- Mortgage (P&I)
- −$262
- Tax from tax record
- −$185 /mo · $2,221/yr
- Insurance
- −$21
- HOA
- −$0
- Vacancy / Maint / Mgmt
- −$239
- Net cashflow
- $433
Break-even live
UW: 25.0% down · 7.5% · 30yr · 1.5% tax · 5.0% vac · 8.0% maint · 8.0% mgmt
Financing live
Cash to close
- Down payment
- $12,475
- Closing costs
- $1,497
- Reserves months
- —
- Total cash needed
- —
Loan-product check · same deal, 3 products live
Conventional
25% down · 7.5% · 30yr
- Down + closing
- —
- Monthly P&I
- —
- Monthly cashflow
- —
- DSCR
- —
- Eligible?
- —
Personal DTI + credit; lowest rate.
DSCR
20% down · 8.5% · 30yr
- Down + closing
- —
- Monthly P&I
- —
- Monthly cashflow
- —
- DSCR
- —
- Eligible?
- —
No personal income docs; deal must DSCR.
Hard money
10% down · 12.0% · 12mo
- Down + closing
- —
- Monthly P&I
- —
- Monthly cashflow
- —
- DSCR
- —
- Eligible?
- —
Short-term bridge; refi at stabilization.
Listing history 3 events
-
2026-05-16status Pending 977-char remark
Show marketing remark (977 chars)
Step into this spacious 4-bedroom, 3.5-bath home featuring beautiful inlaid hardwood floors and an abundance of original charm. With large rooms, tall ceilings, and a classic layout, this property offers the perfect opportunity for your vision and creativity. Bring your tools and ideas—this home is ready for your special touch. The expansive basement was previously used as an apartment, offering excellent potential for an income-producing space or additional living quarters. Recent updates include a newer hot water heater and furnace/AC, the roof was new in 2016, giving you a head start on improvements. The home is currently livable, with a recent tenant, but would truly shine with thoughtful updates and renovations. With a motivated seller and endless possibilities, this is a prime opportunity for investors or buyers looking to build equity. Don’t miss your chance to unlock the full potential of this unique property—schedule your showing today!
-
2026-03-25$49,900 Active 977-char remark
Show marketing remark (977 chars)
Step into this spacious 4-bedroom, 3.5-bath home featuring beautiful inlaid hardwood floors and an abundance of original charm. With large rooms, tall ceilings, and a classic layout, this property offers the perfect opportunity for your vision and creativity. Bring your tools and ideas—this home is ready for your special touch. The expansive basement was previously used as an apartment, offering excellent potential for an income-producing space or additional living quarters. Recent updates include a newer hot water heater and furnace/AC, the roof was new in 2016, giving you a head start on improvements. The home is currently livable, with a recent tenant, but would truly shine with thoughtful updates and renovations. With a motivated seller and endless possibilities, this is a prime opportunity for investors or buyers looking to build equity. Don’t miss your chance to unlock the full potential of this unique property—schedule your showing today!
-
2004-07-19historical
ⓘ Source: listings_history table (triggers on properties + properties_extension) + one-shot
backfill from property_details.listing_events for pre-trigger history.
Tax reassessment forecast IL · Partial reset (capped growth)
- Current annual tax
- $2,221 · $185/mo
- Projected year-2 tax
- $2,221 · $185/mo
- Expected delta
- $0/yr ($0/mo · 0.0%)
ⓘ Screening estimate from a state-policy table — verify with the county assessor before closing.
Climate risk First Street
- Flood 1/10 Low FEMA zone X (unshaded) · 0% chance over 30 yrs
- Wildfire 1/10 Low
- Heat 4/10 Moderate 7 d/yr ≥105°F today · 19 d/yr by 30 yrs out
- Wind 2/10 Low 100% chance of damaging wind over 30 yrs
- Air quality 2/10 Low 1 unhealthy d/yr today · 1 by 30 yrs out
Nearby sold comps map
Loading sold comps map…
Walkable amenities ~0.75 mi
Loading nearby amenities…
Taxation est. · year 1
- Rental income
- $13,685
- − Mortgage interest
- −$2,795
- − Property taxes
- −$2,221
- − Insurance
- −$250
- − Repairs & maintenance
- −$1,095
- − Management
- −$1,095
- − Depreciation
- −$1,452
- Taxable income
- $4,778
- Est. tax owed @ 24.0%
- −$1,147
- After-tax cash flow
- $4,054/yr
For passive investors: Depreciation is non-cash, so a rental often shows a tax loss while cash-flowing — sheltering income. Rental losses are passive: they offset passive income freely, and up to $25,000/yr can offset ordinary (W-2) income if you actively participate and your MAGI is under $100k (phasing out to $0 by $150k); unused losses carry forward. On sale, claimed depreciation is recaptured at up to 25%, and gains may owe capital-gains tax (a 1031 exchange can defer both). Figures are a year-1 estimate at your 24.0% rate — not tax advice; consult a CPA.
Schools (NCES district)
- District
- Charleston CUSD 1
- NCES district ID
- 1709600
- Math proficiency
- 14% ▼ -6.00%
- Reading proficiency
- 21% ▼ -8.00%
- Median HH income
- $35,724
- Composite
- 14.45/100
- National rank
- #9429
- State rank
- #489 of 620 in IL
Livability — Charleston
- Score
- 73/100
- State rank
- #293
- US rank
- #5627
Category grades
Schools grade is shown separately in the Schools card above.
Census & demographics
- Census place
- Charleston, IL
- County
- Coles County · 41,301 people
- City population
- 20,951
- Metro
- Charleston-Mattoon, IL
- Population (ZIP)
- 20,951
- Household income
- $52,429
- Rent vs Own
- Severe rent burden
- 1209.0
Population outlook (Coles County) Hauer SSP2
- Today (2025)
- 53,967 people
- By 2030
- 53,829 · -0.3%
- By 2040
- 52,332 · -3.0%
- By 2050
- 49,989 · -7.4%
- By 2075
- 42,226 · -21.8%
- By 2100
- 34,675 · -35.7%
Race, ethnicity, and origin ACS 2023
- Neighborhood character
- Predominantly White (84%)
- Race & ethnicity
- White 84% Black 6% Hispanic / Latino 4% Two or more races 3% Asian 2%
- Common ancestry
- Italian 2% Romanian 2% Iranian 2%
- Foreign-born
- 4% · Canada, Jamaica
- Languages at home
- 95% English-only · Spanish 1% Other Indo-European 1%
Political lean MEDSL · Coles
- 2024 margin
- Strong R (+28.5) · D 34.9% · R 63.4% · Other 1.7%
- 2008→2024 swing
- -31.7pp toward R · 2008: 3.2pp · 2024: -28.5pp
- All cycles
- 2024: R+28.5 2020: R+26.4 2016: R+26.4 2012: R+11.1 2008: D+3.2
Not yet ingested
- Civics
- —
Market trends
- HPI YoY
- ▼ -59.97%
- Current HPI
- 153.8607
- Rent YoY
- —
- Metro
- Charleston-Mattoon, IL
- State GDP YoY
- ▲ 1.59%
- F500 in state
- 60
Industry mix (Fortune 500 HQ in IL)
| Industry | F500 HQs | Revenue |
|---|---|---|
| Insurance | 4 | $201B |
|
||
| Consumer Goods | 4 | $87B |
|
||
| Industrial Machinery | 3 | $64B |
|
||
| Healthcare | 2 | $55B |
|
||
| Retail / Pharmacy | 1 | $148B |
|
||
| Agriculture / Food | 1 | $86B |
|
||
Price history
3 events — show timeline
- 2026-05-16 Pending — CIBR
- 2026-03-25 Listed $49,900 CIBR
- 2004-07-19 Listing Removed — MRED as Distributed by MLS Grid
Property tax history
-0.4%/yrLatest (2024): $2,221 · +1.5% YoY. Source: county tax records.
Cash-flow waterfall
monthlySold comps — $/sqft
last 12 mo · ≤1 miLoading sold comps…