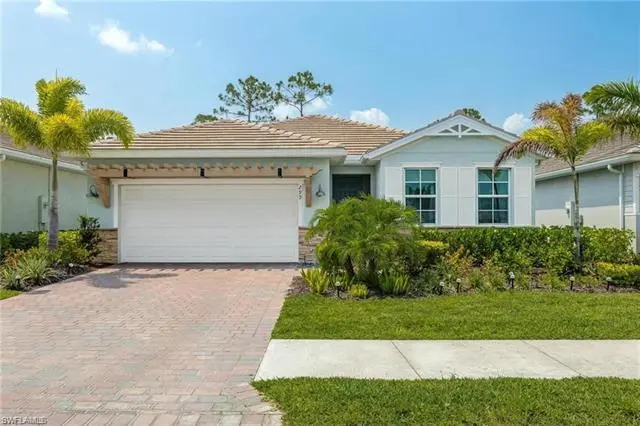
299 Tamarindo Ln · Verona Walk, FL
Flood risk 5/10 · Moderate
- FEMA flood zone
- AH
- Chance of flooding over 30 yrs
- 0.26%
- Est. flood insurance / yr
- $1,142 – $2,507
Fire risk 4/10 · Minor
- Est. fire insurance / yr
- $947 – $1,759
Heat risk 10/10 · Severe
- Hot days now (above 108°F)
- 7 days/yr
- Hot days in 30 yrs
- 29 days/yr
Wind risk 10/10 · Severe
- Chance of severe wind over 30 yrs
- 99.0%
Air-quality risk 2/10 · Minimal
- Unhealthy air days now
- 2 days/yr
- Unhealthy air days in 30 yrs
- 2 days/yr
Risk factors via First Street. Map © Google.
Why this score? — see what drove the B- grade
The composite is a weighted blend of 9 inputs, each scored 0–100. Each bar is that input's sub-score; the figure is the points it added to the 100-point composite (weight × sub-score).
- Cash flow +23.4/30.0
- DSCR +7.5/10.0
- ARV discount +7.5/15.0
- 1% rule +6.3/10.0
- Schools +5.0/10.0
- Condition / age +4.8/5.0
- Appreciation +4.3/10.0
- Rent growth +3.3/5.0
- Livability +3.1/5.0
$599,900
🖨 Deal sheet 📄 Offer letter ✓ Due diligence
Listing remarks MLS
Welcome to your dream home in the community of Tamarindo in South Naples! This stunning, newer-construction home boasts 4 spacious bedrooms and 2 luxurious bathrooms complemented by a two-car garage. Nestled against a serene preserve view, this residence offers peace and privacy. Extensively upgraded with contemporary interior finishes and smart-home capabilities, every detail has been thoughtfully considered. This home is move-in ready, offering a seamless blend of comfort and modern elegance. Don't miss your chance to own this exceptional property in one of Naples' most desirable locations!
Key facts
- Preserve views
- Pickleball courts
- Impact doors
Tags
Property features AI
Finance
- HOA & community: Mandatory HOA; Professional management; Quarterly master HOA fee; Master HOA fee billed quarterly; Master HOA fee: $902 (quarterly); One-time fees include a $750 fee; Total one-time fees: $900; Total annual recurring fees: $3,608; HOA maintenance covers irrigation water, lawn/land maintenance, manager, recreation facilities, and street lights; Community amenities include clubhouse, community pool, community room, exercise room, billiards, bocce court, pickleball, sidewalks, streetlights, and underground utilities
Exterior
- Parking: Attached 2-car garage
- Security: Gated community
- Utilities: Central water; Central sewer; Cable available; Electric service
- Home design: Single-family residence; One-story / ranch; Rear exposure facing west; Located in the TAMARINDO development
- Construction: Built in 2022; Concrete block construction; Stone and stucco exterior finish; Tile roof; Impact resistant windows and doors
- Exterior features: Decorative shutters; Room for pool; Automatic sprinkler system; Lake, preserve and water feature views; Irrigation from lake/canal
Interior
- Kitchen: Range; Self-cleaning oven; Microwave; Dishwasher; Disposal; Refrigerator / freezer; Refrigerator with icemaker; Pantry
- Bedrooms: 4 bedrooms
- Flooring: Carpet; Tile
- Bathrooms: 2 full bathrooms; Master bath with dual sinks and a shower
- Heating & cooling: Central electric heat; Central electric air conditioning; Ceiling fans
- Interior features: Built-in cabinets; Cable prewire / cable available; Foyer; High-speed internet available; Laundry tub; Pantry; Smoke detectors; Walk-in closet; Great room floor plan; Open porch / lanai; Guest room and guest bath; Home automation
- Laundry & utility: Washer; Dryer; Laundry in residence; Auto garage door
Neighborhood map
What this means for you Summary
Snapshot
- This is a 4-bed/2.0-bath single-family listed at $600k. Condition is rated excellent.
Deal economics
- At list price, monthly cash flow is $954 ($11k/yr) — positive.
- The deal already cash-flows at list — no discount required.
- Meets the 1% rule at list price ($7k rent vs $600k).
Location & tenants
- Location reads 62/100 on livability (#746 in FL) — a middle-class / working-renter tenant base. Strengths: crime A+, employment A, housing B+; Watch: health & safety D, schools F, amenities F.
- Collier (suburban): math 60% / reading 56% proficiency, ranked #16 of 73 in FL (top 22%) — acceptable for families but not a draw, mixed tenant base, ~2y average lease.
- Market conditions: Rents rising (+3.2%/yr); 900 active listings in the ZIP; 40 comparable units currently listed for rent nearby; rentals at typical pace (median 24d on market — plan ~3-4 weeks tenant-placement turnaround); solid renter incomes; 3,520 units permitted in Collier County in 2024 (959 in 5+ unit buildings).
- At $6,776/mo this rent would consume 91% of the median local household income ($89k/yr) (locally 550% of renters already pay >50% of income on rent) — very limited rent-growth headroom before tenants either downsize or default.
Forward outlook
- Local home prices are declining (-1.5%/yr); year-one equity from $4k of loan paydown is wiped out by about $9k of value loss. Plan a longer hold.
- Collier County population projected at +30% by 2050 — long-run rental-demand tailwind backs the buy-and-hold thesis.
- At projected returns (-1.5% appreciation + 3.2% rent growth), your $168k cash investment doubles in ~10 years — after that, you're playing with house money.
Negotiation context
- Only 10 days on market — expect competitive offers; lowballing is unlikely to land.
- 5 sale attempts since 2y ago with the ask held roughly flat each time — persistent listings suggest the price (not the market) is what's stuck; bring a comps-based counter.
Risks & watch-outs
- Watch-outs: flood insurance adds $152/mo.
- Climate carrying-cost: in FEMA flood zone AH (mandatory federal flood insurance); severe wind risk, 99% chance of damaging wind over 30y; extreme-heat days projected 7→29/yr by 2055 (HVAC capex compounding) — expect insurance premiums to compound above CPI over the hold.
Questions for the listing agent
- What's the actual annual flood-insurance premium (NFIP or private), and is the property in a SFHA with mandatory coverage?
- What does the HOA fee cover, when was the last increase, and are there any pending special assessments or reserve-fund shortfalls?
- Is there a deadline driving the sale (1031 exchange, divorce, estate, relocation)? That informs how much negotiation room exists.
- Schools are F-rated, which usually means shorter tenancies and higher turnover. Who's the typical renter profile here, and what's been the actual vacancy rate?
- What's the average days-on-market for RENTAL listings here right now (not sales)? A rising rental-DOM trend means longer vacancies and softer asking-rent achievability than the comps imply.
- What's the recent tenant-quality profile in this submarket — average credit score on applications, eviction rate, late-payment / NSF rate, and stable-employment percentage? A property-management company in the area should have these aggregated.
- How much new for-sale + rental construction is in the pipeline within 1–3 miles? Heavy new supply typically softens prices + rents 12–24 months out; constrained supply supports both.
Investment metrics
- 1% rule
- 1.13% ✓
- Cap rate
- 8.51%
- Cash-on-cash
- 7.90%
- DSCR
- 1.35
- GRM
- 7.4
CMA / ARV
No comps found within radius.
Projected returns pro-forma
-1.48% appreciation · 3.21% rent growth · sell at horizon
- IRR
- 0.6%
- Equity multiple
- 1.03×
- Total profit
- $4,389
- Equity at exit
- $131,086
- IRR
- 8.1%
- Equity multiple
- 1.74×
- Total profit
- $124,882
- Equity at exit
- $126,272
Cash invested: $167,972 (down + closing). Projections, not guarantees.
Landlord ↔ Tenant lean methodology
- Overall (STATE)
- 87 Strongly Landlord-Friendly
- State Florida
- 87 Strongly Landlord-Friendly · R+3
- County
- — inherits STATE
- City
- — inherits STATE
ZIP-level market 34114
- Home prices YoY
- -0.6%
- Rents YoY
- 3.2%
- Active inventory
- 900
- Price-to-rent
- 7.4×
Monthly cashflow live
- Estimated rent
- $6,776 high interval (Pro) →
- Mortgage (P&I)
- −$3,146
- Tax from tax record
- −$550 /mo · $6,599/yr
- Insurance
- −$250
- Flood insurance flood zone
- −$152 /mo · $1,824/yr
- HOA
- −$301
- Vacancy / Maint / Mgmt
- −$1,423
- Net cashflow
- $954
Break-even live
UW: 25.0% down · 7.5% · 30yr · 1.5% tax · 5.0% vac · 8.0% maint · 8.0% mgmt
Financing live
Cash to close
- Down payment
- $149,975
- Closing costs
- $17,997
- Reserves months
- —
- Total cash needed
- —
Loan-product check · same deal, 3 products live
Conventional
25% down · 7.5% · 30yr
- Down + closing
- —
- Monthly P&I
- —
- Monthly cashflow
- —
- DSCR
- —
- Eligible?
- —
Personal DTI + credit; lowest rate.
DSCR
20% down · 8.5% · 30yr
- Down + closing
- —
- Monthly P&I
- —
- Monthly cashflow
- —
- DSCR
- —
- Eligible?
- —
No personal income docs; deal must DSCR.
Hard money
10% down · 12.0% · 12mo
- Down + closing
- —
- Monthly P&I
- —
- Monthly cashflow
- —
- DSCR
- —
- Eligible?
- —
Short-term bridge; refi at stabilization.
Rent comps 40 comps
| Address | Beds | Baths | Sqft | Rent | $/sqft | DOM | Units | Dist |
|---|---|---|---|---|---|---|---|---|
| 317 Spiaggio Ct Naples, FL | 3.0 | 2.0 | 2034 | $4,200 | $2.06 | 23d | 1 | 0.10mi |
| 339 Tamarindo Ln Naples, FL | 4.0 | 3.0 | 2221 | $3,699 | $1.67 | 23d | 1 | 0.12mi |
| 379 Grace Bay Ln Naples, FL | 3.0 | 2.0 | 1816 | $8,000 | $4.41 | 21d | 1 | 0.31mi |
| 8191 Lucello Ter S Naples, FL | 3.0 | 3.0 | 2670 | $10,000 | $3.75 | 23d | 1 | 0.46mi |
| 8131 Lucello Ter S Naples, FL | 3.0 | 3.5 | 2275 | $5,400 | $2.37 | 23d | 1 | 0.53mi |
| 8328 Lucello Ter N Naples, FL | 3.0 | 2.0 | 1912 | $9,500 | $4.97 | 23d | 1 | 0.53mi |
| 8047 Sorrento Ln Naples, FL | 3.0 | 3.0 | 1890 | $2,750 | $1.46 | 23d | 1 | 0.60mi |
| 8109 Chianti Ln Naples, FL | 3.0 | 3.0 | 1860 | $5,500 | $2.96 | 23d | 1 | 0.61mi |
| 7681 Sicilia Ct Naples, FL | 5.0 | 3.5 | 2487 | $4,500 | $1.81 | 23d | 1 | 0.65mi |
| 8502 Palacio Ter N Naples, FL | 3.0 | 3.5 | 2291 | $10,000 | $4.36 | 23d | 1 | 0.67mi |
| 8120 Acacia St Naples, FL | 1.0–3.0 | 1.0–2.0 | 1128 | $2,748 | $2.44 | 13d | 33 | 0.71mi |
| 8437 Rosa Ct Naples, FL | 3.0 | 3.5 | 2100 | $3,900 | $1.86 | 21d | 1 | 0.78mi |
| 7278 Salerno Ct Unit 1049689P Naples, FL | 3.0 | 2.0 | 1539 | $6,683 | $4.34 | 13d | 1 | 0.82mi |
| 7294 Salerno Ct Naples, FL | 3.0 | 2.0 | 1542 | $4,250 | $2.76 | 23d | 1 | 0.84mi |
| 7310 Salerno Ct Naples, FL | 3.0 | 2.0 | 1540 | $5,000 | $3.25 | 23d | 1 | 0.85mi |
| 8558 Maggiore Ct Naples, FL | 3.0 | 3.0 | 2275 | $10,000 | $4.40 | 23d | 1 | 0.90mi |
| 8051 Players Cove Dr #102 Naples, FL | 3.0 | 2.5 | 2091 | $8,000 | $3.83 | 23d | 1 | 0.92mi |
| 8051 Players Cove Dr #202 Naples, FL | 3.0 | 3.0 | 2743 | $3,499 | $1.28 | 23d | 1 | 0.92mi |
| 8150 Rattlesnake Hammock Rd Naples, FL | 3.0 | 1.0–2.0 | 1051 | $3,461 | $3.29 | 13d | 115 | 0.95mi |
| 9028 Mayreau Way Naples, FL | 3.0 | 2.0 | 1997 | $2,800 | $1.40 | 13d | 1 | 0.97mi |
| 7812 Valencia Ct Naples, FL | 3.0 | 2.0 | 1924 | $12,000 | $6.24 | 23d | 1 | 0.99mi |
| 8539 Alessandria Ct Naples, FL | 3.0 | 2.0 | 2000 | $3,500 | $1.75 | 21d | 1 | 1.02mi |
| 7831 Valencia Ct Naples, FL | 3.0 | 2.0 | 1936 | $12,000 | $6.20 | 23d | 1 | 1.05mi |
| 7864 Valencia Ct Naples, FL | 3.0 | 2.0 | 2190 | $15,900 | $7.26 | 13d | 1 | 1.11mi |
| 8008 Signature Club Cir Naples, FL | 3.0 | 3.5 | 2600 | $10,000 | $3.85 | 23d | 1 | 1.11mi |
| 7863 Valencia Ct Naples, FL | 3.0 | 2.0 | 2340 | $12,300 | $5.26 | 23d | 1 | 1.12mi |
| 8552 Collier Blvd Naples, FL | 1.0–3.0 | 1.0–2.0 | 1248 | $5,470 | $4.38 | 13d | 34 | 1.13mi |
| 8949 Malibu St #304 Naples, FL | 3.0 | 2.0 | 1771 | $6,500 | $3.67 | 23d | 1 | 1.13mi |
| 7778 Ashton Rd Naples, FL | 3.0 | 2.0 | 1975 | $13,000 | $6.58 | 23d | 1 | 1.16mi |
| 7785 Ashton Rd Naples, FL | 3.0 | 3.0 | 1878 | $13,000 | $6.92 | 23d | 1 | 1.16mi |
| 3017 Juniper Way Naples, FL | 3.0 | 2.5 | 2260 | $3,300 | $1.46 | 23d | 1 | 1.19mi |
| 8664 Genova Ct Naples, FL | 3.0 | 2.0 | 1554 | $3,200 | $2.06 | 23d | 1 | 1.22mi |
| 7636 Sussex Ct Naples, FL | 4.0 | 3.0 | 2293 | $6,500 | $2.83 | 23d | 1 | 1.23mi |
| 7672 Sussex Ct Naples, FL | 4.0 | 2.0 | 2293 | $12,500 | $5.45 | 21d | 1 | 1.23mi |
| 8992 Cambria Cir Unit 1546062P Naples, FL | 3.0 | 2.0 | 2002 | $3,097 | $1.55 | 13d | 1 | 1.24mi |
| 7895 Mahogany Run Ln Naples, FL | 2.0–3.0 | 2.0 | 1339 | $10,395 | $7.76 | 13d | 3 | 1.24mi |
| 7771 Cottesmore Dr Naples, FL | 3.0 | 2.5 | 2481 | $14,000 | $5.64 | 23d | 1 | 1.25mi |
| 8125 Celeste Dr #5113 Naples, FL | 3.0 | 2.0 | 1635 | $7,000 | $4.28 | 23d | 1 | 1.27mi |
| 8125 Celeste Dr #5216 Naples, FL | 3.0 | 2.0 | 1640 | $4,500 | $2.74 | 23d | 1 | 1.27mi |
| 8989 Cambria Cir #1807 Naples, FL | 3.0 | 2.5 | 2008 | $7,000 | $3.49 | 13d | 1 | 1.27mi |
HOA detail
- Monthly dues
- $301 · $3,612/yr
Listing history 8 events
-
2026-06-18days on market $599,900 Active 10 DOM
-
2026-06-17days on market $599,900 Active 9 DOM
-
2026-06-16days on market $599,900 Active 8 DOM
-
2026-06-15days on market $599,900 Active 7 DOM
-
2026-06-14days on market $599,900 Active 5 DOM
-
2026-06-10days on market $599,900 Active 2 DOM
-
2026-06-09remarks 699-char remark
-
2026-06-09$599,900 Active 1 DOM
ⓘ Source: listings_history table (triggers on properties + properties_extension) + one-shot
backfill from property_details.listing_events for pre-trigger history.
Tax reassessment forecast FL · Resets to sale price
- Current annual tax
- $6,599 · $550/mo
- Projected year-2 tax
- $6,599 · $550/mo
- Expected delta
- $0/yr ($0/mo · -0.0%)
ⓘ Screening estimate from a state-policy table — verify with the county assessor before closing.
Climate risk First Street
- Flood 5/10 Major FEMA zone AH · 26% chance over 30 yrs
- Wildfire 4/10 Moderate
- Heat 10/10 Extreme 7 d/yr ≥108°F today · 29 d/yr by 30 yrs out
- Wind 10/10 Extreme 99% chance of damaging wind over 30 yrs
- Air quality 2/10 Low 2 unhealthy d/yr today · 2 by 30 yrs out
Nearby sold comps map
Loading sold comps map…
Walkable amenities ~0.75 mi
Loading nearby amenities…
Taxation est. · year 1
- Rental income
- $81,310
- − Mortgage interest
- −$33,604
- − Property taxes
- −$6,599
- − Insurance
- −$4,824
- − Repairs & maintenance
- −$6,505
- − Management
- −$6,505
- − HOA
- −$3,612
- − Depreciation
- −$17,452
- Taxable income
- $2,210
- Est. tax owed @ 24.0%
- −$530
- After-tax cash flow
- $10,918/yr
For passive investors: Depreciation is non-cash, so a rental often shows a tax loss while cash-flowing — sheltering income. Rental losses are passive: they offset passive income freely, and up to $25,000/yr can offset ordinary (W-2) income if you actively participate and your MAGI is under $100k (phasing out to $0 by $150k); unused losses carry forward. On sale, claimed depreciation is recaptured at up to 25%, and gains may owe capital-gains tax (a 1031 exchange can defer both). Figures are a year-1 estimate at your 24.0% rate — not tax advice; consult a CPA.
Condition & rehab AI · 12 photos
This move-in-ready home in Tamarindo, South Naples, offers a modern and comfortable living space with contemporary finishes and smart-home features.
Value-add opportunities
- Resale Paint exterior trim and shutters — Enhances curb appeal and can increase property value
- Resale Replace outdoor lighting fixtures — Modernizes the exterior and improves safety
- Both Install smart home security system — Enhances safety and convenience for both buyers and renters
Renovation cost estimate screening
Value-add ROI direction
- Resale Paint exterior trim and shutters — Enhances curb appeal and can increase property value ↑
- Resale Replace outdoor lighting fixtures — Modernizes the exterior and improves safety ↑
- Both Install smart home security system — Enhances safety and convenience for both buyers and renters ↑
ⓘ Cost ranges are severity-bucket heuristics (US national rule-of-thumb). Get contractor quotes + a written scope before underwriting a rehab budget.
Schools (NCES district)
- District
- Collier
- NCES district ID
- 1200330
- Math proficiency
- 60% ▼ -4.00%
- Reading proficiency
- 56% ▼ -2.00%
- Median HH income
- $58,275
- Composite
- 50.23/100
- National rank
- #1892
- State rank
- #16 of 73 in FL
Livability — Verona Walk
- Score
- 62/100
- State rank
- #746
- US rank
- #16132
Category grades
Schools grade is shown separately in the Schools card above.
Census & demographics
- County
- Collier County · 396,295 people
- Metro
- Naples-Marco Island, FL
- Population (ZIP)
- 23,559
- Household income
- $89,334
- Rent vs Own
- Severe rent burden
- 550.0
Population outlook (Collier County) Hauer SSP2
- Today (2025)
- 420,858 people
- By 2030
- 450,054 · +6.9%
- By 2040
- 502,232 · +19.3%
- By 2050
- 544,932 · +29.5%
- By 2075
- 627,203 · +49.0%
- By 2100
- 659,015 · +56.6%
Race, ethnicity, and origin ACS 2023
- Neighborhood character
- Predominantly White (72%)
- Race & ethnicity
- White 72% Hispanic / Latino 17% Two or more races 13% Black 7%
- Hispanic origin (detail)
- Mexican 7% Puerto Rican 1% Cuban 3%
- Common ancestry
- Hispanic 5% Romanian 4% Lithuanian 1%
- Foreign-born
- 21% · Canada, Jamaica
- Languages at home
- 75% English-only · Spanish 15% French/Haitian/Cajun 5% Other Indo-European 4%
Political lean MEDSL · Collier
- 2024 margin
- Solid R (+33.1) · D 33.1% · R 66.2%
- 2008→2024 swing
- -10.6pp toward R · 2008: -22.5pp · 2024: -33.1pp
- All cycles
- 2024: R+33.1 2020: R+24.7 2016: R+26.0 2012: R+30.1 2008: R+22.5
Not yet ingested
- Civics
- —
Market trends
- HPI YoY
- ▼ -1.48%
- Current HPI
- 266.5545
- Rent YoY
- ▲ 3.21%
- Metro
- Naples-Marco Island, FL
- State GDP YoY
- ▲ 3.28%
- F500 in state
- 36
Industry mix (Fortune 500 HQ in FL)
| Industry | F500 HQs | Revenue |
|---|---|---|
| Industrial Technology | 2 | $29B |
|
||
| Insurance | 2 | $17B |
|
||
| Retail | 1 | $60B |
|
||
| Technology Distribution | 1 | $58B |
|
||
| Homebuilding | 1 | $35B |
|
||
| Technology Manufacturing | 1 | $35B |
|
||
Price history
-17.7% since first listed15 events — show timeline
- 2026-06-08 Listed $599,900 NAPLESMLS
- 2025-07-17 Rental Removed $3,200 NAPLESMLS
- 2025-06-19 Listed for Rent $3,200 NAPLESMLS
- 2025-05-29 Listing Removed — NAPLESMLS
- 2025-03-14 Price Changed $629,000 NAPLESMLS
- 2025-03-04 Listed $659,000 NAPLESMLS
- 2024-12-28 Rental Removed $5,500 TURBOTENANT
- 2024-11-27 Listed for Rent $5,500 TURBOTENANT
- 2024-09-04 Sold (Public Records) $650,000 Public Records
- 2024-08-30 Listing Removed — NAPLESMLS
- 2024-08-30 Sold (MLS) $650,000 NAPLESMLS
- 2024-08-05 Pending — NAPLESMLS
- 2024-06-28 Price Changed $679,000 NAPLESMLS
- 2024-05-26 Price Changed $699,999 NAPLESMLS
- 2024-05-14 Listed $729,000 NAPLESMLS
Property tax history
+55.5%/yrLatest (2025): $6,599 · +6.0% YoY. Source: county tax records.
Cash-flow waterfall
monthlySold comps — $/sqft
last 12 mo · ≤1 miLoading sold comps…