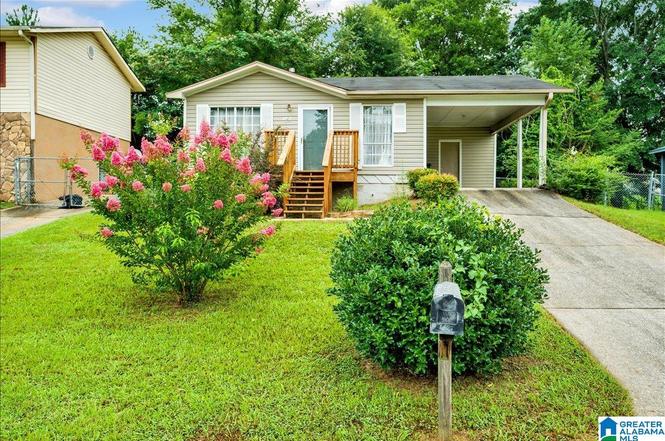
1827 Huntington Dr · Birmingham, AL
Flood risk 1/10 · Minimal
- FEMA flood zone
- X (unshaded)
- Chance of flooding over 30 yrs
- 0.0%
- Est. flood insurance / yr
- $507 – $1,088
Fire risk 3/10 · Minor
- Est. fire insurance / yr
- $916 – $1,700
Heat risk 6/10 · Moderate
- Hot days now (above 106°F)
- 7 days/yr
- Hot days in 30 yrs
- 19 days/yr
Wind risk 6/10 · Moderate
- Chance of severe wind over 30 yrs
- 27.0%
Air-quality risk 4/10 · Minor
- Unhealthy air days now
- 5 days/yr
- Unhealthy air days in 30 yrs
- 5 days/yr
Risk factors via First Street. Map © Google.
Why this score? — see what drove the B grade
The composite is a weighted blend of 9 inputs, each scored 0–100. Each bar is that input's sub-score; the figure is the points it added to the 100-point composite (weight × sub-score).
- Cash flow +30.0/30.0
- ARV discount +15.0/15.0
- DSCR +10.0/10.0
- 1% rule +8.8/10.0
- Livability +3.4/5.0
- Rent growth +2.7/5.0
- Condition / age +2.5/5.0
- Schools +0.9/10.0
- Appreciation +0.0/10.0
$89,000
🖨 Deal sheet (PDF) 📄 Offer letter ✓ Due diligence
Listing remarks
Priced to Sell! This home offers incredible potential for a first-time homebuyer or savvy investor. With a little TLC and your personal touch, this property can be transformed into the perfect place to call home or a great addition to your investment portfolio. Don’t miss this opportunity to own a home at an affordable price. Schedule your showing today!
Key facts
- 7,405 sq ft lot
- Parking
- Built 1982
Property features AI
Finance
- Other: Lot size approximately 0.17 acres; Subdivision: Huntington
Exterior
- Parking: Driveway parking; One carport space
- Utilities: Public water; Connected sewer; Water heater: gas and electric options; Internet availability unknown
- Home design: Existing construction; Vinyl siding
- Construction: Crawl space foundation
- Exterior features: No pool; No patio; No deck; No garden/patio; Not waterfront
Interior
- Kitchen: Solid surface countertops; Electric stove
- Bedrooms: Three bedrooms on the main level
- Flooring: Carpet; Hardwood
- Bathrooms: Two full bathrooms; Bathtub/shower combo
- Heating & cooling: Central heating (electric); Central air conditioning
- Interior features: Smooth ceilings; No additional interior features listed
- Laundry & utility: Washer hookup; Electric dryer hookup; Laundry located on the main level in the garage area
Neighborhood map
What this means for you Summary
Snapshot
- This is a 3-bed/1.0-bath single-family listed at $89k.
Deal economics
- At list price, monthly cash flow is $359 ($4k/yr) — positive.
- The deal already cash-flows at list — no discount required.
- Meets the 1% rule at list price ($1k rent vs $89k).
- Cap rate 11.1% vs local median 6.2% in Birmingham — top-decile yield for the area; either an underpriced asset or a hidden risk that comps aren't pricing in. Stress-test before assuming the spread holds.
Location & tenants
- Location reads 67/100 on livability (#78 in AL) — a middle-class / working-renter tenant base. Strengths: commute A+, cost of living A+, housing A+; Watch: amenities C-, crime F, employment F.
- Birmingham City (urban): math 4% / reading 20% proficiency, ranked #116 of 129 in AL (top 90%) — low school quality limits family demand, transient renter base, plan for 1-2y turnover; 82% free/reduced lunch — lower-income household profile, screen leases tightly.
- Zoned schools: Minor Elementary School (math 0% / reading 14%, grade F, #601 of 627 statewide, top 98%, 454 students, 90% FRL).
- Market conditions: Rents flat; 116 active listings in the ZIP; 15 comparable units currently listed for rent nearby; rentals at typical pace (median 25d on market — plan ~3-4 weeks tenant-placement turnaround); 40% of comp listings sitting > 30 days — soft ceiling on asking rent; 2,114 units permitted in Jefferson County in 2024 (556 in 5+ unit buildings).
Forward outlook
- Local home prices are declining (-3.0%/yr); year-one equity from $615 of loan paydown is wiped out by about $3k of value loss. Plan a longer hold.
- Jefferson County population projected to shrink 4% by 2050 — rents likely to lag national; underwrite the cash flow, not the appreciation.
- At projected returns (-3.0% appreciation + 0.7% rent growth), your $25k cash investment doubles in ~9 years — after that, you're playing with house money.
Negotiation context
- Only 1 days on market — expect competitive offers; lowballing is unlikely to land.
Risks & watch-outs
- Climate carrying-cost: major wind risk, 27% chance of damaging wind over 30y; extreme-heat days projected 7→19/yr by 2055 (HVAC capex compounding) — expect insurance premiums to compound above CPI over the hold.
Questions for the listing agent
- Is there a deadline driving the sale (1031 exchange, divorce, estate, relocation)? That informs how much negotiation room exists.
- Schools are F-rated, which usually means shorter tenancies and higher turnover. Who's the typical renter profile here, and what's been the actual vacancy rate?
- Crime grade is F in this area — have there been break-ins, vandalism, or insurance claims at this property in the last 3 years? What carrier currently insures it and at what premium?
- What's the average days-on-market for RENTAL listings here right now (not sales)? A rising rental-DOM trend means longer vacancies and softer asking-rent achievability than the comps imply.
- What's the recent tenant-quality profile in this submarket — average credit score on applications, eviction rate, late-payment / NSF rate, and stable-employment percentage? A property-management company in the area should have these aggregated.
- How much new for-sale + rental construction is in the pipeline within 1–3 miles? Heavy new supply typically softens prices + rents 12–24 months out; constrained supply supports both.
Investment metrics
- 1% rule
- 1.38% ✓
- Cap rate
- 11.13%
- Cash-on-cash
- 17.29%
- DSCR
- 1.77
- GRM
- 6.0
CMA / ARV
- ARV (on-the-fly)
- $108,864
- Comps found
- 4
Show comp detail 4 sales within ~0.75 mi
| Address | Dist | Beds/Ba | Sqft | Sold | Price | $/sf | Match |
|---|---|---|---|---|---|---|---|
| 714 Spring St | 0.18mi | 3/2.0 | 1,082 (+7%) | 16mo | $120,000 | $111 | 62 |
| 1815 Huntington Dr | 0.07mi | 3/2.0 | 1,158 (+15%) | 14mo | $103,000 | $89 | 57 |
| 605 Forestdale Blvd | 0.54mi | 3/1.0 | 1,060 (+5%) | 15mo | $115,000 | $108 | 54 |
| 1425 Hibernian St | 0.63mi | 3/1.0 | 1,152 (+14%) | 6mo | $38,000 | $33 | 41 |
Match score weights: distance 35% · size 25% · config 20% · recency 20%. Top-matched comps best support the ARV.
Projected returns pro-forma
-3.0% appreciation · 0.74% rent growth · sell at horizon
- IRR
- 6.1%
- Equity multiple
- 1.23×
- Total profit
- $5,730
- Equity at exit
- $13,270
- IRR
- 13.3%
- Equity multiple
- 1.96×
- Total profit
- $23,800
- Equity at exit
- $7,695
Cash invested: $24,920 (down + closing). Projections, not guarantees.
Landlord ↔ Tenant lean methodology
- Overall (STATE)
- 90 Strongly Landlord-Friendly
- State Alabama
- 90 Strongly Landlord-Friendly · R+15
- County
- — inherits STATE
- City
- — inherits STATE
ZIP-level market 35214
- Home prices YoY
- -20.0%
- Rents YoY
- 0.7%
- Active inventory
- 116
- Price-to-rent
- 6.0×
Monthly cashflow live
- Estimated rent
- $1,226 high interval (Pro) →
- Mortgage (P&I)
- −$467
- Tax from tax record
- −$106 /mo · $1,269/yr
- Insurance
- −$37
- HOA
- −$0
- Vacancy / Maint / Mgmt
- −$257
- Net cashflow
- $359
Break-even live
Sensitivity live
| Price | -10% $409 | -5% $384 | +0% $359 | +5% $334 | +10% $309 |
|---|---|---|---|---|---|
| Rent | -10% $262 | -5% $311 | +0% $359 | +5% $407 | +10% $456 |
| Rate | -1.0pp $404 | -0.5pp $382 | base $359 | +0.5pp $336 | +1.0pp $312 |
UW: 25.0% down · 7.5% · 30yr · 1.5% tax · 5.0% vac · 8.0% maint · 8.0% mgmt
Financing live
Cash to close
- Down payment
- $22,250
- Closing costs
- $2,670
- Reserves months
- —
- Total cash needed
- —
Loan-product check · same deal, 3 products live
Conventional
25% down · 7.5% · 30yr
- Down + closing
- —
- Monthly P&I
- —
- Monthly cashflow
- —
- DSCR
- —
- Eligible?
- —
Personal DTI + credit; lowest rate.
DSCR
20% down · 8.5% · 30yr
- Down + closing
- —
- Monthly P&I
- —
- Monthly cashflow
- —
- DSCR
- —
- Eligible?
- —
No personal income docs; deal must DSCR.
Hard money
10% down · 12.0% · 12mo
- Down + closing
- —
- Monthly P&I
- —
- Monthly cashflow
- —
- DSCR
- —
- Eligible?
- —
Short-term bridge; refi at stabilization.
Rent comps 15 comps
| Address | Beds | Baths | Sqft | Rent | $/sqft | DOM | Units | Dist |
|---|---|---|---|---|---|---|---|---|
| 1739 Huntington Dr Birmingham, AL | 3.0 | 2.0 | 1008 | $1,150 | $1.14 | 4d | 1 | 0.21mi |
| 609 Cherry Ave Birmingham, AL | 3.0 | 1.5 | 1104 | $1,495 | $1.35 | 24d | 1 | 0.47mi |
| 1425 Hibernian St Birmingham, AL | 3.0 | 1.0 | 1152 | $1,200 | $1.04 | 24d | 1 | 0.65mi |
| 408 Miles Ave Birmingham, AL | 3.0 | 2.0 | 1377 | $1,050 | $0.76 | 22d | 1 | 0.70mi |
| 213 Beech Ave Birmingham, AL | 3.0 | 1.0 | 1288 | $1,000 | $0.78 | 20d | 1 | 0.75mi |
| 1411 Magnolia Dr Unit 1411 Birmingham, AL | 2.0 | 1.0 | 867 | $950 | $1.10 | 44d | 1 | 0.91mi |
| 128 Thomas Cir Birmingham, AL | 3.0 | 1.0 | 777 | $2,550 | $3.28 | 44d | 1 | 1.02mi |
| 1174 16th Avenue Thomas Birmingham, AL | 2.0 | 1.0 | 1000 | $750 | $0.75 | 44d | 1 | 1.12mi |
| 424 34th Ave W Birmingham, AL | 3.0 | 2.0 | 969 | $1,050 | $1.08 | 24d | 1 | 1.22mi |
| 537 37th Ter W Birmingham, AL | 3.0 | 1.0 | 1060 | $1,000 | $0.94 | 44d | 1 | 1.23mi |
| 3417 4th St W Birmingham, AL | 3.0 | 2.0 | 1275 | $1,000 | $0.78 | 44d | 1 | 1.31mi |
| 315 Avenue U Birmingham, AL | 3.0 | 1.0 | 1088 | $1,200 | $1.10 | 4d | 1 | 1.35mi |
| 120 Dewberry Ln Birmingham, AL | 3.0 | 2.0 | 1485 | $1,510 | $1.02 | 20d | 1 | 1.44mi |
| 1500 Cherry Ave Birmingham, AL | 3.0 | 1.0 | 1144 | $1,225 | $1.07 | 4d | 1 | 1.48mi |
| 3732 4th St W Birmingham, AL | 4.0 | 1.0 | 1185 | $900 | $0.76 | 44d | 1 | 1.49mi |
Listing history 2 events
-
2026-06-17remarks 356-char remark
-
2026-06-17$89,000 Active 1 DOM
ⓘ Source: listings_history table (triggers on properties + properties_extension) + one-shot
backfill from property_details.listing_events for pre-trigger history.
Tax reassessment forecast AL · Resets to sale price
- Current annual tax
- $1,269 · $106/mo
- Projected year-2 tax
- $1,269 · $106/mo
- Expected delta
- $0/yr ($0/mo · 0.0%)
ⓘ Screening estimate from a state-policy table — verify with the county assessor before closing.
Climate risk First Street
- Flood 1/10 Low FEMA zone X (unshaded) · 0% chance over 30 yrs
- Wildfire 3/10 Moderate
- Heat 6/10 Major 7 d/yr ≥106°F today · 19 d/yr by 30 yrs out
- Wind 6/10 Major 27% chance of damaging wind over 30 yrs
- Air quality 4/10 Moderate 5 unhealthy d/yr today · 5 by 30 yrs out
Nearby sold comps map
Loading sold comps map…
Walkable amenities ~0.75 mi
Loading nearby amenities…
Taxation est. · year 1
- Rental income
- $14,712
- − Mortgage interest
- −$4,985
- − Property taxes
- −$1,269
- − Insurance
- −$445
- − Repairs & maintenance
- −$1,177
- − Management
- −$1,177
- − Depreciation
- −$2,589
- Taxable income
- $3,070
- Est. tax owed @ 24.0%
- −$737
- After-tax cash flow
- $3,571/yr
For passive investors: Depreciation is non-cash, so a rental often shows a tax loss while cash-flowing — sheltering income. Rental losses are passive: they offset passive income freely, and up to $25,000/yr can offset ordinary (W-2) income if you actively participate and your MAGI is under $100k (phasing out to $0 by $150k); unused losses carry forward. On sale, claimed depreciation is recaptured at up to 25%, and gains may owe capital-gains tax (a 1031 exchange can defer both). Figures are a year-1 estimate at your 24.0% rate — not tax advice; consult a CPA.
Schools (NCES district)
- District
- Birmingham City
- NCES district ID
- 0100390
- Math proficiency
- 4% ▼ -17.00%
- Reading proficiency
- 20% ▼ -4.00%
- Median HH income
- $31,988
- Composite
- 9.49/100
- National rank
- #9850
- State rank
- #116 of 129 in AL
Livability — Birmingham
- Score
- 67/100
- State rank
- #78
- US rank
- #10412
Category grades
Schools grade is shown separately in the Schools card above.
Census & demographics
- Census place
- Birmingham, AL
- County
- Jefferson County · 527,445 people
- City population
- 210,422
- Metro
- Birmingham-Hoover, AL
- Population (ZIP)
- 17,027
- Household income
- $56,383
- Rent vs Own
- Severe rent burden
- 578.0
Population outlook (Jefferson County) Hauer SSP2
- Today (2025)
- 669,185 people
- By 2030
- 669,694 · +0.1%
- By 2040
- 661,388 · -1.2%
- By 2050
- 643,086 · -3.9%
- By 2075
- 577,267 · -13.7%
- By 2100
- 474,758 · -29.1%
Race, ethnicity, and origin ACS 2023
- Neighborhood character
- Predominantly Black (77%)
- Race & ethnicity
- Black 77% White 18% Two or more races 2%
- Foreign-born
- 1% · Canada
- Languages at home
- 98% English-only · Spanish 2%
Political lean MEDSL · Jefferson
- 2024 margin
- D (+10.4) · D 54.6% · R 44.2% · Other 1.2%
- 2008→2024 swing
- +5.4pp toward D · 2008: 5.1pp · 2024: 10.4pp
- All cycles
- 2024: D+10.4 2020: D+13.2 2016: D+7.2 2012: D+6.0 2008: D+5.1
Not yet ingested
- Civics
- —
Market trends
- HPI YoY
- ▼ -54.48%
- Current HPI
- 218.5233
- Rent YoY
- ▲ 0.74%
- Metro
- Birmingham-Hoover, AL
- State GDP YoY
- ▲ 2.94%
- F500 in state
- 4
Industry mix (Fortune 500 HQ in AL)
| Industry | F500 HQs | Revenue |
|---|---|---|
| Financial Services | 1 | $8B |
|
||
| Healthcare | 1 | $5B |
|
||
Price history
1 event — show timeline
- 2026-06-17 Listed $89,000 Greater Alabama MLS
Property tax history
+8.9%/yrLatest (2025): $1,269 · +7.0% YoY. Source: county tax records.
Cash-flow waterfall
monthlySold comps — $/sqft
last 12 mo · ≤1 miLoading sold comps…