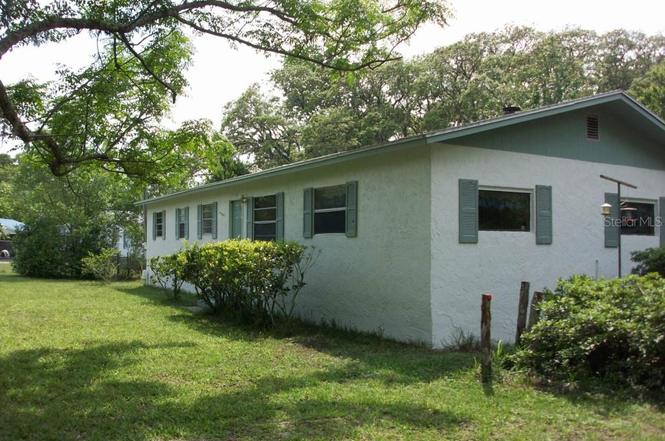
13103 Grassy Ln · Meadow Oaks, FL
Flood risk 1/10 · Minimal
- FEMA flood zone
- X (unshaded)
- Chance of flooding over 30 yrs
- 0.0%
- Est. flood insurance / yr
- $507 – $1,088
Fire risk 4/10 · Minor
- Est. fire insurance / yr
- $947 – $1,759
Heat risk 10/10 · Severe
- Hot days now (above 108°F)
- 7 days/yr
- Hot days in 30 yrs
- 26 days/yr
Wind risk 10/10 · Severe
- Chance of severe wind over 30 yrs
- 99.0%
Air-quality risk 2/10 · Minimal
- Unhealthy air days now
- 1 days/yr
- Unhealthy air days in 30 yrs
- 3 days/yr
Risk factors via First Street. Map © Google.
Why this score? — see what drove the D- grade
The composite is a weighted blend of 9 inputs, each scored 0–100. Each bar is that input's sub-score; the figure is the points it added to the 100-point composite (weight × sub-score).
- Cash flow +12.8/30.0
- ARV discount +7.5/15.0
- Schools +4.3/10.0
- DSCR +3.8/10.0
- 1% rule +3.1/10.0
- Livability +3.1/5.0
- Rent growth +2.5/5.0
- Condition / age +2.5/5.0
- Appreciation +0.0/10.0
$199,000
🖨 Deal sheet (PDF) 📄 Offer letter ✓ Due diligence
Listing remarks
* * * INVESTOR OPPORTUNITY OR TOY LOVER'S HAVEN – NEARLY 1 ACRE IN FAST-GROWING HUDSON! * * * Don’t miss this rare 0.95-acre opportunity in Hudson’s sought-after Colony Village. Whether you’re an investor searching for solid returns or a buyer who wants extra space for an RV, boat, or workshop, this property checks all the boxes. A spacious 1,568 sq. ft. Home * is already on site, offering immediate use and value. For investors, it’s a ready fix-and-flip or rental opportunity. For lifestyle buyers, it’s a chance to enjoy wide-open space with no HOA restrictions—perfect for parking your toys, adding a detached garage, or even building that d
Key facts
- Custom workshop
- Extra garages
- No hoa restrictions
Tags
Property features AI
Finance
- HOA & community: No homeowner association
Exterior
- Utilities: Well water; Septic tank; Electricity connected; Broadband/high-speed internet available; Private utilities
- Home design: Single-wide mobile home; Residential property; Fixer condition; One story; Faces east; Entry level: One
- Construction: Stucco and frame construction; Shingle roof; Crawlspace foundation; Built as single-level
- Exterior features: Covered rear porch; Front porch; Private mailbox; Chain link fencing; Shed(s); Mature landscaping with oak trees; Oversized, paved lot in an unincorporated area; Publicly maintained asphalt road access
Interior
- Kitchen: No appliances included
- Bedrooms: 3 bedrooms
- Bathrooms: 2 full bathrooms
- Heating & cooling: Central heating (electric); Central air conditioning
- Interior features: Cathedral ceilings; Ceiling fans; Open floor plan; Decorative stone fireplace in the living room; Inside utility room
- Laundry & utility: Laundry room inside the home
Neighborhood map
What this means for you Summary
Snapshot
- This is a 2-bed/2.0-bath manufactured listed at $199k.
Deal economics
- At list price, monthly cash flow is $-17 ($-207/yr) — negative.
- To cash-flow at today's rent, offer at most $196k (1.5% below list).
- To meet the 1% rule (rent ≥ 1% of price), the offer needs to be $161k (19.3% below list).
- Recommended offer: $161k (19.3% below list) — sets the bar for 1% rule.
- Cap rate 6.2% vs local median 4.6% in Meadow Oaks — top-decile yield for the area; either an underpriced asset or a hidden risk that comps aren't pricing in. Stress-test before assuming the spread holds.
Location & tenants
- Location reads 61/100 on livability (#794 in FL) — a middle-class / working-renter tenant base. Strengths: crime A+, cost of living A+, housing A+; Watch: amenities F, commute F, employment F.
- Pasco (suburban): math 50% / reading 52% proficiency, ranked #32 of 73 in FL (top 44%) — acceptable for families but not a draw, mixed tenant base, ~2y average lease.
- Zoned schools: Moon Lake Elementary School (math 30% / reading 35%, grade F, #1,787 of 2,144 statewide, top 84%, 579 students, 70% FRL); Hudson Academy (math 35% / reading 30%, grade F, #443 of 571 statewide, top 78%, 964 students, 80% FRL); Fivay High School (math 20% / reading 28%, grade F, #529 of 667 statewide, top 80%, 1,610 students, 78% FRL) — zoned schools average 76% FRL vs 48% district-wide (27 pts higher); higher-poverty schools than district average — tighter screening recommended.
- Zoned-school proficiency averages 30% at this address vs 51% district-wide (-21 pts) — the specific schools serving this property underperform the Pasco average; the district grade overstates school quality for this exact location.
- Market conditions: 303 active listings in the ZIP; 1 comparable units currently listed for rent nearby; 6,765 units permitted in Pasco County in 2024 (1,250 in 5+ unit buildings).
- This rent runs 33% of the median local income ($59k/yr) — at the standard rent-burdened threshold; future hikes will face affordability resistance.
Forward outlook
- Local home prices are declining (-3.0%/yr); year-one equity from $1k of loan paydown is wiped out by about $6k of value loss. Plan a longer hold.
- Pasco County population projected at +29% by 2050 — long-run rental-demand tailwind backs the buy-and-hold thesis.
Negotiation context
- It's been on market 262 days — a 12% lower offer ($175k) is reasonable based on typical stale-listing flexibility.
- 14 sale attempts since 12y ago; this cycle's ask has dropped $51k (20%) from the opening price — seller is motivated, your offer sets the floor, not the list.
- Current owner paid $160k; 24% above their basis — modest negotiation headroom, anchor on the comps not their cost.
Risks & watch-outs
- Climate carrying-cost: severe wind risk, 99% chance of damaging wind over 30y; extreme-heat days projected 7→26/yr by 2055 (HVAC capex compounding) — expect insurance premiums to compound above CPI over the hold.
Questions for the listing agent
- What do current leases actually rent for vs. the listed asking? Can we see a recent rent roll and the last 12 months of T-12 income?
- It's been on market 262 days. Have you received any prior offers? Is the seller open to a 19% concession, seller financing, or rate buy-down credit?
- Built in 1972 — when were the roof, HVAC, electrical panel, plumbing, and water heater last replaced?
- Why hasn't it sold? Are there any deal-killer items the seller is aware of (foundation, flood, title, zoning, code violations)?
- Is there a deadline driving the sale (1031 exchange, divorce, estate, relocation)? That informs how much negotiation room exists.
- Schools are D-rated, which usually means shorter tenancies and higher turnover. Who's the typical renter profile here, and what's been the actual vacancy rate?
- The area grade is low — what's the realistic commute time and amenity access for the typical tenant pool here? Any planned neighborhood developments (good or bad) we should know about?
- What's the average days-on-market for RENTAL listings here right now (not sales)? A rising rental-DOM trend means longer vacancies and softer asking-rent achievability than the comps imply.
- What's the recent tenant-quality profile in this submarket — average credit score on applications, eviction rate, late-payment / NSF rate, and stable-employment percentage? A property-management company in the area should have these aggregated.
- How much new for-sale + rental construction is in the pipeline within 1–3 miles? Heavy new supply typically softens prices + rents 12–24 months out; constrained supply supports both.
Investment metrics
- 1% rule
- 0.81% ✗
- Cap rate
- 6.19%
- Cash-on-cash
- -0.37%
- DSCR
- 0.98
- GRM
- 10.3
CMA / ARV
No comps found within radius.
Projected returns pro-forma
-3.0% appreciation · 3.0% rent growth · sell at horizon
- IRR
- -16.9%
- Equity multiple
- 0.40×
- Total profit
- $-33,378
- Equity at exit
- $29,672
- IRR
- -8.9%
- Equity multiple
- 0.45×
- Total profit
- $-30,606
- Equity at exit
- $17,206
Cash invested: $55,720 (down + closing). Projections, not guarantees.
Landlord ↔ Tenant lean methodology
- Overall (STATE)
- 87 Strongly Landlord-Friendly
- State Florida
- 87 Strongly Landlord-Friendly · R+3
- County
- — inherits STATE
- City
- — inherits STATE
ZIP-level market 34669
- Home prices YoY
- -24.1%
- Active inventory
- 303
- Price-to-rent
- 10.3×
Monthly cashflow live
- Estimated rent
- $1,607 medium interval (Pro) →
- Mortgage (P&I)
- −$1,044
- Tax from tax record
- −$160 /mo · $1,921/yr
- Insurance
- −$83
- HOA
- −$0
- Vacancy / Maint / Mgmt
- −$337
- Net cashflow
- $-17
Break-even live
Sensitivity live
| Price | -10% $95 | -5% $39 | +0% $-17 | +5% $-74 | +10% $-130 |
|---|---|---|---|---|---|
| Rent | -10% $-144 | -5% $-81 | +0% $-17 | +5% $46 | +10% $110 |
| Rate | -1.0pp $83 | -0.5pp $33 | base $-17 | +0.5pp $-69 | +1.0pp $-121 |
UW: 25.0% down · 7.5% · 30yr · 1.5% tax · 5.0% vac · 8.0% maint · 8.0% mgmt
Financing live
Cash to close
- Down payment
- $49,750
- Closing costs
- $5,970
- Reserves months
- —
- Total cash needed
- —
Loan-product check · same deal, 3 products live
Conventional
25% down · 7.5% · 30yr
- Down + closing
- —
- Monthly P&I
- —
- Monthly cashflow
- —
- DSCR
- —
- Eligible?
- —
Personal DTI + credit; lowest rate.
DSCR
20% down · 8.5% · 30yr
- Down + closing
- —
- Monthly P&I
- —
- Monthly cashflow
- —
- DSCR
- —
- Eligible?
- —
No personal income docs; deal must DSCR.
Hard money
10% down · 12.0% · 12mo
- Down + closing
- —
- Monthly P&I
- —
- Monthly cashflow
- —
- DSCR
- —
- Eligible?
- —
Short-term bridge; refi at stabilization.
Rent comps 1 comps
| Address | Beds | Baths | Sqft | Rent | $/sqft | DOM | Units | Dist |
|---|---|---|---|---|---|---|---|---|
| 11105 Pinto Dr Port Richey, FL | 2.0 | 1.0 | 672 | $1,350 | $2.01 | 14d | 1 | 0.84mi |
Listing history 48 events
-
2026-06-07days on market $199,000 Active 262 DOM
-
2026-06-04days on market $199,000 Active 259 DOM
-
2026-06-03days on market $199,000 Active 258 DOM
-
2026-06-02days on market $199,000 Active 257 DOM
-
2026-06-01days on market $199,000 Active 256 DOM
-
2026-05-31days on market $199,000 Active 255 DOM
-
2026-05-21price $199,000
-
2025-09-18$249,900 Active
-
2025-03-21price $199,900
-
2025-02-22price $225,000
-
2025-02-02price $239,900
-
2025-01-11$245,000 Active
-
2024-11-12historical
-
2024-10-01price $279,000
-
2024-08-15$299,000 Active
-
2024-08-07historical
-
2024-07-01$300,000 Active
-
2024-06-06historical
-
2024-06-06historical
-
2024-03-21price $295,000
-
2024-03-21price $295,000
-
2024-02-06$335,000 Active
-
2024-02-05$335,000 Active
-
2024-01-27historical
-
2024-01-19$335,000 Active
-
2023-12-15historical
-
2023-12-15historical
-
2023-12-11price $315,000
-
2023-12-11price $315,000
-
2023-11-03$335,000 Active
-
2023-11-03$335,000 Active
-
2023-10-24historical
-
2023-10-07$335,000 Active
-
2023-08-28soldstatus $160,000
-
2022-12-06historical
-
2022-09-15$375,000 Active
-
2021-11-29soldstatus $77,000
-
2015-06-08soldstatus $76,000
-
2015-06-05historical
-
2015-06-03soldstatus $76,000 Sold
-
2015-05-21status Pending
-
2015-04-21$79,000 Active
-
2015-03-31historical
-
2014-06-14status Active
-
2014-06-10historical
-
2014-03-26$89,900 Active
-
1998-01-07soldstatus $30,000
-
1980-07-01soldstatus $5,500
ⓘ Source: listings_history table (triggers on properties + properties_extension) + one-shot
backfill from property_details.listing_events for pre-trigger history.
Tax reassessment forecast FL · Resets to sale price
- Current annual tax
- $1,921 · $160/mo
- Projected year-2 tax
- $1,921 · $160/mo
- Expected delta
- $0/yr ($0/mo · 0.0%)
ⓘ Screening estimate from a state-policy table — verify with the county assessor before closing.
Climate risk First Street
- Flood 1/10 Low FEMA zone X (unshaded) · 0% chance over 30 yrs
- Wildfire 4/10 Moderate
- Heat 10/10 Extreme 7 d/yr ≥108°F today · 26 d/yr by 30 yrs out
- Wind 10/10 Extreme 99% chance of damaging wind over 30 yrs
- Air quality 2/10 Low 1 unhealthy d/yr today · 3 by 30 yrs out
Nearby sold comps map
Loading sold comps map…
Walkable amenities ~0.75 mi
Loading nearby amenities…
Taxation est. · year 1
- Rental income
- $19,280
- − Mortgage interest
- −$11,147
- − Property taxes
- −$1,921
- − Insurance
- −$995
- − Repairs & maintenance
- −$1,542
- − Management
- −$1,542
- − Depreciation
- −$5,789
- Taxable loss
- −$3,657
- Est. tax savings @ 24.0%
- +$878
- After-tax cash flow
- $670/yr
For passive investors: Depreciation is non-cash, so a rental often shows a tax loss while cash-flowing — sheltering income. Rental losses are passive: they offset passive income freely, and up to $25,000/yr can offset ordinary (W-2) income if you actively participate and your MAGI is under $100k (phasing out to $0 by $150k); unused losses carry forward. On sale, claimed depreciation is recaptured at up to 25%, and gains may owe capital-gains tax (a 1031 exchange can defer both). Figures are a year-1 estimate at your 24.0% rate — not tax advice; consult a CPA.
Schools (NCES district)
- District
- Pasco
- NCES district ID
- 1201530
- Math proficiency
- 50% ▼ -10.00%
- Reading proficiency
- 52% ▼ -5.00%
- Median HH income
- $45,039
- Composite
- 43.14/100
- National rank
- #3074
- State rank
- #32 of 73 in FL
Livability — Meadow Oaks
- Score
- 61/100
- State rank
- #794
- US rank
- #18203
Category grades
Schools grade is shown separately in the Schools card above.
Census & demographics
- County
- Pasco County · 524,098 people
- Metro
- Tampa-St. Petersburg-Clearwater, FL
- Population (ZIP)
- 14,618
- Household income
- $58,638
- Rent vs Own
- Severe rent burden
- 176.0
Population outlook (Pasco County) Hauer SSP2
- Today (2025)
- 570,045 people
- By 2030
- 605,844 · +6.3%
- By 2040
- 674,806 · +18.4%
- By 2050
- 736,022 · +29.1%
- By 2075
- 862,900 · +51.4%
- By 2100
- 906,364 · +59.0%
Race, ethnicity, and origin ACS 2023
- Neighborhood character
- Predominantly White (80%)
- Race & ethnicity
- White 80% Hispanic / Latino 10% Two or more races 6% Black 4% Asian 3%
- Hispanic origin (detail)
- Puerto Rican 5% Cuban 1%
- Common ancestry
- Romanian 4% Lithuanian 2% Slovak 1%
- Foreign-born
- 8% · Canada, Vietnam, Jamaica
- Languages at home
- 90% English-only · Spanish 7% Vietnamese 3% Other Indo-European 1%
Political lean MEDSL · Pasco
- 2024 margin
- Strong R (+25.2) · D 36.9% · R 62.1% · Other 1.0%
- 2008→2024 swing
- -21.6pp toward R · 2008: -3.6pp · 2024: -25.2pp
- All cycles
- 2024: R+25.2 2020: R+20.1 2016: R+21.6 2012: R+6.7 2008: R+3.6
Not yet ingested
- Civics
- —
Market trends
- HPI YoY
- ▼ -102.24%
- Current HPI
- 321.5862
- Rent YoY
- —
- Metro
- Tampa-St. Petersburg-Clearwater, FL
- State GDP YoY
- ▲ 3.28%
- F500 in state
- 36
Industry mix (Fortune 500 HQ in FL)
| Industry | F500 HQs | Revenue |
|---|---|---|
| Industrial Technology | 2 | $29B |
|
||
| Insurance | 2 | $17B |
|
||
| Retail | 1 | $60B |
|
||
| Technology Distribution | 1 | $58B |
|
||
| Homebuilding | 1 | $35B |
|
||
| Technology Manufacturing | 1 | $35B |
|
||
Price history
+3518.2% since first listed42 events — show timeline
- 2026-05-21 Price Changed $199,000 Stellar MLS as Distributed by MLS Grid
- 2025-09-18 Listed $249,900 Stellar MLS as Distributed by MLS Grid
- 2025-03-21 Price Changed $199,900 Stellar MLS as Distributed by MLS Grid
- 2025-02-22 Price Changed $225,000 Stellar MLS as Distributed by MLS Grid
- 2025-02-02 Price Changed $239,900 Stellar MLS as Distributed by MLS Grid
- 2025-01-11 Listed $245,000 Stellar MLS as Distributed by MLS Grid
- 2024-11-12 Listing Removed — Stellar MLS as Distributed by MLS Grid
- 2024-10-01 Price Changed $279,000 Stellar MLS as Distributed by MLS Grid
- 2024-08-15 Listed $299,000 Stellar MLS as Distributed by MLS Grid
- 2024-08-07 Listing Removed — Stellar MLS as Distributed by MLS Grid
- 2024-07-01 Listed $300,000 Stellar MLS as Distributed by MLS Grid
- 2024-06-06 Listing Removed — Stellar MLS as Distributed by MLS Grid
- 2024-06-06 Listing Removed — HCAR
- 2024-03-21 Price Changed $295,000 HCAR
- 2024-03-21 Price Changed $295,000 Stellar MLS as Distributed by MLS Grid
- 2024-02-06 Listed $335,000 HCAR
- 2024-02-05 Listed $335,000 Stellar MLS as Distributed by MLS Grid
- 2024-01-27 Listing Removed — Stellar MLS as Distributed by MLS Grid
- 2024-01-19 Listed $335,000 Stellar MLS as Distributed by MLS Grid
- 2023-12-15 Listing Removed — Stellar MLS as Distributed by MLS Grid
- 2023-12-15 Listing Removed — Stellar MLS as Distributed by MLS Grid
- 2023-12-11 Price Changed $315,000 Stellar MLS as Distributed by MLS Grid
- 2023-12-11 Price Changed $315,000 Stellar MLS as Distributed by MLS Grid
- 2023-11-03 Listed $335,000 Stellar MLS as Distributed by MLS Grid
- 2023-11-03 Listed $335,000 Stellar MLS as Distributed by MLS Grid
- 2023-10-24 Listing Removed — Stellar MLS as Distributed by MLS Grid
- 2023-10-07 Listed $335,000 Stellar MLS as Distributed by MLS Grid
- 2023-08-28 Sold (Public Records) $160,000 Public Records
- 2022-12-06 Listing Removed — Stellar MLS as Distributed by MLS Grid
- 2022-09-15 Listed $375,000 Stellar MLS as Distributed by MLS Grid
- 2021-11-29 Sold (Public Records) $77,000 Public Records
- 2015-06-08 Sold (Public Records) $76,000 Public Records
- 2015-06-05 Listing Removed — Stellar MLS as Distributed by MLS Grid
- 2015-06-03 Sold (MLS) $76,000 Stellar MLS as Distributed by MLS Grid
- 2015-05-21 Pending — Stellar MLS as Distributed by MLS Grid
- 2015-04-21 Listed $79,000 Stellar MLS as Distributed by MLS Grid
- 2015-03-31 Listing Removed — Stellar MLS as Distributed by MLS Grid
- 2014-06-14 Relisted — Stellar MLS as Distributed by MLS Grid
- 2014-06-10 Listing Removed — Stellar MLS as Distributed by MLS Grid
- 2014-03-26 Listed $89,900 Stellar MLS as Distributed by MLS Grid
- 1998-01-07 Sold (Public Records) $30,000 Public Records
- 1980-07-01 Sold (Public Records) $5,500 Public Records
Property tax history
+24.7%/yrLatest (2025): $1,921 · +8.6% YoY. Source: county tax records.
Cash-flow waterfall
monthlySold comps — $/sqft
last 12 mo · ≤1 miLoading sold comps…