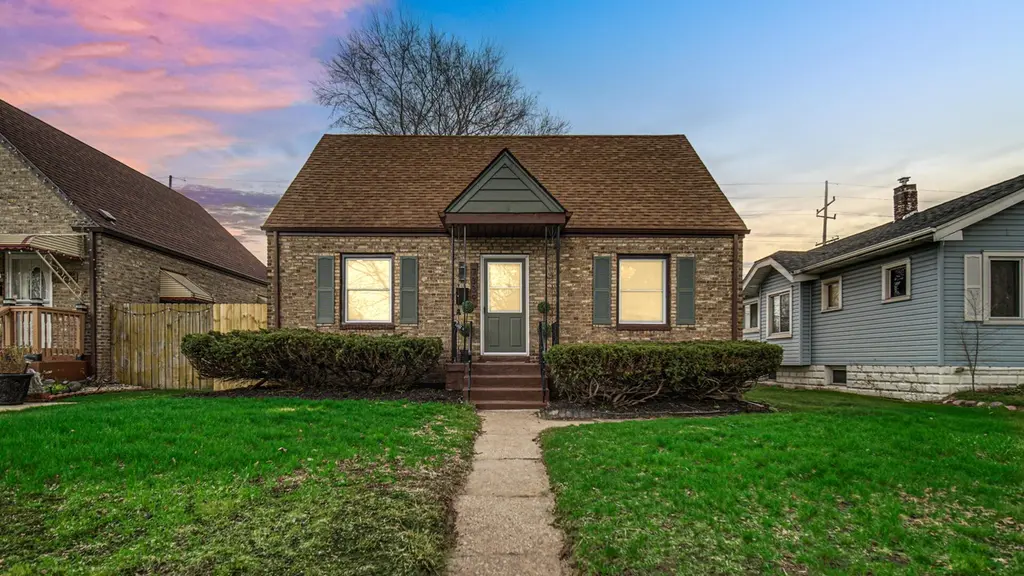
7339 Jefferson Ave · Hammond, IN
Flood risk 1/10 · Minimal
- FEMA flood zone
- X (unshaded)
- Chance of flooding over 30 yrs
- 0.0%
- Est. flood insurance / yr
- $473 – $860
Fire risk 1/10 · Minimal
- Est. fire insurance / yr
- $717 – $1,331
Heat risk 3/10 · Minor
- Hot days now (above 102°F)
- 7 days/yr
- Hot days in 30 yrs
- 15 days/yr
Wind risk 2/10 · Minimal
- Chance of severe wind over 30 yrs
- 0.0%
Air-quality risk 4/10 · Minor
- Unhealthy air days now
- 5 days/yr
- Unhealthy air days in 30 yrs
- 6 days/yr
Risk factors via First Street. Map © Google.
Why this score? — see what drove the D+ grade
The composite is a weighted blend of 9 inputs, each scored 0–100. Each bar is that input's sub-score; the figure is the points it added to the 100-point composite (weight × sub-score).
- Cash flow +23.7/30.0
- DSCR +7.6/10.0
- 1% rule +4.9/10.0
- Rent growth +3.9/5.0
- Livability +3.5/5.0
- Condition / age +2.5/5.0
- Schools +1.1/10.0
- ARV discount +0.0/15.0
- Appreciation +0.0/10.0
$285,000
🖨 Deal sheet 📄 Offer letter ✓ Due diligence
Listing remarks MLS
Investor Special! Value-Add Play! Currently 2 bed, 2.5 bath with potential to convert to 3 bed, 3 bath and expand living space by finishing the basement (800 sqft approx. ) Beautiful solid brick two-story with a detached 2-car garage, fenced backyard. GREAT NEIGHBORHOOD! Ideal cosmetic update / quick flip. As-is.
Key facts
- Great closet space
- Fenced backyard
- Hardwood floors
Tags
Property features AI
Exterior
- Parking: Detached garage; 2 garage spaces; Garage faces rear with alley access; On-street parking; Garage door opener
- Utilities: Public water; Public sewer; 100 Amp electric service
- Home design: Brick construction; Shingle roof; One-and-one-half story; Built in 1945
- Construction: Brick exterior; Shingle roof; Finished basement
- Exterior features: Neighborhood view; Fenced backyard; Detached garage structure
Interior
- Kitchen: Gas range; Microwave; Refrigerator; Dishwasher; Stainless steel appliances; Granite counters
- Bedrooms: Primary bedroom; Three additional bedrooms
- Flooring: Hardwood; Vinyl; Tile
- Bathrooms: Two full bathrooms; One half bathroom
- Heating & cooling: Forced air heating; Central air conditioning; Ceiling fans
- Interior features: Ceiling fans; Recessed lighting; His-and-hers closets; Granite countertops; Finished basement
- Laundry & utility: Laundry room
Neighborhood map
What this means for you Summary
Snapshot
- This is a 3-bed/1.5-bath single-family listed at $285k.
Deal economics
- At list price, monthly cash flow is $543 ($7k/yr) — positive.
- The deal already cash-flows at list — no discount required.
- To meet the 1% rule (rent ≥ 1% of price), the offer needs to be $281k (1.5% below list).
- Recommended offer: $276k (3.0% below list) — sets the bar for market timing.
- Cap rate 8.6% vs local median 5.8% in Hammond — top-decile yield for the area; either an underpriced asset or a hidden risk that comps aren't pricing in. Stress-test before assuming the spread holds.
Location & tenants
- Location reads 70/100 on livability (#143 in IN) — a middle-class / working-renter tenant base. Strengths: cost of living A+, housing A+, commute A; Watch: health & safety D+, employment D, schools F.
- School City Of Hammond (suburban): math 8% / reading 18% proficiency, ranked #289 of 301 in IN (top 96%) — low school quality limits family demand, transient renter base, plan for 1-2y turnover; 74% free/reduced lunch — lower-income household profile, screen leases tightly.
- Market conditions: Rents rising fast (+5.5%/yr); 63 active listings in the ZIP; 10 comparable units currently listed for rent nearby; rentals leasing fast (median 2d on market — plan ~1-2 weeks tenant-placement turnaround); 1,642 units permitted in Lake County in 2024 (14 in 5+ unit buildings).
- At $2,809/mo this rent would consume 53% of the median local household income ($63k/yr) (locally 507% of renters already pay >50% of income on rent) — very limited rent-growth headroom before tenants either downsize or default.
Forward outlook
- Local home prices are declining (-3.0%/yr); year-one equity from $2k of loan paydown is wiped out by about $9k of value loss. Plan a longer hold.
- Lake County population projected to shrink 7% by 2050 — rents likely to lag national; underwrite the cash flow, not the appreciation.
- At projected returns (-3.0% appreciation + 5.5% rent growth), your $80k cash investment doubles in ~10 years — after that, you're playing with house money.
Negotiation context
- It's been on market 54 days — a 3% lower offer ($276k) is reasonable based on typical stale-listing flexibility.
- 3 sale attempts with the ask held roughly flat each time — persistent listings suggest the price (not the market) is what's stuck; bring a comps-based counter.
- Current owner paid $155k; list at $285k implies a 84% gain — meaningful room to come down on a strong offer.
Risks & watch-outs
- Watch-outs: built in 1945 — expect roof / HVAC / electrical / plumbing capex.
Questions for the listing agent
- It's been on market 54 days. Have you received any prior offers? Is the seller open to a 3% concession, seller financing, or rate buy-down credit?
- Built in 1945 — when were the roof, HVAC, electrical panel, plumbing, and water heater last replaced?
- Is there a deadline driving the sale (1031 exchange, divorce, estate, relocation)? That informs how much negotiation room exists.
- Schools are F-rated, which usually means shorter tenancies and higher turnover. Who's the typical renter profile here, and what's been the actual vacancy rate?
- Crime grade is F in this area — have there been break-ins, vandalism, or insurance claims at this property in the last 3 years? What carrier currently insures it and at what premium?
- The area grade is low — what's the realistic commute time and amenity access for the typical tenant pool here? Any planned neighborhood developments (good or bad) we should know about?
- What's the average days-on-market for RENTAL listings here right now (not sales)? A rising rental-DOM trend means longer vacancies and softer asking-rent achievability than the comps imply.
- What's the recent tenant-quality profile in this submarket — average credit score on applications, eviction rate, late-payment / NSF rate, and stable-employment percentage? A property-management company in the area should have these aggregated.
- How much new for-sale + rental construction is in the pipeline within 1–3 miles? Heavy new supply typically softens prices + rents 12–24 months out; constrained supply supports both.
Investment metrics
- 1% rule
- 0.99% ✗
- Cap rate
- 8.58%
- Cash-on-cash
- 8.17%
- DSCR
- 1.36
- GRM
- 8.5
CMA / ARV
- ARV (on-the-fly)
- $216,000
- Comps found
- 12
Show comp detail 12 sales within ~0.75 mi
| Address | Dist | Beds/Ba | Sqft | Sold | Price | $/sf | Match |
|---|---|---|---|---|---|---|---|
| 7339 Jefferson Ave | 0.00mi | 2/2.5 (-1) | 1,600 (0%) | 5mo | $155,000 | $97 | 86 |
| 7208 Monroe Ave | 0.25mi | 3/2.0 | 1,750 (+9%) | 1mo | $289,999 | $166 | 70 |
| 919 171st St | 0.41mi | 2/1.0 (-1) | 1,656 (+4%) | 2mo | $197,500 | $119 | 67 |
| 921 173rd St | 0.23mi | 4/2.0 (+1) | 1,763 (+10%) | 0mo | $238,500 | $135 | 65 |
| 7623 Monroe Ave | 0.36mi | 3/1.0 | 1,460 (-9%) | 2mo | $197,000 | $135 | 64 |
| 7405 Meadow Lane Ave | 0.55mi | 3/1.0 | 1,680 (+5%) | 5mo | $193,200 | $115 | 59 |
| 1125 177th Pl | 0.63mi | 2/1.0 (-1) | 1,652 (+3%) | 2mo | $169,000 | $102 | 57 |
| 7609 Jarnecke Ave | 0.55mi | 4/1.0 (+1) | 1,512 (-6%) | 5mo | $199,500 | $132 | 54 |
| 7341 Harrison Ave | 0.31mi | 4/2.0 (+1) | 1,365 (-15%) | 2mo | $201,995 | $148 | 52 |
| 7911 Jackson Ave | 0.71mi | 4/2.0 (+1) | 1,506 (-6%) | 1mo | $334,000 | $222 | 49 |
| 7840 Monroe Ave | 0.66mi | 3/1.0 | 1,379 (-14%) | 1mo | $320,000 | $232 | 43 |
| 7905 Jackson Ave | 0.70mi | 3/1.0 | 1,829 (+14%) | 5mo | $270,000 | $148 | 37 |
Match score weights: distance 35% · size 25% · config 20% · recency 20%. Top-matched comps best support the ARV.
Projected returns pro-forma
-3.0% appreciation · 5.51% rent growth · sell at horizon
- IRR
- -1.4%
- Equity multiple
- 0.94×
- Total profit
- $-4,462
- Equity at exit
- $42,494
- IRR
- 10.5%
- Equity multiple
- 1.90×
- Total profit
- $71,502
- Equity at exit
- $24,642
Cash invested: $79,800 (down + closing). Projections, not guarantees.
Landlord ↔ Tenant lean methodology
- Overall (STATE)
- 90 Strongly Landlord-Friendly
- State Indiana
- 90 Strongly Landlord-Friendly · R+11
- County
- — inherits STATE
- City
- — inherits STATE
ZIP-level market 46324
- Home prices YoY
- -9.6%
- Rents YoY
- 5.5%
- Active inventory
- 63
- Price-to-rent
- 8.5×
Monthly cashflow live
- Estimated rent
- $2,809 high interval (Pro) →
- Mortgage (P&I)
- −$1,495
- Tax from tax record
- −$62 /mo · $749/yr
- Insurance
- −$119
- HOA
- −$0
- Vacancy / Maint / Mgmt
- −$590
- Net cashflow
- $543
Break-even live
UW: 25.0% down · 7.5% · 30yr · 1.5% tax · 5.0% vac · 8.0% maint · 8.0% mgmt
Financing live
Cash to close
- Down payment
- $71,250
- Closing costs
- $8,550
- Reserves months
- —
- Total cash needed
- —
Loan-product check · same deal, 3 products live
Conventional
25% down · 7.5% · 30yr
- Down + closing
- —
- Monthly P&I
- —
- Monthly cashflow
- —
- DSCR
- —
- Eligible?
- —
Personal DTI + credit; lowest rate.
DSCR
20% down · 8.5% · 30yr
- Down + closing
- —
- Monthly P&I
- —
- Monthly cashflow
- —
- DSCR
- —
- Eligible?
- —
No personal income docs; deal must DSCR.
Hard money
10% down · 12.0% · 12mo
- Down + closing
- —
- Monthly P&I
- —
- Monthly cashflow
- —
- DSCR
- —
- Eligible?
- —
Short-term bridge; refi at stabilization.
Rent comps 10 comps
| Address | Beds | Baths | Sqft | Rent | $/sqft | DOM | Units | Dist |
|---|---|---|---|---|---|---|---|---|
| 7610 Manor Ave Munster, IN | 3.0 | 2.0 | 1700 | $4,750 | $2.79 | 1d | 1 | 0.62mi |
| 7611 Kinsley Pl Munster, IN | 3.0 | 2.0 | 1700 | $4,700 | $2.76 | 1d | 1 | 0.65mi |
| 252 Lawndale St Hammond, IN | 4.0 | 3.0 | 2016 | $2,600 | $1.29 | 1d | 1 | 0.70mi |
| 232 Gregory Ave Munster, IN | 3.0 | 1.5 | 1600 | $2,450 | $1.53 | 1d | 1 | 0.75mi |
| 7202 Chestnut Ave Hammond, IN | 3.0 | 2.0 | 2178 | $1,900 | $0.87 | 1d | 1 | 0.77mi |
| 7741 Hohman Ave Munster, IN | 4.0 | 2.0 | 2200 | $3,200 | $1.45 | 10d | 1 | 0.81mi |
| 7019 Chestnut Ave Hammond, IN | 3.0 | 1.5 | 1440 | $1,895 | $1.32 | 20d | 1 | 0.87mi |
| 8016 Monaldi Dr Munster, IN | 4.0 | 2.0 | 2000 | $2,999 | $1.50 | 10d | 1 | 0.89mi |
| 1539 Wentworth Ave Unit 3W Calumet City, IL | 3.0 | 1.0 | 1100 | $1,700 | $1.55 | 12d | 1 | 1.18mi |
| 18006 Wentworth Ave #3553 Lansing, IL | 2.0 | 1.0 | 1900 | $1,950 | $1.03 | 1d | 1 | 1.33mi |
Listing history 19 events
-
2026-06-15days on market $285,000 Active 54 DOM
-
2026-06-13days on market $285,000 Active 52 DOM
-
2026-06-09days on market $285,000 Active 48 DOM
-
2026-06-08days on market $285,000 Active 47 DOM
-
2026-06-07days on market $285,000 Active 46 DOM
-
2026-06-04days on market $285,000 Active 43 DOM
-
2026-06-03days on market $285,000 Active 42 DOM
-
2026-06-02days on market $285,000 Active 41 DOM
-
2026-06-01days on market $285,000 Active 40 DOM
-
2026-05-31days on market $285,000 Active 39 DOM
-
2026-05-18price $294,000
-
2026-05-09status Active
-
2026-04-27status Pending
-
2026-04-20price $295,000
-
2026-04-10$299,000 Active
-
2026-01-09soldstatus $155,000 Closed 314-char remark
Show marketing remark (314 chars)
Investor Special! Value-Add Play! Currently 2 bed, 2.5 bath with potential to convert to 3 bed, 3 bath and expand living space by finishing the basement (800 sqft approx. ) Beautiful solid brick two-story with a detached 2-car garage, fenced backyard. GREAT NEIGHBORHOOD! Ideal cosmetic update / quick flip. As-is.
-
2025-12-23status Pending 314-char remark
Show marketing remark (314 chars)
Investor Special! Value-Add Play! Currently 2 bed, 2.5 bath with potential to convert to 3 bed, 3 bath and expand living space by finishing the basement (800 sqft approx. ) Beautiful solid brick two-story with a detached 2-car garage, fenced backyard. GREAT NEIGHBORHOOD! Ideal cosmetic update / quick flip. As-is.
-
2025-12-16price $169,900 314-char remark
Show marketing remark (314 chars)
Investor Special! Value-Add Play! Currently 2 bed, 2.5 bath with potential to convert to 3 bed, 3 bath and expand living space by finishing the basement (800 sqft approx. ) Beautiful solid brick two-story with a detached 2-car garage, fenced backyard. GREAT NEIGHBORHOOD! Ideal cosmetic update / quick flip. As-is.
-
2025-12-16$163,900 Active 314-char remark
Show marketing remark (314 chars)
Investor Special! Value-Add Play! Currently 2 bed, 2.5 bath with potential to convert to 3 bed, 3 bath and expand living space by finishing the basement (800 sqft approx. ) Beautiful solid brick two-story with a detached 2-car garage, fenced backyard. GREAT NEIGHBORHOOD! Ideal cosmetic update / quick flip. As-is.
ⓘ Source: listings_history table (triggers on properties + properties_extension) + one-shot
backfill from property_details.listing_events for pre-trigger history.
Tax reassessment forecast IN · Partial reset (capped growth)
- Current annual tax
- $749 · $62/mo
- Projected year-2 tax
- $1,586 · $132/mo
- Expected delta
- +$837/yr (+$70/mo · 111.8%)
ⓘ Screening estimate from a state-policy table — verify with the county assessor before closing.
Climate risk First Street
- Flood 1/10 Low FEMA zone X (unshaded) · 0% chance over 30 yrs
- Wildfire 1/10 Low
- Heat 3/10 Moderate 7 d/yr ≥102°F today · 15 d/yr by 30 yrs out
- Wind 2/10 Low 0% chance of damaging wind over 30 yrs
- Air quality 4/10 Moderate 5 unhealthy d/yr today · 6 by 30 yrs out
Nearby sold comps map
Loading sold comps map…
Walkable amenities ~0.75 mi
Loading nearby amenities…
Taxation est. · year 1
- Rental income
- $33,703
- − Mortgage interest
- −$15,964
- − Property taxes
- −$749
- − Insurance
- −$1,425
- − Repairs & maintenance
- −$2,696
- − Management
- −$2,696
- − Depreciation
- −$8,291
- Taxable income
- $1,881
- Est. tax owed @ 24.0%
- −$452
- After-tax cash flow
- $6,065/yr
For passive investors: Depreciation is non-cash, so a rental often shows a tax loss while cash-flowing — sheltering income. Rental losses are passive: they offset passive income freely, and up to $25,000/yr can offset ordinary (W-2) income if you actively participate and your MAGI is under $100k (phasing out to $0 by $150k); unused losses carry forward. On sale, claimed depreciation is recaptured at up to 25%, and gains may owe capital-gains tax (a 1031 exchange can defer both). Figures are a year-1 estimate at your 24.0% rate — not tax advice; consult a CPA.
Schools (NCES district)
- District
- School City Of Hammond
- NCES district ID
- 1804320
- Math proficiency
- 8% ▼ -18.00%
- Reading proficiency
- 18% ▼ -15.00%
- Median HH income
- $39,970
- Composite
- 11.11/100
- National rank
- #9730
- State rank
- #289 of 301 in IN
Livability — Hammond
- Score
- 70/100
- State rank
- #143
- US rank
- #7343
Category grades
Schools grade is shown separately in the Schools card above.
Census & demographics
- Census place
- Hammond, IN
- County
- Lake County · 422,878 people
- City population
- 58,809
- Metro
- Chicago-Naperville-Elgin, IL-IN-WI
- Population (ZIP)
- 21,409
- Household income
- $63,052
- Rent vs Own
- Severe rent burden
- 507.0
Population outlook (Lake County) Hauer SSP2
- Today (2025)
- 484,026 people
- By 2030
- 478,091 · -1.2%
- By 2040
- 462,974 · -4.3%
- By 2050
- 449,894 · -7.1%
- By 2075
- 436,169 · -9.9%
- By 2100
- 426,607 · -11.9%
Race, ethnicity, and origin ACS 2023
- Neighborhood character
- Diverse neighborhood (Simpson 0.69)
- Race & ethnicity
- Hispanic / Latino 39% White 34% Black 22% Two or more races 14% Asian 1% Native American 1%
- Hispanic origin (detail)
- Mexican 31% Puerto Rican 5%
- Common ancestry
- Romanian 5% Lithuanian 1% Italian 1%
- Foreign-born
- 10% · Canada
- Languages at home
- 79% English-only · Spanish 20%
Political lean MEDSL · Lake
- 2024 margin
- Lean D (+5.6) · D 52.1% · R 46.5% · Other 1.5%
- 2008→2024 swing
- -28.6pp toward R · 2008: 34.3pp · 2024: 5.6pp
- All cycles
- 2024: D+5.6 2020: D+15.1 2016: D+20.6 2012: D+31.0 2008: D+34.3
Not yet ingested
- Civics
- —
Market trends
- HPI YoY
- ▼ -37.65%
- Current HPI
- 352.8678
- Rent YoY
- ▲ 5.51%
- Metro
- Chicago-Naperville-Elgin, IL-IN-WI
- State GDP YoY
- ▲ 2.90%
- F500 in state
- 18
Industry mix (Fortune 500 HQ in IN)
| Industry | F500 HQs | Revenue |
|---|---|---|
| Industrial Machinery | 2 | $37B |
|
||
| Healthcare | 1 | $177B |
|
||
| Pharmaceuticals | 1 | $45B |
|
||
| Metals / Steel | 1 | $18B |
|
||
| Agriculture | 1 | $17B |
|
||
| Packaging | 1 | $12B |
|
||
Price history
+79.4% since first listed9 events — show timeline
- 2026-05-18 Price Changed $294,000 NIRA MLS as Distributed by MLS Grid
- 2026-05-09 Relisted — NIRA MLS as Distributed by MLS Grid
- 2026-04-27 Pending — NIRA MLS as Distributed by MLS Grid
- 2026-04-20 Price Changed $295,000 NIRA MLS as Distributed by MLS Grid
- 2026-04-10 Listed $299,000 NIRA MLS as Distributed by MLS Grid
- 2026-01-09 Sold (MLS) $155,000 NIRA MLS as Distributed by MLS Grid
- 2025-12-23 Pending — NIRA MLS as Distributed by MLS Grid
- 2025-12-16 Price Changed $169,900 NIRA MLS as Distributed by MLS Grid
- 2025-12-16 Listed $163,900 NIRA MLS as Distributed by MLS Grid
Property tax history
+5.0%/yrLatest (2024): $749 · +2.0% YoY. Source: county tax records.
Cash-flow waterfall
monthlySold comps — $/sqft
last 12 mo · ≤1 miLoading sold comps…