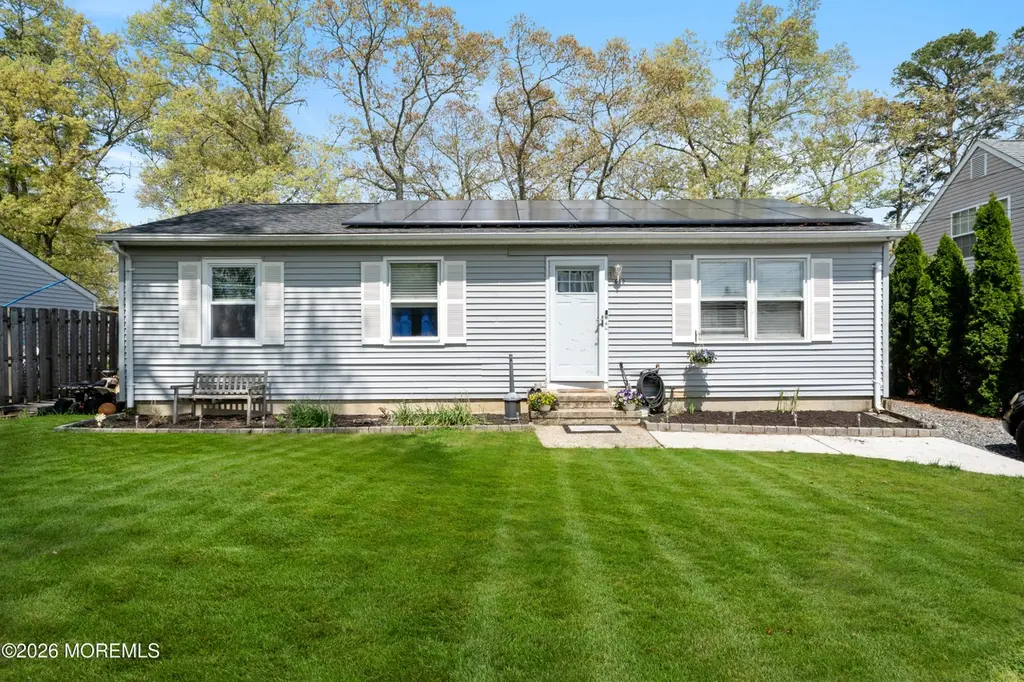
612 Nantucket Rd · Forked River, NJ
Flood risk 5/10 · Moderate
- FEMA flood zone
- AE
- Chance of flooding over 30 yrs
- 0.41%
- Est. flood insurance / yr
- $1,737 – $8,500
Fire risk 3/10 · Minor
- Est. fire insurance / yr
- $526 – $976
Heat risk 7/10 · Major
- Hot days now (above 98°F)
- 7 days/yr
- Hot days in 30 yrs
- 15 days/yr
Wind risk 8/10 · Major
- Chance of severe wind over 30 yrs
- 80.0%
Air-quality risk 2/10 · Minimal
- Unhealthy air days now
- 1 days/yr
- Unhealthy air days in 30 yrs
- 3 days/yr
Risk factors via First Street. Map © Google.
Why this score? — see what drove the D+ grade
The composite is a weighted blend of 9 inputs, each scored 0–100. Each bar is that input's sub-score; the figure is the points it added to the 100-point composite (weight × sub-score).
- Cash flow +21.5/30.0
- DSCR +6.8/10.0
- 1% rule +5.1/10.0
- ARV discount +4.8/15.0
- Livability +3.1/5.0
- Schools +3.0/10.0
- Rent growth +2.5/5.0
- Condition / age +2.5/5.0
- Appreciation +0.0/10.0
$384,900
🖨 Deal sheet 📄 Offer letter ✓ Due diligence
Key facts
- Quartz vanity
- Private driveway
- 5,662 sq ft lot
Tags
Property features AI
Exterior
- Parking: No garage
- Utilities: Public sewer
- Home design: Fee simple ownership
- Construction: Crawl space foundation
- Exterior features: Shingle roof
Interior
- Kitchen: Gas stove
- Bedrooms: 3 bedrooms
- Bathrooms: 1 full bathroom
- Heating & cooling: Forced air heating; No central air
- Interior features: Outdoor lighting; Light fixtures
Neighborhood map
What this means for you Summary
Snapshot
- This is a 3-bed/1.0-bath single-family listed at $385k.
Deal economics
- At list price, monthly cash flow is $148 ($2k/yr) — positive.
- The deal already cash-flows at list — no discount required.
- Meets the 1% rule at list price ($4k rent vs $385k).
- Recommended offer: $373k (3.0% below list) — sets the bar for market timing.
- Cap rate 8.1% vs local median 3.2% in Forked River — top-decile yield for the area; either an underpriced asset or a hidden risk that comps aren't pricing in. Stress-test before assuming the spread holds.
Location & tenants
- Location reads 61/100 on livability (#464 in NJ) — a middle-class / working-renter tenant base. Strengths: housing A+, crime A-, employment A-; Watch: amenities F, commute F, cost of living F.
- Lacey Township School District (suburban): math 22% / reading 43% proficiency, ranked #299 of 472 in NJ (top 63%) — families likely to look elsewhere, expect single-tenant / working-renter base with shorter leases; only 19% free/reduced lunch — higher-income household profile.
- Market conditions: 190 active listings in the ZIP; 1 comparable units currently listed for rent nearby; 4,434 units permitted in Ocean County in 2024 (868 in 5+ unit buildings).
Forward outlook
- Local home prices are declining (-3.0%/yr); year-one equity from $3k of loan paydown is wiped out by about $12k of value loss. Plan a longer hold.
- Ocean County population projected to shrink 8% by 2050 — rents likely to lag national; underwrite the cash flow, not the appreciation.
Negotiation context
- It's been on market 37 days — a 3% lower offer ($373k) is reasonable based on typical stale-listing flexibility.
- 5 sale attempts since 4y ago with the ask held roughly flat each time — persistent listings suggest the price (not the market) is what's stuck; bring a comps-based counter.
- Current owner paid $282k; 36% above their basis — modest negotiation headroom, anchor on the comps not their cost.
Risks & watch-outs
- Watch-outs: flood insurance adds $427/mo.
- Climate carrying-cost: in FEMA flood zone AE (mandatory federal flood insurance); severe wind risk, 80% chance of damaging wind over 30y; extreme-heat days projected 7→15/yr by 2055 (HVAC capex compounding) — expect insurance premiums to compound above CPI over the hold.
Questions for the listing agent
- It's been on market 37 days. Have you received any prior offers? Is the seller open to a 3% concession, seller financing, or rate buy-down credit?
- What's the actual annual flood-insurance premium (NFIP or private), and is the property in a SFHA with mandatory coverage?
- Is there a deadline driving the sale (1031 exchange, divorce, estate, relocation)? That informs how much negotiation room exists.
- The area grade is low — what's the realistic commute time and amenity access for the typical tenant pool here? Any planned neighborhood developments (good or bad) we should know about?
- What's the average days-on-market for RENTAL listings here right now (not sales)? A rising rental-DOM trend means longer vacancies and softer asking-rent achievability than the comps imply.
- What's the recent tenant-quality profile in this submarket — average credit score on applications, eviction rate, late-payment / NSF rate, and stable-employment percentage? A property-management company in the area should have these aggregated.
- How much new for-sale + rental construction is in the pipeline within 1–3 miles? Heavy new supply typically softens prices + rents 12–24 months out; constrained supply supports both.
Investment metrics
- 1% rule
- 1.01% ✓
- Cap rate
- 8.08%
- Cash-on-cash
- 6.40%
- DSCR
- 1.28
- GRM
- 8.2
CMA / ARV
- ARV (median comp)
- $363,135
- List price
- $384,900
- Delta
- 5.99%
- Verdict
- FAIR
- Comps
- 20 within 1.0 mi
Show comp detail 12 sales within ~0.75 mi
| Address | Dist | Beds/Ba | Sqft | Sold | Price | $/sf | Match |
|---|---|---|---|---|---|---|---|
| 613 Twin River Dr | 0.08mi | 2/1.0 (-1) | 1,143 (+13%) | 5mo | $412,000 | $360 | 64 |
| 713 Tampa Rd | 0.36mi | 3/1.0 | 1,090 (+8%) | 7mo | $363,000 | $333 | 63 |
| 315 Sea Bright Rd | 0.34mi | 3/1.0 | 942 (-6%) | 13mo | $425,000 | $451 | 62 |
| 1010 Waterview Way | 0.57mi | 3/1.0 | 960 (-5%) | 6mo | $375,000 | $391 | 60 |
| 4 Clubhouse Cir | 0.62mi | 3/1.0 | 1,040 (+3%) | 8mo | $419,500 | $403 | 59 |
| 809 Pensacola Rd | 0.46mi | 3/1.0 | 900 (-11%) | 3mo | $360,000 | $400 | 58 |
| 625 Twin River Dr | 0.10mi | 2/1.0 (-1) | 864 (-14%) | 10mo | $260,000 | $301 | 58 |
| 1015 Tampa Rd | 0.64mi | 3/1.0 | 960 (-5%) | 7mo | $350,000 | $365 | 56 |
| 1010 Inland Rd | 0.58mi | 3/1.0 | 1,080 (+7%) | 8mo | $400,000 | $370 | 54 |
| 114 Nantucket Rd | 0.59mi | 3/1.0 | 960 (-5%) | 13mo | $400,000 | $417 | 54 |
| 205 Nantucket Rd | 0.51mi | 2/1.0 (-1) | 1,093 (+8%) | 9mo | $400,000 | $366 | 49 |
| 1024 Sarasota Dr | 0.71mi | 3/1.0 | 1,152 (+14%) | 12mo | $430,000 | $373 | 33 |
Match score weights: distance 35% · size 25% · config 20% · recency 20%. Top-matched comps best support the ARV.
Projected returns pro-forma
-3.0% appreciation · 3.0% rent growth · sell at horizon
- IRR
- -13.6%
- Equity multiple
- 0.51×
- Total profit
- $-52,725
- Equity at exit
- $57,390
- IRR
- -4.6%
- Equity multiple
- 0.70×
- Total profit
- $-32,860
- Equity at exit
- $33,279
Cash invested: $107,772 (down + closing). Projections, not guarantees.
Landlord ↔ Tenant lean methodology
- Overall (STATE)
- 21 Tenant-Leaning
- State New Jersey
- 21 Tenant-Leaning · D+6
- County
- — inherits STATE
- City
- — inherits STATE
ZIP-level market 08731
- Active inventory
- 190
- Price-to-rent
- 8.2×
Monthly cashflow live
- Estimated rent
- $3,902 medium interval (Pro) →
- Mortgage (P&I)
- −$2,018
- Tax from tax record
- −$329 /mo · $3,952/yr
- Insurance
- −$160
- Flood insurance flood zone
- −$427 /mo · $5,118/yr
- HOA
- −$0
- Vacancy / Maint / Mgmt
- −$819
- Net cashflow
- $148
Break-even live
UW: 25.0% down · 7.5% · 30yr · 1.5% tax · 5.0% vac · 8.0% maint · 8.0% mgmt
Financing live
Cash to close
- Down payment
- $96,225
- Closing costs
- $11,547
- Reserves months
- —
- Total cash needed
- —
Loan-product check · same deal, 3 products live
Conventional
25% down · 7.5% · 30yr
- Down + closing
- —
- Monthly P&I
- —
- Monthly cashflow
- —
- DSCR
- —
- Eligible?
- —
Personal DTI + credit; lowest rate.
DSCR
20% down · 8.5% · 30yr
- Down + closing
- —
- Monthly P&I
- —
- Monthly cashflow
- —
- DSCR
- —
- Eligible?
- —
No personal income docs; deal must DSCR.
Hard money
10% down · 12.0% · 12mo
- Down + closing
- —
- Monthly P&I
- —
- Monthly cashflow
- —
- DSCR
- —
- Eligible?
- —
Short-term bridge; refi at stabilization.
Rent comps 1 comps
| Address | Beds | Baths | Sqft | Rent | $/sqft | DOM | Units | Dist |
|---|---|---|---|---|---|---|---|---|
| 1404 Hilo Bay Dr Unit 1546204P Forked River, NJ | 2.0 | 2.0 | 1345 | $3,902 | $2.90 | 7d | 1 | 1.18mi |
Listing history 25 events
-
2026-06-15days on market $384,900 Active 37 DOM
-
2026-06-13days on market $384,900 Active 35 DOM
-
2026-06-09days on market $384,900 Active 31 DOM
-
2026-06-08days on market $384,900 Active 30 DOM
-
2026-06-07days on market $384,900 Active 29 DOM
-
2026-06-04days on market $384,900 Active 26 DOM
-
2026-06-03days on market $384,900 Active 25 DOM
-
2026-06-02days on market $384,900 Active 24 DOM
-
2026-06-01days on market $384,900 Active 23 DOM
-
2026-05-31days on market $384,900 Active 22 DOM
-
2026-05-09$384,900 Active 798-char remark
-
2023-08-07soldstatus $282,000
-
2023-08-03historical
-
2023-06-23status Pending
-
2023-06-22historical
-
2023-06-19status Active
-
2023-05-15historical Active/Under Contract
-
2023-04-18status Active
-
2023-04-06historical Active/Under Contract
-
2023-03-23price $275,000
-
2023-03-09price $279,500
-
2023-02-14price $289,500
-
2023-01-09$295,000 Active
-
2022-06-12historical
-
2022-03-09$240,000 Active
ⓘ Source: listings_history table (triggers on properties + properties_extension) + one-shot
backfill from property_details.listing_events for pre-trigger history.
Tax reassessment forecast NJ · Partial reset (capped growth)
- Current annual tax
- $3,952 · $329/mo
- Projected year-2 tax
- $6,768 · $564/mo
- Expected delta
- +$2,816/yr (+$235/mo · 71.3%)
ⓘ Screening estimate from a state-policy table — verify with the county assessor before closing.
Climate risk First Street
- Flood 5/10 Major FEMA zone AE · 41% chance over 30 yrs
- Wildfire 3/10 Moderate
- Heat 7/10 Severe 7 d/yr ≥98°F today · 15 d/yr by 30 yrs out
- Wind 8/10 Severe 80% chance of damaging wind over 30 yrs
- Air quality 2/10 Low 1 unhealthy d/yr today · 3 by 30 yrs out
Nearby sold comps map
Loading sold comps map…
Walkable amenities ~0.75 mi
Loading nearby amenities…
Taxation est. · year 1
- Rental income
- $46,824
- − Mortgage interest
- −$21,560
- − Property taxes
- −$3,952
- − Insurance
- −$7,043
- − Repairs & maintenance
- −$3,746
- − Management
- −$3,746
- − Depreciation
- −$11,197
- Taxable loss
- −$4,420
- Est. tax savings @ 24.0%
- +$1,061
- After-tax cash flow
- $2,835/yr
For passive investors: Depreciation is non-cash, so a rental often shows a tax loss while cash-flowing — sheltering income. Rental losses are passive: they offset passive income freely, and up to $25,000/yr can offset ordinary (W-2) income if you actively participate and your MAGI is under $100k (phasing out to $0 by $150k); unused losses carry forward. On sale, claimed depreciation is recaptured at up to 25%, and gains may owe capital-gains tax (a 1031 exchange can defer both). Figures are a year-1 estimate at your 24.0% rate — not tax advice; consult a CPA.
Schools (NCES district)
- District
- Lacey Township School District
- NCES district ID
- 3408100
- Math proficiency
- 22% ▼ -18.00%
- Reading proficiency
- 43% ▼ -11.00%
- Median HH income
- $73,331
- Composite
- 30.42/100
- National rank
- #6242
- State rank
- #299 of 472 in NJ
Livability — Forked River
- Score
- 61/100
- State rank
- #464
- US rank
- #17753
Category grades
Schools grade is shown separately in the Schools card above.
Census & demographics
- Census place
- Forked River, NJ
- Population (ZIP)
- 21,136
Population outlook (Ocean County) Hauer SSP2
- Today (2025)
- 586,991 people
- By 2030
- 581,403 · -1.0%
- By 2040
- 564,913 · -3.8%
- By 2050
- 538,149 · -8.3%
- By 2075
- 468,845 · -20.1%
- By 2100
- 350,297 · -40.3%
Race, ethnicity, and origin ACS 2023
- Neighborhood character
- Predominantly White (82%)
- Race & ethnicity
- White 82% Hispanic / Latino 15% Two or more races 6%
- Hispanic origin (detail)
- Mexican 2% Puerto Rican 8%
- Common ancestry
- Romanian 12% Slovak 2% Scotch-Irish 2%
- Foreign-born
- 6% · Canada
- Languages at home
- 92% English-only · Spanish 4% Other Indo-European 1% Russian/Polish/Slavic 1%
Political lean MEDSL · Ocean
- 2024 margin
- Solid R (+36.0) · D 31.4% · R 67.4% · Other 1.2%
- 2008→2024 swing
- -17.6pp toward R · 2008: -18.4pp · 2024: -36.0pp
- All cycles
- 2024: R+36.0 2020: R+28.7 2016: R+34.0 2012: R+17.7 2008: R+18.4
Not yet ingested
- Civics
- —
Market trends
- HPI YoY
- ▼ -328.91%
- Current HPI
- 352.355
- Rent YoY
- —
- Metro
- —
- State GDP YoY
- ▲ 2.05%
- F500 in state
- 34
Industry mix (Fortune 500 HQ in NJ)
| Industry | F500 HQs | Revenue |
|---|---|---|
| Consumer Goods | 3 | $31B |
|
||
| Pharmaceuticals | 2 | $153B |
|
||
| Technology | 2 | $21B |
|
||
| Insurance | 2 | $20B |
|
||
| Healthcare | 2 | $19B |
|
||
| Financial Services | 1 | $70B |
|
||
Price history
+60.4% since first listed15 events — show timeline
- 2026-05-09 Listed $384,900 MOMLS
- 2023-08-07 Sold (Public Records) $282,000 Public Records
- 2023-08-03 Delisted — MOMLS
- 2023-06-23 Pending — MOMLS
- 2023-06-22 Delisted — MOMLS
- 2023-06-19 Relisted — MOMLS
- 2023-05-15 Contingent — MOMLS
- 2023-04-18 Relisted — MOMLS
- 2023-04-06 Contingent — MOMLS
- 2023-03-23 Price Changed $275,000 MOMLS
- 2023-03-09 Price Changed $279,500 MOMLS
- 2023-02-14 Price Changed $289,500 MOMLS
- 2023-01-09 Listed $295,000 MOMLS
- 2022-06-12 Delisted — MOMLS
- 2022-03-09 Listed $240,000 MOMLS
Property tax history
+2.8%/yrLatest (2025): $3,952 · +7.9% YoY. Source: county tax records.
Cash-flow waterfall
monthlySold comps — $/sqft
last 12 mo · ≤1 miLoading sold comps…