106 Richbell Rd Unit B2 · Mamaroneck, NY
Flood risk 5/10 · Moderate
- FEMA flood zone
- X (unshaded)
- Chance of flooding over 30 yrs
- 0.24%
- Est. flood insurance / yr
- $473 – $860
Fire risk 1/10 · Minimal
- Est. fire insurance / yr
- $691 – $1,283
Heat risk 6/10 · Moderate
- Hot days now (above 98°F)
- 7 days/yr
- Hot days in 30 yrs
- 16 days/yr
Wind risk 6/10 · Moderate
- Chance of severe wind over 30 yrs
- 27.0%
Air-quality risk 4/10 · Minor
- Unhealthy air days now
- 7 days/yr
- Unhealthy air days in 30 yrs
- 7 days/yr
Risk factors via First Street. Map © Google.
Why this score? — see what drove the B- grade
The composite is a weighted blend of 9 inputs, each scored 0–100. Each bar is that input's sub-score; the figure is the points it added to the 100-point composite (weight × sub-score).
- Cash flow +24.2/30.0
- 1% rule +10.0/10.0
- DSCR +7.8/10.0
- ARV discount +7.5/15.0
- Schools +7.1/10.0
- Rent growth +4.2/5.0
- Livability +3.5/5.0
- Condition / age +2.5/5.0
- Appreciation +0.0/10.0
$175,000
🖨 Deal sheet (PDF) 📄 Offer letter ✓ Due diligence
Listing remarks MLS
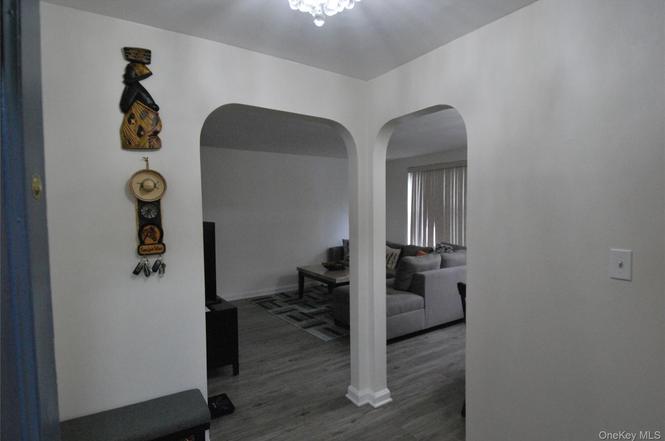
New to market, great unit. Second floor location. Updated and ready for new owner. Unit faces Palmer Avenue. Additional Information: HeatingFuel:Oil Above Ground,
Key facts
- New flooring
- Great exposure
- Beautiful bath
Tags
Neighborhood map
What this means for you Summary
Snapshot
- This is a 1-bed/1.0-bath condo listed at $175k.
Deal economics
- At list price, monthly cash flow is $348 ($4k/yr) — positive.
- The deal already cash-flows at list — no discount required.
- Meets the 1% rule at list price ($3k rent vs $175k).
- Recommended offer: $159k (9.0% below list) — sets the bar for market timing.
- Cap rate 8.7% vs local median 3.1% in Mamaroneck — top-decile yield for the area; either an underpriced asset or a hidden risk that comps aren't pricing in. Stress-test before assuming the spread holds.
Location & tenants
- Location reads 69/100 on livability (#491 in NY) — a middle-class / working-renter tenant base. Strengths: crime A+, employment A+; Watch: amenities C-, commute F, cost of living F.
- Mamaroneck Union Free School District (suburban): math 74% / reading 81% proficiency, ranked #47 of 590 in NY (top 8%) — strong family-tenant draw, lease renewals of 3-5y typical; only 12% free/reduced lunch — higher-income household profile.
- Zoned schools: Central School (math 78% / reading 78%, grade A, #239 of 2,108 statewide, top 11%, 513 students, 14% FRL); Hommocks School (math 65% / reading 79%, grade A, #76 of 729 statewide, top 11%, 1,258 students, 20% FRL); Mamaroneck High School (math 95% / reading 91%, grade A+, #147 of 1,100 statewide, top 14%, 1,660 students, 23% FRL).
- Market conditions: Rents rising fast (+6.7%/yr); 127 active listings in the ZIP; 15 comparable units currently listed for rent nearby; rentals lingering (median 46d on market — plan ~5-8 weeks vacancy on turnover, expect pricing pressure); 53% of comp listings sitting > 30 days — soft ceiling on asking rent; high-income renter base; 954 units permitted in Westchester County in 2024 (649 in 5+ unit buildings).
Forward outlook
- Local home prices are declining (-3.0%/yr); year-one equity from $1k of loan paydown is wiped out by about $5k of value loss. Plan a longer hold.
- Westchester County population projected at +10% by 2050 — modest demand growth; plan on rents tracking national, not racing it.
- At projected returns (-3.0% appreciation + 6.7% rent growth), your $49k cash investment doubles in ~8 years — after that, you're playing with house money.
Negotiation context
- It's been on market 112 days — a 9% lower offer ($159k) is reasonable based on typical stale-listing flexibility.
- 10 sale attempts since 27y ago with the ask held roughly flat each time — persistent listings suggest the price (not the market) is what's stuck; bring a comps-based counter.
- Current owner paid $105k; list at $175k implies a 67% gain — meaningful room to come down on a strong offer.
Risks & watch-outs
- Watch-outs: HOA is 27% of rent; built in 1949 — expect roof / HVAC / electrical / plumbing capex.
- Climate carrying-cost: moderate flood risk; major wind risk, 27% chance of damaging wind over 30y; extreme-heat days projected 7→16/yr by 2055 (HVAC capex compounding) — expect insurance premiums to compound above CPI over the hold.
Questions for the listing agent
- It's been on market 112 days. Have you received any prior offers? Is the seller open to a 9% concession, seller financing, or rate buy-down credit?
- Built in 1949 — when were the roof, HVAC, electrical panel, plumbing, and water heater last replaced?
- What does the HOA fee cover, when was the last increase, and are there any pending special assessments or reserve-fund shortfalls?
- Any open or pending special assessments — roof, HVAC, plumbing, elevator, façade? What's the per-unit balance and payoff schedule, and is the seller paying it off at close or rolling it to the buyer?
- Why hasn't it sold? Are there any deal-killer items the seller is aware of (foundation, flood, title, zoning, code violations)?
- Is there a deadline driving the sale (1031 exchange, divorce, estate, relocation)? That informs how much negotiation room exists.
- Schools are B-rated — typically a magnet for longer-tenancy family renters. What's the average tenant stay here, and is there a school-zone premium baked into asking?
- What's the average days-on-market for RENTAL listings here right now (not sales)? A rising rental-DOM trend means longer vacancies and softer asking-rent achievability than the comps imply.
- What's the recent tenant-quality profile in this submarket — average credit score on applications, eviction rate, late-payment / NSF rate, and stable-employment percentage? A property-management company in the area should have these aggregated.
- How much new apartment / multifamily construction is in the pipeline within 1–3 miles? Heavy new supply (>2% of stock underway) typically softens rents 12–24 months out; light construction supports rent growth.
Investment metrics
- 1% rule
- 1.71% ✓
- Cap rate
- 8.68%
- Cash-on-cash
- 8.52%
- DSCR
- 1.38
- GRM
- 4.9
CMA / ARV
No comps found within radius.
Projected returns pro-forma
-3.0% appreciation · 6.7% rent growth · sell at horizon
- IRR
- 3.0%
- Equity multiple
- 1.12×
- Total profit
- $5,924
- Equity at exit
- $26,093
- IRR
- 17.2%
- Equity multiple
- 2.78×
- Total profit
- $87,167
- Equity at exit
- $15,131
Cash invested: $49,000 (down + closing). Projections, not guarantees.
Landlord ↔ Tenant lean methodology
- Overall (STATE)
- 15 Strongly Tenant-Friendly
- State New York
- 15 Strongly Tenant-Friendly · D+10
- County
- — inherits STATE
- City
- — inherits STATE
ZIP-level market 10543
- Rents YoY
- 6.7%
- Active inventory
- 127
- Price-to-rent
- 4.9×
Monthly cashflow live
- Estimated rent
- $2,998 high interval (Pro) →
- Mortgage (P&I)
- −$918
- Tax est. 1.5%
- −$219 /mo · $2,625/yr
- Insurance
- −$73
- HOA est. from 1 same-building comp
- −$811
- Lot rent
- −$0
- Vacancy / Maint / Mgmt
- −$630
- Net cashflow
- $348
Break-even live
Sensitivity live
| Price | -10% $469 | -5% $408 | +0% $348 | +5% $288 | +10% $227 |
|---|---|---|---|---|---|
| Rent | -10% $111 | -5% $230 | +0% $348 | +5% $466 | +10% $585 |
| Rate | -1.0pp $436 | -0.5pp $392 | base $348 | +0.5pp $303 | +1.0pp $256 |
UW: 25.0% down · 7.5% · 30yr · 1.5% tax · 5.0% vac · 8.0% maint · 8.0% mgmt
Financing live
Cash to close
- Down payment
- $43,750
- Closing costs
- $5,250
- Reserves months
- —
- Total cash needed
- —
Loan-product check · same deal, 3 products live
Conventional
25% down · 7.5% · 30yr
- Down + closing
- —
- Monthly P&I
- —
- Monthly cashflow
- —
- DSCR
- —
- Eligible?
- —
Personal DTI + credit; lowest rate.
DSCR
20% down · 8.5% · 30yr
- Down + closing
- —
- Monthly P&I
- —
- Monthly cashflow
- —
- DSCR
- —
- Eligible?
- —
No personal income docs; deal must DSCR.
Hard money
10% down · 12.0% · 12mo
- Down + closing
- —
- Monthly P&I
- —
- Monthly cashflow
- —
- DSCR
- —
- Eligible?
- —
Short-term bridge; refi at stabilization.
Rent comps 15 comps
| Address | Beds | Baths | Sqft | Rent | $/sqft | DOM | Units | Dist |
|---|---|---|---|---|---|---|---|---|
| 314 Larchmont Acres Unit 4C Mamaroneck, NY | 2.0 | 1.0 | 1074 | $2,985 | $2.78 | 27d | 1 | 0.07mi |
| 4 Larchmont Acres Unit 4C Larchmont, NY | 2.0 | 1.0 | 1074 | $2,985 | $2.78 | 27d | 1 | 0.10mi |
| 505 Rockland Ave Unit 2 Mamaroneck, NY | 1.0 | 1.0 | 700 | $2,800 | $4.00 | 46d | 1 | 0.37mi |
| 412 Munro Ave Apt 3F Mamaroneck, NY | 1.0 | 1.0 | 750 | $2,950 | $3.93 | 46d | 1 | 0.58mi |
| 300 Livingston Ave Unit 3E Mamaroneck, NY | 1.0 | 1.0 | 946 | $3,600 | $3.81 | 46d | 1 | 0.68mi |
| 1833 Palmer Ave Unit 3K Larchmont, NY | 2.0 | 1.0 | 875 | $2,700 | $3.09 | 46d | 1 | 0.71mi |
| 338 Palmer Ave Unit B Mamaroneck, NY | 2.0 | 1.0 | 900 | $3,700 | $4.11 | 27d | 1 | 0.73mi |
| 225 Stanley Ave #313 Mamaroneck, NY | 1.0 | 1.0 | 825 | $3,500 | $4.24 | 27d | 1 | 0.83mi |
| 172 E Prospect Ave Unit 304 Mamaroneck, NY | 1.0 | 2.0 | 925 | $3,620 | $3.91 | 46d | 1 | 0.95mi |
| 18 Grand St Mamaroneck, NY | 1.0 | 1.0 | 790 | $3,025 | $3.83 | 23d | 1 | 1.07mi |
| 416 Tompkins Ave Unit SECOND FLOOR Mamaroneck, NY | 2.0 | 1.0 | 1100 | $3,800 | $3.45 | 46d | 1 | 1.09mi |
| 746 Mamaroneck Ave Mamaroneck, NY | 1.0–2.0 | 1.0–2.0 | 974 | $3,585 | $3.68 | 0d | 17 | 1.12mi |
| 5 Lester Pl Unit 1 Larchmont, NY | 2.0 | 1.0 | 850 | $3,200 | $3.76 | 27d | 1 | 1.15mi |
| 538 Jefferson Ave Mamaroneck, NY | 1.0 | 1.0 | 600 | $2,100 | $3.50 | 46d | 1 | 1.39mi |
| 501 N Barry Ave Unit 2F Mamaroneck, NY | 1.0 | 1.0 | 600 | $2,150 | $3.58 | 46d | 1 | 1.45mi |
HOA detail condo
- Monthly dues
- $0 · $0/yr
- Assessments
- None detected in remarks — confirm with the listing agent.
Listing history 27 events
-
2026-03-11status Pending
-
2026-01-29price $175,000
-
2025-12-10price $179,000
-
2025-12-04status Active
-
2025-11-04status Pending
-
2025-10-20$182,900 Active
-
2017-06-05soldstatus $105,000 Sold 162-char remark
Show marketing remark (162 chars)
New to market, great unit. Second floor location. Updated and ready for new owner. Unit faces Palmer Avenue. Additional Information: HeatingFuel:Oil Above Ground,
-
2017-02-15historical Pending 162-char remark
Show marketing remark (162 chars)
New to market, great unit. Second floor location. Updated and ready for new owner. Unit faces Palmer Avenue. Additional Information: HeatingFuel:Oil Above Ground,
-
2016-12-19$110,000 Active 162-char remark
Show marketing remark (162 chars)
New to market, great unit. Second floor location. Updated and ready for new owner. Unit faces Palmer Avenue. Additional Information: HeatingFuel:Oil Above Ground,
-
2016-12-14historical
-
2016-11-13price $115,000
-
2016-10-13$117,500 Active
-
2014-12-03historical Withdrawn
-
2014-12-03historical
-
2014-11-19Active
-
2014-11-19$105,000
-
2007-04-09soldstatus $130,000
-
2007-01-22price $139,900
-
2007-01-22historical
-
2006-11-16$130,000
-
2006-04-05historical
-
2006-02-04
-
2006-01-20historical
-
2005-12-20
-
2000-04-25soldstatus $30,500
-
2000-04-25price $33,000
-
1999-11-19$30,500
ⓘ Source: listings_history table (triggers on properties + properties_extension) + one-shot
backfill from property_details.listing_events for pre-trigger history.
Climate risk First Street
- Flood 5/10 Major FEMA zone X (unshaded) · 24% chance over 30 yrs
- Wildfire 1/10 Low
- Heat 6/10 Major 7 d/yr ≥98°F today · 16 d/yr by 30 yrs out
- Wind 6/10 Major 27% chance of damaging wind over 30 yrs
- Air quality 4/10 Moderate 7 unhealthy d/yr today · 7 by 30 yrs out
Nearby sold comps map
Loading sold comps map…
Walkable amenities ~0.75 mi
Loading nearby amenities…
Taxation est. · year 1
- Rental income
- $35,975
- − Mortgage interest
- −$9,803
- − Property taxes
- −$2,625
- − Insurance
- −$875
- − Repairs & maintenance
- −$2,878
- − Management
- −$2,878
- − HOA
- −$9,732
- − Depreciation
- −$5,091
- Taxable income
- $2,094
- Est. tax owed @ 24.0%
- −$502
- After-tax cash flow
- $3,673/yr
For passive investors: Depreciation is non-cash, so a rental often shows a tax loss while cash-flowing — sheltering income. Rental losses are passive: they offset passive income freely, and up to $25,000/yr can offset ordinary (W-2) income if you actively participate and your MAGI is under $100k (phasing out to $0 by $150k); unused losses carry forward. On sale, claimed depreciation is recaptured at up to 25%, and gains may owe capital-gains tax (a 1031 exchange can defer both). Figures are a year-1 estimate at your 24.0% rate — not tax advice; consult a CPA.
Schools (NCES district)
- District
- Mamaroneck Union Free School District
- NCES district ID
- 3618240
- Math proficiency
- 74% ▼ -4.00%
- Reading proficiency
- 81% ▲ 9.00%
- Median HH income
- $111,011
- Composite
- 71.4/100
- National rank
- #228
- State rank
- #47 of 590 in NY
Livability — Mamaroneck
- Score
- 69/100
- State rank
- #491
- US rank
- #8656
Category grades
Schools grade is shown separately in the Schools card above.
Census & demographics
- Census place
- Mamaroneck, NY
- County
- Westchester County · 709,332 people
- City population
- 20,989
- Metro
- New York-Newark-Jersey City, NY-NJ-PA
- Population (ZIP)
- 20,989
- Household income
- $126,417
- Rent vs Own
- Severe rent burden
- 1152.0
Population outlook (Westchester County) Hauer SSP2
- Today (2025)
- 1,028,035 people
- By 2030
- 1,051,636 · +2.3%
- By 2040
- 1,098,520 · +6.9%
- By 2050
- 1,136,044 · +10.5%
- By 2075
- 1,196,925 · +16.4%
- By 2100
- 1,175,147 · +14.3%
Race, ethnicity, and origin ACS 2023
- Neighborhood character
- Diverse neighborhood (Simpson 0.57)
- Race & ethnicity
- White 59% Hispanic / Latino 27% Two or more races 11% Asian 5% Black 4% Native American 1%
- Hispanic origin (detail)
- Mexican 5% Puerto Rican 4% Dominican 2%
- Common ancestry
- Russian 3% Romanian 2% Scotch-Irish 2%
- Foreign-born
- 28% · Canada, Jamaica, China
- Languages at home
- 60% English-only · Spanish 23% Other Indo-European 8% Other Asian/Pacific 2%
Political lean MEDSL · Westchester
- 2024 margin
- Strong D (+26.3) · D 63.1% · R 36.9%
- 2008→2024 swing
- -1.3pp toward R · 2008: 27.6pp · 2024: 26.3pp
- All cycles
- 2024: D+26.3 2020: D+36.3 2016: D+32.8 2012: D+22.2 2008: D+27.6
Not yet ingested
- Civics
- —
Market trends
- HPI YoY
- ▼ -220.53%
- Current HPI
- 268.4687
- Rent YoY
- ▲ 6.70%
- Metro
- New York-Newark-Jersey City, NY-NJ-PA
- State GDP YoY
- ▲ 2.60%
- F500 in state
- 92
Industry mix (Fortune 500 HQ in NY)
| Industry | F500 HQs | Revenue |
|---|---|---|
| Financial Services | 10 | $950B |
|
||
| Consumer Goods | 9 | $162B |
|
||
| Insurance | 4 | $225B |
|
||
| Telecommunications | 2 | $144B |
|
||
| Pharmaceuticals | 2 | $112B |
|
||
| Media / Entertainment | 2 | $69B |
|
||
Price history
+473.8% since first listed27 events — show timeline
- 2026-03-11 Pending — OneKey® MLS as Distributed by MLS Grid
- 2026-01-29 Price Changed $175,000 OneKey® MLS as Distributed by MLS Grid
- 2025-12-10 Price Changed $179,000 OneKey® MLS as Distributed by MLS Grid
- 2025-12-04 Relisted — OneKey® MLS as Distributed by MLS Grid
- 2025-11-04 Pending — OneKey® MLS as Distributed by MLS Grid
- 2025-10-20 Listed $182,900 OneKey® MLS as Distributed by MLS Grid
- 2017-06-05 Sold (MLS) $105,000 OneKey® MLS as Distributed by MLS Grid
- 2017-02-15 Contingent — OneKey® MLS as Distributed by MLS Grid
- 2016-12-19 Listed $110,000 OneKey® MLS as Distributed by MLS Grid
- 2016-12-14 Listing Removed — OneKey® MLS as Distributed by MLS Grid
- 2016-11-13 Price Changed $115,000 OneKey® MLS as Distributed by MLS Grid
- 2016-10-13 Listed $117,500 OneKey® MLS as Distributed by MLS Grid
- 2014-12-03 Delisted — HGMLS
- 2014-12-03 Listing Removed — OneKey® MLS as Distributed by MLS Grid
- 2014-11-19 Listed — HGMLS
- 2014-11-19 Listed $105,000 OneKey® MLS as Distributed by MLS Grid
- 2007-04-09 Sold (MLS) $130,000 HGMLS
- 2007-01-22 Delisted — HGMLS
- 2007-01-22 Price Changed $139,900 HGMLS
- 2006-11-16 Listed $130,000 HGMLS
- 2006-04-05 Delisted — HGMLS
- 2006-02-04 Listed — HGMLS
- 2006-01-20 Delisted — HGMLS
- 2005-12-20 Listed — HGMLS
- 2000-04-25 Price Changed $33,000 HGMLS
- 2000-04-25 Sold (MLS) $30,500 HGMLS
- 1999-11-19 Listed $30,500 HGMLS
Cash-flow waterfall
monthlySold comps — $/sqft
last 12 mo · ≤1 miLoading sold comps…