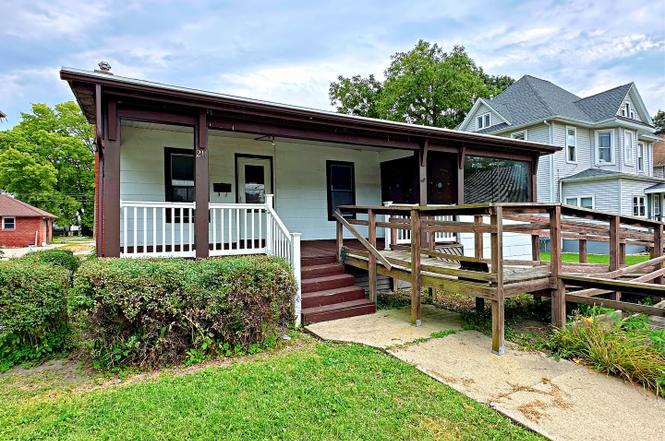
211 S Bloomington St · Streator, IL
Flood risk No data
- FEMA flood zone
- —
- Chance of flooding over 30 yrs
- —
- Est. flood insurance / yr
- —
Fire risk No data
- Est. fire insurance / yr
- —
Heat risk No data
- Hot days now (above threshold)
- —
- Hot days in 30 yrs
- —
Wind risk No data
- Chance of severe wind over 30 yrs
- —
Air-quality risk No data
- Unhealthy air days now
- —
- Unhealthy air days in 30 yrs
- —
Risk factors via First Street. Map © Google.
Why this score? — see what drove the B grade
The composite is a weighted blend of 9 inputs, each scored 0–100. Each bar is that input's sub-score; the figure is the points it added to the 100-point composite (weight × sub-score).
- Cash flow +30.0/30.0
- ARV discount +15.0/15.0
- 1% rule +10.0/10.0
- DSCR +10.0/10.0
- Livability +3.2/5.0
- Rent growth +2.5/5.0
- Condition / age +2.5/5.0
- Schools +1.3/10.0
- Appreciation +0.0/10.0
$75,000
🖨 Deal sheet 📄 Offer letter ✓ Due diligence
Listing remarks
Welcome to this spacious 3 bedroom, 1 bathroom home that combines character, comfort, and functionality. A large covered front porch greets you and offers the perfect spot to enjoy the outdoors. The living room welcomes you in and features a stone veneer gas fireplace, while the adjoining family room provides extra space to relax or entertain. The kitchen comes equipped with ample cabinet space as well as a stove and refrigerator, and the formal dining room is ideal for enjoying meals. Three bedrooms and a full bathroom with a walk-in shower provide an ideal layout, while a cozy sunroom offers a private retreat for unwinding. Additional highlights include timeless woodwork, built-in feature
Key facts
- Covered front porch
- Formal dining room
- Ample cabinet space
Tags
Property features AI
Finance
- Other: Property ownership is fee simple
- HOA & community: No master association fee required; School bus service
Exterior
- Parking: Detached garage owned with garage door opener; Gravel parking; Two garage spaces (two total parking spaces)
- Utilities: Public water; Public sewer
- Home design: Detached single-family home; One-story
- Construction: Asphalt roof; Brick/mortar foundation; Built before 1978
- Exterior features: Street paved with curbs, sidewalks and street lights; Lot dimensions approximately 57.5 x 140; Less than 0.25 acre lot
Interior
- Kitchen: Range; Refrigerator; Eating area / breakfast bar
- Bedrooms: Three bedrooms (all on main level); Master bedroom on main level
- Flooring: Carpet in living room, family room, dining room and bedrooms; Vinyl in kitchen; Carpet in sun room
- Bathrooms: One full bathroom
- Heating & cooling: Natural gas forced-air heating; Central air conditioning; Fuses for electric
- Interior features: Seven total rooms; Full unfinished basement; Separate dining room; Sun room
- Laundry & utility: Laundry room
Neighborhood map
What this means for you Summary
Snapshot
- This is a 3-bed/1.0-bath single-family listed at $75k.
Deal economics
- At list price, monthly cash flow is $721 ($9k/yr) — positive.
- The deal already cash-flows at list — no discount required.
- Meets the 1% rule at list price ($2k rent vs $75k).
- Cap rate 17.8% vs local median 7.8% in Streator — top-decile yield for the area; either an underpriced asset or a hidden risk that comps aren't pricing in. Stress-test before assuming the spread holds.
Location & tenants
- Location reads 63/100 on livability (#752 in IL) — a middle-class / working-renter tenant base. Strengths: cost of living A+, health & safety A+, housing B+; Watch: amenities F, commute F, employment F.
- Streator Twp Hsd 40 (town): math 11% / reading 19% proficiency, ranked #513 of 620 in IL (top 83%) — low school quality limits family demand, transient renter base, plan for 1-2y turnover.
- Zoned schools: Streator Twp High School (math 11% / reading 19%, grade F, #462 of 693 statewide, top 68%, 809 students, 0% FRL).
- Market conditions: 87 active listings in the ZIP; 5 comparable units currently listed for rent nearby; rentals leasing fast (median 8d on market — plan ~1-2 weeks tenant-placement turnaround); 82 units permitted in LaSalle County in 2024 (0 in 5+ unit buildings).
- This rent runs 32% of the median local income ($59k/yr) — at the standard rent-burdened threshold; future hikes will face affordability resistance.
Forward outlook
- Local home prices are declining (-3.0%/yr); year-one equity from $519 of loan paydown is wiped out by about $2k of value loss. Plan a longer hold.
- LaSalle County population projected at -16% by 2050 — secular population decline; favor cash flow + early exit over multi-decade hold.
- At projected returns (-3.0% appreciation + 3.0% rent growth), your $21k cash investment doubles in ~3 years — after that, you're playing with house money.
Negotiation context
- Only 4 days on market — expect competitive offers; lowballing is unlikely to land.
- 2 sale attempts; this cycle's ask has dropped $20k (21%) from the opening price — seller is motivated, your offer sets the floor, not the list.
Questions for the listing agent
- Is there a deadline driving the sale (1031 exchange, divorce, estate, relocation)? That informs how much negotiation room exists.
- Schools are F-rated, which usually means shorter tenancies and higher turnover. Who's the typical renter profile here, and what's been the actual vacancy rate?
- What's the average days-on-market for RENTAL listings here right now (not sales)? A rising rental-DOM trend means longer vacancies and softer asking-rent achievability than the comps imply.
- What's the recent tenant-quality profile in this submarket — average credit score on applications, eviction rate, late-payment / NSF rate, and stable-employment percentage? A property-management company in the area should have these aggregated.
- How much new for-sale + rental construction is in the pipeline within 1–3 miles? Heavy new supply typically softens prices + rents 12–24 months out; constrained supply supports both.
Investment metrics
- 1% rule
- 2.09% ✓
- Cap rate
- 17.83%
- Cash-on-cash
- 41.21%
- DSCR
- 2.83
- GRM
- 4.0
CMA / ARV
- ARV (on-the-fly)
- $135,044
- Comps found
- 12
Show comp detail 12 sales within ~0.75 mi
| Address | Dist | Beds/Ba | Sqft | Sold | Price | $/sf | Match |
|---|---|---|---|---|---|---|---|
| 215 W Washington St | 0.29mi | 2/1.0 (-1) | 1,449 (-2%) | 8mo | $120,000 | $83 | 71 |
| 216 Lasalle St | 0.22mi | 3/2.0 | 1,550 (+4%) | 14mo | $40,000 | $26 | 67 |
| 602 S Vermillion St | 0.34mi | 4/2.0 (+1) | 1,608 (+8%) | 0mo | $147,000 | $91 | 61 |
| 114 W Washington St | 0.18mi | 3/1.5 | 1,652 (+11%) | 13mo | $144,000 | $87 | 60 |
| 702 N Harrison St | 0.73mi | 3/1.0 | 1,454 (-2%) | 6mo | $150,000 | $103 | 58 |
| 903 Milner St | 0.69mi | 3/2.0 | 1,536 (+4%) | 1mo | $210,000 | $137 | 58 |
| 112 W Kent St | 0.41mi | 3/2.0 | 1,368 (-8%) | 10mo | $85,500 | $63 | 55 |
| 117 W 9th St | 0.64mi | 3/1.0 | 1,288 (-13%) | 9mo | $124,000 | $96 | 41 |
| 808 E Hickory St | 0.58mi | 4/2.0 (+1) | 1,300 (-12%) | 5mo | $132,400 | $102 | 39 |
| 616 N Everett St | 0.70mi | 3/2.0 | 1,314 (-12%) | 7mo | $149,000 | $113 | 38 |
| 1009 E Livingston St | 0.74mi | 3/1.0 | 1,308 (-12%) | 13mo | $72,500 | $55 | 35 |
| 111 W Larue St | 0.66mi | 4/2.0 (+1) | 1,290 (-13%) | 6mo | $94,900 | $74 | 34 |
Match score weights: distance 35% · size 25% · config 20% · recency 20%. Top-matched comps best support the ARV.
Projected returns pro-forma
-3.0% appreciation · 3.0% rent growth · sell at horizon
- IRR
- 37.8%
- Equity multiple
- 2.61×
- Total profit
- $33,800
- Equity at exit
- $11,183
- IRR
- 44.3%
- Equity multiple
- 5.22×
- Total profit
- $88,671
- Equity at exit
- $6,485
Cash invested: $21,000 (down + closing). Projections, not guarantees.
Landlord ↔ Tenant lean methodology
- Overall (STATE)
- 43 Moderately Tenant-Leaning
- State Illinois
- 43 Moderately Tenant-Leaning · D+7
- County
- — inherits STATE
- City
- — inherits STATE
ZIP-level market 61364
- Home prices YoY
- -31.1%
- Active inventory
- 87
- Price-to-rent
- 4.0×
Monthly cashflow live
- Estimated rent
- $1,569 high interval (Pro) →
- Mortgage (P&I)
- −$393
- Tax est. 1.5%
- −$94 /mo · $1,125/yr
- Insurance
- −$31
- HOA
- −$0
- Vacancy / Maint / Mgmt
- −$329
- Net cashflow
- $721
Break-even live
UW: 25.0% down · 7.5% · 30yr · 1.5% tax · 5.0% vac · 8.0% maint · 8.0% mgmt
Financing live
Cash to close
- Down payment
- $18,750
- Closing costs
- $2,250
- Reserves months
- —
- Total cash needed
- —
Loan-product check · same deal, 3 products live
Conventional
25% down · 7.5% · 30yr
- Down + closing
- —
- Monthly P&I
- —
- Monthly cashflow
- —
- DSCR
- —
- Eligible?
- —
Personal DTI + credit; lowest rate.
DSCR
20% down · 8.5% · 30yr
- Down + closing
- —
- Monthly P&I
- —
- Monthly cashflow
- —
- DSCR
- —
- Eligible?
- —
No personal income docs; deal must DSCR.
Hard money
10% down · 12.0% · 12mo
- Down + closing
- —
- Monthly P&I
- —
- Monthly cashflow
- —
- DSCR
- —
- Eligible?
- —
Short-term bridge; refi at stabilization.
Rent comps 5 comps
| Address | Beds | Baths | Sqft | Rent | $/sqft | DOM | Units | Dist |
|---|---|---|---|---|---|---|---|---|
| 503 S Bloomington St Streator, IL | 3.0 | 1.0 | 1200 | $1,500 | $1.25 | 24d | 1 | 0.21mi |
| 514 Lundy St Streator, IL | 3.0 | 1.0 | 1174 | $1,700 | $1.45 | 4d | 1 | 0.36mi |
| 514 Lundy St Streator, IL | 4.0 | 1.5 | 1300 | $1,700 | $1.31 | 7d | 1 | 0.36mi |
| 402 S Illinois St Streator, IL | 2.0 | 1.0 | 1116 | $1,550 | $1.39 | 22d | 1 | 0.53mi |
| 1409 Kelly St Streator, IL | 3.0 | 1.0 | 1280 | $1,750 | $1.37 | 7d | 1 | 1.30mi |
Listing history 26 events
-
2026-06-19days on market $75,000 Active 4 DOM
-
2026-06-18days on market $75,000 Active 3 DOM
-
2026-06-17days on market $75,000 Active 2 DOM
-
2026-06-16days on market $75,000 Active 1 DOM
-
2026-06-15days on market $75,000 Active 276 DOM
-
2026-06-14days on market $75,000 Active 274 DOM
-
2026-06-12days on market $75,000 Active 273 DOM
-
2026-06-09days on market $75,000 Active 270 DOM
-
2026-06-08days on market $75,000 Active 269 DOM
-
2026-06-07days on market $75,000 Active 268 DOM
-
2026-06-05days on market $75,000 Active 265 DOM
-
2026-06-03days on market $75,000 Active 264 DOM
-
2026-06-02days on market $75,000 Active 263 DOM
-
2026-06-01days on market $75,000 Active 262 DOM
-
2026-05-31days on market $75,000 Active 261 DOM
-
2026-05-30days on market $75,000 Active 260 DOM
-
2026-05-08price $75,000
-
2026-05-05status Active
-
2026-04-28status Pending
-
2026-04-20historical Contingent - Continue to Show
-
2026-02-27price $85,000
-
2026-02-10price $87,000
-
2026-01-02price $91,000
-
2025-10-28price $92,000
-
2025-10-09price $93,500
-
2025-09-05$95,000 Active
ⓘ Source: listings_history table (triggers on properties + properties_extension) + one-shot
backfill from property_details.listing_events for pre-trigger history.
Nearby sold comps map
Loading sold comps map…
Walkable amenities ~0.75 mi
Loading nearby amenities…
Taxation est. · year 1
- Rental income
- $18,827
- − Mortgage interest
- −$4,201
- − Property taxes
- −$1,125
- − Insurance
- −$375
- − Repairs & maintenance
- −$1,506
- − Management
- −$1,506
- − Depreciation
- −$2,182
- Taxable income
- $7,932
- Est. tax owed @ 24.0%
- −$1,904
- After-tax cash flow
- $6,750/yr
For passive investors: Depreciation is non-cash, so a rental often shows a tax loss while cash-flowing — sheltering income. Rental losses are passive: they offset passive income freely, and up to $25,000/yr can offset ordinary (W-2) income if you actively participate and your MAGI is under $100k (phasing out to $0 by $150k); unused losses carry forward. On sale, claimed depreciation is recaptured at up to 25%, and gains may owe capital-gains tax (a 1031 exchange can defer both). Figures are a year-1 estimate at your 24.0% rate — not tax advice; consult a CPA.
Schools (NCES district)
- District
- Streator Twp Hsd 40
- NCES district ID
- 1738100
- Math proficiency
- 11% ▼ -4.00%
- Reading proficiency
- 19% ▼ -1.00%
- Median HH income
- $43,002
- Composite
- 13.07/100
- National rank
- #9561
- State rank
- #513 of 620 in IL
Livability — Streator
- Score
- 63/100
- State rank
- #752
- US rank
- #15266
Category grades
Schools grade is shown separately in the Schools card above.
Census & demographics
- Census place
- Streator, IL
- County
- La Salle County · 41,676 people
- City population
- 17,963
- Metro
- Ottawa, IL
- Population (ZIP)
- 17,963
- Household income
- $59,060
- Rent vs Own
- Severe rent burden
- 450.0
Population outlook (LaSalle County) Hauer SSP2
- Today (2025)
- 107,080 people
- By 2030
- 104,196 · -2.7%
- By 2040
- 97,413 · -9.0%
- By 2050
- 90,294 · -15.7%
- By 2075
- 76,252 · -28.8%
- By 2100
- 61,339 · -42.7%
Race, ethnicity, and origin ACS 2023
- Neighborhood character
- Predominantly White (83%)
- Race & ethnicity
- White 83% Hispanic / Latino 11% Two or more races 4% Black 3%
- Hispanic origin (detail)
- Mexican 10%
- Common ancestry
- Romanian 3% Lithuanian 2% Slovak 2%
- Foreign-born
- 3% · Canada
- Languages at home
- 93% English-only · Spanish 6%
Political lean MEDSL · LaSalle
- 2024 margin
- R (+18.5) · D 40.1% · R 58.6% · Other 1.3%
- 2008→2024 swing
- -29.6pp toward R · 2008: 11.1pp · 2024: -18.5pp
- All cycles
- 2024: R+18.5 2020: R+14.3 2016: R+14.4 2012: R+0.4 2008: D+11.1
Not yet ingested
- Civics
- —
Market trends
- HPI YoY
- ▼ -105.28%
- Current HPI
- 233.5533
- Rent YoY
- —
- Metro
- Ottawa, IL
- State GDP YoY
- ▲ 1.59%
- F500 in state
- 60
Industry mix (Fortune 500 HQ in IL)
| Industry | F500 HQs | Revenue |
|---|---|---|
| Insurance | 4 | $201B |
|
||
| Consumer Goods | 4 | $87B |
|
||
| Industrial Machinery | 3 | $64B |
|
||
| Healthcare | 2 | $55B |
|
||
| Retail / Pharmacy | 1 | $148B |
|
||
| Agriculture / Food | 1 | $86B |
|
||
Price history
-21.1% since first listed10 events — show timeline
- 2026-05-08 Price Changed $75,000 MRED as Distributed by MLS Grid
- 2026-05-05 Relisted — MRED as Distributed by MLS Grid
- 2026-04-28 Pending — MRED as Distributed by MLS Grid
- 2026-04-20 Contingent — MRED as Distributed by MLS Grid
- 2026-02-27 Price Changed $85,000 MRED as Distributed by MLS Grid
- 2026-02-10 Price Changed $87,000 MRED as Distributed by MLS Grid
- 2026-01-02 Price Changed $91,000 MRED as Distributed by MLS Grid
- 2025-10-28 Price Changed $92,000 MRED as Distributed by MLS Grid
- 2025-10-09 Price Changed $93,500 MRED as Distributed by MLS Grid
- 2025-09-05 Listed $95,000 MRED as Distributed by MLS Grid
Cash-flow waterfall
monthlySold comps — $/sqft
last 12 mo · ≤1 miLoading sold comps…