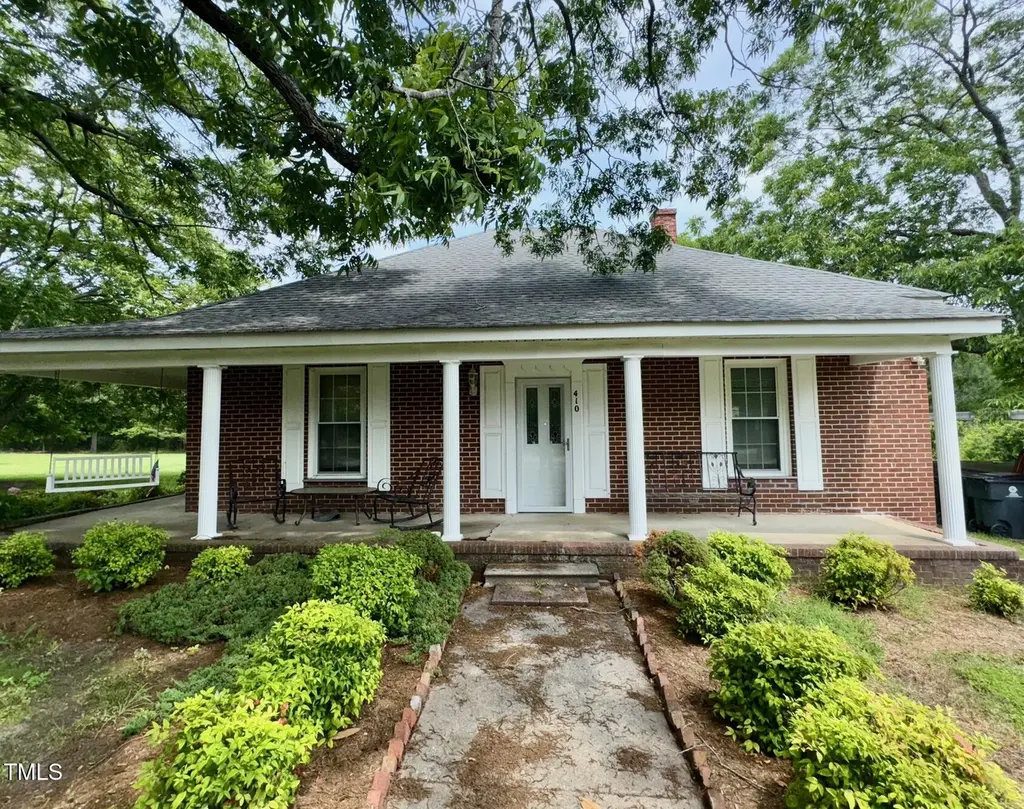
410 High St · Norlina, NC
Flood risk 1/10 · Minimal
- FEMA flood zone
- X (unshaded)
- Chance of flooding over 30 yrs
- 0.0%
- Est. flood insurance / yr
- $507 – $1,088
Fire risk 3/10 · Minor
- Est. fire insurance / yr
- $906 – $1,684
Heat risk 6/10 · Moderate
- Hot days now (above 105°F)
- 7 days/yr
- Hot days in 30 yrs
- 16 days/yr
Wind risk 6/10 · Moderate
- Chance of severe wind over 30 yrs
- 39.0%
Air-quality risk 1/10 · Minimal
- Unhealthy air days now
- 0 days/yr
- Unhealthy air days in 30 yrs
- 0 days/yr
Risk factors via First Street. Map © Google.
Why this score? — see what drove the D+ grade
The composite is a weighted blend of 9 inputs, each scored 0–100. Each bar is that input's sub-score; the figure is the points it added to the 100-point composite (weight × sub-score).
- ARV discount +15.0/15.0
- Cash flow +11.0/30.0
- Appreciation +7.8/10.0
- Livability +3.4/5.0
- DSCR +3.2/10.0
- 1% rule +2.7/10.0
- Rent growth +2.5/5.0
- Condition / age +2.5/5.0
- Schools +1.5/10.0
$179,900
🖨 Deal sheet 📄 Offer letter ✓ Due diligence
Listing remarks
Back on the market! 4.41 acres in the heart of Norlina, Seller open to subdividing land with front on Boyd Street. Interior pictures will show the home now vacant, with pictures prior to moving out. Investor opportunity or primary home for the DIY buyers. This parcel comes with a large lot that provides privacy or further construction. There are unopened streets. Please discuss options with the agent. Home is very original, sellers have done some electric updates, and the gas stove is the current heat, no a/c. Make arrangements to see this opportunity.
Key facts
- Electric updates
- 4.41 acres
- Large lot
Tags
Property features AI
Finance
- Other: Living area approximately 1,848; Coordinates: 36.444789, -78.188897; County: Warren
- Financial info: Annual tax information available
- HOA & community: No association; Senior community
Exterior
- Parking: 4 open parking spaces
- Utilities: Public water; Public sewer
- Home design: Single-story house
- Construction: Brick and vinyl siding exterior; Block foundation; Asphalt roof; Built as a house
- Exterior features: Public maintained road access; 4.24-acre lot
Interior
- Bedrooms: 3 bedrooms (all on the main level)
- Flooring: Carpet; Linoleum
- Bathrooms: 2 full bathrooms
- Heating & cooling: Propane heating; Space heater; No central air / no cooling
- Interior features: Carpet and linoleum flooring; Crawl space basement
Neighborhood map
What this means for you Summary
Snapshot
- This is a 3-bed/1.0-bath single-family listed at $180k.
Deal economics
- At list price, monthly cash flow is $-75 ($-895/yr) — negative.
- To cash-flow at today's rent, offer at most $167k (7.3% below list).
- To meet the 1% rule (rent ≥ 1% of price), the offer needs to be $139k (22.8% below list).
- Recommended offer: $139k (22.8% below list) — sets the bar for 1% rule.
Location & tenants
- Location reads 68/100 on livability (#185 in NC) — a middle-class / working-renter tenant base. Strengths: cost of living A+, health & safety A+, crime A; Watch: amenities F, commute F, employment F.
- Warren County Schools (rural): math 11% / reading 25% proficiency, ranked #174 of 178 in NC (top 98%) — low school quality limits family demand, transient renter base, plan for 1-2y turnover; 79% free/reduced lunch — lower-income household profile, screen leases tightly.
- Zoned schools: Warren County High (math 15% / reading 27%, grade F, #488 of 535 statewide, top 91%, 384 students, 99% FRL) — zoned schools average 99% FRL vs 79% district-wide (20 pts higher); higher-poverty schools than district average — tighter screening recommended.
- Market conditions: 20 active listings in the ZIP; 255 units permitted in Warren County in 2024 (0 in 5+ unit buildings).
Forward outlook
- In year one you build about $11k of equity ($1k loan paydown + $10k appreciation (5.5% local appreciation)).
- Warren County population projected at -27% by 2050 — secular population decline; favor cash flow + early exit over multi-decade hold.
- At projected returns (5.5% appreciation + 3.0% rent growth), your $50k cash investment doubles in ~5 years — after that, you're playing with house money.
- By year 4, paydown + projected appreciation supports a ~$38k cash-out refi (75% LTV) — recoverable capital for the next deal without selling this one.
Negotiation context
- It's been on market 58 days — a 3% lower offer ($175k) is reasonable based on typical stale-listing flexibility.
- 4 sale attempts since 3y ago with the ask held roughly flat each time — persistent listings suggest the price (not the market) is what's stuck; bring a comps-based counter.
Risks & watch-outs
- Watch-outs: built in 1901 — expect roof / HVAC / electrical / plumbing capex.
- Climate carrying-cost: major wind risk, 39% chance of damaging wind over 30y; extreme-heat days projected 7→16/yr by 2055 (HVAC capex compounding) — expect insurance premiums to compound above CPI over the hold.
Questions for the listing agent
- What do current leases actually rent for vs. the listed asking? Can we see a recent rent roll and the last 12 months of T-12 income?
- It's been on market 58 days. Have you received any prior offers? Is the seller open to a 23% concession, seller financing, or rate buy-down credit?
- Built in 1901 — when were the roof, HVAC, electrical panel, plumbing, and water heater last replaced?
- Is there a deadline driving the sale (1031 exchange, divorce, estate, relocation)? That informs how much negotiation room exists.
- Schools are F-rated, which usually means shorter tenancies and higher turnover. Who's the typical renter profile here, and what's been the actual vacancy rate?
- The area grade is low — what's the realistic commute time and amenity access for the typical tenant pool here? Any planned neighborhood developments (good or bad) we should know about?
- What's the average days-on-market for RENTAL listings here right now (not sales)? A rising rental-DOM trend means longer vacancies and softer asking-rent achievability than the comps imply.
- What's the recent tenant-quality profile in this submarket — average credit score on applications, eviction rate, late-payment / NSF rate, and stable-employment percentage? A property-management company in the area should have these aggregated.
- How much new for-sale + rental construction is in the pipeline within 1–3 miles? Heavy new supply typically softens prices + rents 12–24 months out; constrained supply supports both.
Investment metrics
- 1% rule
- 0.77% ✗
- Cap rate
- 5.80%
- Cash-on-cash
- -1.78%
- DSCR
- 0.92
- GRM
- 10.8
CMA / ARV
- ARV (on-the-fly)
- $272,480
- Comps found
- 2
Show comp detail 2 sales within ~0.75 mi
| Address | Dist | Beds/Ba | Sqft | Sold | Price | $/sf | Match |
|---|---|---|---|---|---|---|---|
| 307 Darden St | 0.37mi | 4/3.0 (+1) | 2,093 (+1%) | 5mo | $275,000 | $131 | 64 |
| 210 Gaines St | 0.67mi | 4/2.5 (+1) | 1,901 (-9%) | 8mo | $248,700 | $131 | 37 |
Match score weights: distance 35% · size 25% · config 20% · recency 20%. Top-matched comps best support the ARV.
Projected returns pro-forma
5.55% appreciation · 3.0% rent growth · sell at horizon
- IRR
- 12.8%
- Equity multiple
- 1.84×
- Total profit
- $42,410
- Equity at exit
- $108,034
- IRR
- 13.5%
- Equity multiple
- 3.58×
- Total profit
- $129,810
- Equity at exit
- $191,690
Cash invested: $50,372 (down + closing). Projections, not guarantees.
Landlord ↔ Tenant lean methodology
- Overall (STATE)
- 85 Strongly Landlord-Friendly
- State North Carolina
- 85 Strongly Landlord-Friendly · R+3
- County
- — inherits STATE
- City
- — inherits STATE
ZIP-level market 27563
- Home prices YoY
- 3.2%
- Active inventory
- 20
- Price-to-rent
- 10.8×
Monthly cashflow live
- Estimated rent
- $1,388 medium interval (Pro) →
- Mortgage (P&I)
- −$943
- Tax from tax record
- −$153 /mo · $1,836/yr
- Insurance
- −$75
- HOA
- −$0
- Vacancy / Maint / Mgmt
- −$292
- Net cashflow
- $-75
Break-even live
UW: 25.0% down · 7.5% · 30yr · 1.5% tax · 5.0% vac · 8.0% maint · 8.0% mgmt
Financing live
Cash to close
- Down payment
- $44,975
- Closing costs
- $5,397
- Reserves months
- —
- Total cash needed
- —
Loan-product check · same deal, 3 products live
Conventional
25% down · 7.5% · 30yr
- Down + closing
- —
- Monthly P&I
- —
- Monthly cashflow
- —
- DSCR
- —
- Eligible?
- —
Personal DTI + credit; lowest rate.
DSCR
20% down · 8.5% · 30yr
- Down + closing
- —
- Monthly P&I
- —
- Monthly cashflow
- —
- DSCR
- —
- Eligible?
- —
No personal income docs; deal must DSCR.
Hard money
10% down · 12.0% · 12mo
- Down + closing
- —
- Monthly P&I
- —
- Monthly cashflow
- —
- DSCR
- —
- Eligible?
- —
Short-term bridge; refi at stabilization.
Listing history 20 events
-
2026-06-18days on market $179,900 Active 58 DOM
-
2026-06-17days on market $179,900 Active 57 DOM
-
2026-06-16days on market $179,900 Active 56 DOM
-
2026-06-15days on market $179,900 Active 55 DOM
-
2026-06-13days on market $179,900 Active 53 DOM
-
2026-06-09days on market $179,900 Active 49 DOM
-
2026-06-08days on market $179,900 Active 48 DOM
-
2026-06-07days on market $179,900 Active 47 DOM
-
2026-06-05days on market $179,900 Active 44 DOM
-
2026-06-03days on market $179,900 Active 43 DOM
-
2026-06-02days on market $179,900 Active 42 DOM
-
2026-06-01days on market $179,900 Active 41 DOM
-
2026-05-31days on market $179,900 Active 40 DOM
-
2026-04-21$179,900 Active
-
2025-11-20status Active
-
2025-09-02status Pending
-
2025-09-02historical
-
2025-06-13$169,900 Active
-
2024-04-15historical
-
2023-10-18$330,000 Active
ⓘ Source: listings_history table (triggers on properties + properties_extension) + one-shot
backfill from property_details.listing_events for pre-trigger history.
Tax reassessment forecast NC · Resets to sale price
- Current annual tax
- $1,836 · $153/mo
- Projected year-2 tax
- $1,836 · $153/mo
- Expected delta
- $0/yr ($0/mo · 0.0%)
ⓘ Screening estimate from a state-policy table — verify with the county assessor before closing.
Climate risk First Street
- Flood 1/10 Low FEMA zone X (unshaded) · 0% chance over 30 yrs
- Wildfire 3/10 Moderate
- Heat 6/10 Major 7 d/yr ≥105°F today · 16 d/yr by 30 yrs out
- Wind 6/10 Major 39% chance of damaging wind over 30 yrs
- Air quality 1/10 Low 0 unhealthy d/yr today · 0 by 30 yrs out
Nearby sold comps map
Loading sold comps map…
Walkable amenities ~0.75 mi
Loading nearby amenities…
Taxation est. · year 1
- Rental income
- $16,660
- − Mortgage interest
- −$10,077
- − Property taxes
- −$1,836
- − Insurance
- −$900
- − Repairs & maintenance
- −$1,333
- − Management
- −$1,333
- − Depreciation
- −$5,233
- Taxable loss
- −$4,052
- Est. tax savings @ 24.0%
- +$973
- After-tax cash flow
- $77/yr
For passive investors: Depreciation is non-cash, so a rental often shows a tax loss while cash-flowing — sheltering income. Rental losses are passive: they offset passive income freely, and up to $25,000/yr can offset ordinary (W-2) income if you actively participate and your MAGI is under $100k (phasing out to $0 by $150k); unused losses carry forward. On sale, claimed depreciation is recaptured at up to 25%, and gains may owe capital-gains tax (a 1031 exchange can defer both). Figures are a year-1 estimate at your 24.0% rate — not tax advice; consult a CPA.
Schools (NCES district)
- District
- Warren County Schools
- NCES district ID
- 3704740
- Math proficiency
- 11% ▼ -12.00%
- Reading proficiency
- 25% ▼ -3.00%
- Median HH income
- $33,433
- Composite
- 14.62/100
- National rank
- #9409
- State rank
- #174 of 178 in NC
Livability — Norlina
- Score
- 68/100
- State rank
- #185
- US rank
- #9302
Category grades
Schools grade is shown separately in the Schools card above.
Census & demographics
- Census place
- Norlina, NC
- Population (ZIP)
- 5,300
Population outlook (Warren County) Hauer SSP2
- Today (2025)
- 18,664 people
- By 2030
- 17,641 · -5.5%
- By 2040
- 15,442 · -17.3%
- By 2050
- 13,634 · -27.0%
- By 2075
- 10,523 · -43.6%
- By 2100
- 7,777 · -58.3%
Race, ethnicity, and origin ACS 2023
- Neighborhood character
- Majority Black (63%)
- Race & ethnicity
- Black 63% White 31% Two or more races 4%
- Common ancestry
- Lithuanian 2% Italian 1%
- Foreign-born
- 0% · Canada
- Languages at home
- 98% English-only · German/W. Germanic 1% Russian/Polish/Slavic 1% Spanish 1%
Political lean MEDSL · Warren
- 2024 margin
- D (+19.0) · D 58.8% · R 39.8% · Other 1.4%
- 2008→2024 swing
- -20.5pp toward R · 2008: 39.5pp · 2024: 19.0pp
- All cycles
- 2024: D+19.0 2020: D+25.7 2016: D+33.2 2012: D+36.0 2008: D+39.5
Not yet ingested
- Civics
- —
Market trends
- HPI YoY
- ▲ 5.55%
- Current HPI
- 181.0661
- Rent YoY
- —
- Metro
- —
- State GDP YoY
- ▲ 3.28%
- F500 in state
- 26
Industry mix (Fortune 500 HQ in NC)
| Industry | F500 HQs | Revenue |
|---|---|---|
| Financial Services | 2 | $213B |
|
||
| Retail | 2 | $95B |
|
||
| Industrial Conglomerate | 1 | $38B |
|
||
| Metals / Steel | 1 | $35B |
|
||
| Utilities | 1 | $30B |
|
||
| Industrial Machinery | 1 | $19B |
|
||
Price history
-45.5% since first listed7 events — show timeline
- 2026-04-21 Listed $179,900 TMLS
- 2025-11-20 Relisted — TMLS
- 2025-09-02 Pending — TMLS
- 2025-09-02 Listing Removed — TMLS
- 2025-06-13 Listed $169,900 TMLS
- 2024-04-15 Listing Removed — TMLS
- 2023-10-18 Listed $330,000 TMLS
Property tax history
+7.1%/yrLatest (2025): $1,836 · +48.5% YoY. Source: county tax records.
Cash-flow waterfall
monthlySold comps — $/sqft
last 12 mo · ≤1 miLoading sold comps…