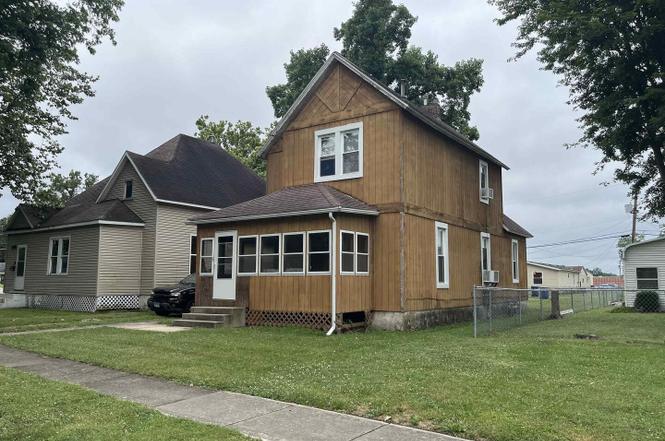
404 N Beech St · Centralia, IL
Flood risk 1/10 · Minimal
- FEMA flood zone
- X (unshaded)
- Chance of flooding over 30 yrs
- 0.0%
- Est. flood insurance / yr
- $473 – $860
Fire risk 1/10 · Minimal
- Est. fire insurance / yr
- $804 – $1,492
Heat risk 4/10 · Minor
- Hot days now (above 106°F)
- 7 days/yr
- Hot days in 30 yrs
- 20 days/yr
Wind risk 2/10 · Minimal
- Chance of severe wind over 30 yrs
- 2.0%
Air-quality risk 2/10 · Minimal
- Unhealthy air days now
- 1 days/yr
- Unhealthy air days in 30 yrs
- 1 days/yr
Risk factors via First Street. Map © Google.
Why this score? — see what drove the C+ grade
The composite is a weighted blend of 9 inputs, each scored 0–100. Each bar is that input's sub-score; the figure is the points it added to the 100-point composite (weight × sub-score).
- Cash flow +26.6/30.0
- DSCR +9.1/10.0
- 1% rule +8.3/10.0
- ARV discount +7.5/15.0
- Livability +3.4/5.0
- Rent growth +2.5/5.0
- Condition / age +2.5/5.0
- Schools +2.2/10.0
- Appreciation +0.0/10.0
$60,000
🖨 Deal sheet 📄 Offer letter ✓ Due diligence
Listing remarks
This duplex is furnished and both units are currently rented. Instant income for an investor! Or maybe you would like to live in one unit and rent the other? It would also be easy to convert this back into a single family home. Lots of possibilities!
Key facts
- 5,662 sq ft lot
- Built 1920
- Listed 180 days
Property features AI
Finance
- Other: Annual taxes listed (2024); Reported water/sewer expense and insurance expense
- Financial info: Gross income reported as $10,200
Exterior
- Parking: Parking lot
- Utilities: Public water; Public sewer; Cable available
- Home design: Two- to four-unit property; Over 100 years old; Built before 1978; Wood siding construction
- Construction: Wood siding; Historic/older construction (100+ years)
- Exterior features: Level lot; Lot dimensions approximately 36.5 x 151.75; Zoned SR-2
Interior
- Heating & cooling: Forced air heating; Natural gas heating
- Interior features: Partial basement
Neighborhood map
What this means for you Summary
Snapshot
- This is a other listed at $60k.
Deal economics
- At list price, monthly cash flow is $160 ($2k/yr) — positive.
- The deal already cash-flows at list — no discount required.
- Meets the 1% rule at list price ($800 rent vs $60k).
- Recommended offer: $53k (12.0% below list) — sets the bar for market timing.
- Cap rate 9.5% vs local median 5.8% in Centralia — top-decile yield for the area; either an underpriced asset or a hidden risk that comps aren't pricing in. Stress-test before assuming the spread holds.
Location & tenants
- Location reads 68/100 on livability (#481 in IL) — a middle-class / working-renter tenant base. Strengths: cost of living A+, housing A+, health & safety A+; Watch: schools D, crime F, amenities F.
- Centralia Hsd 200 (town): math 21% / reading 26% proficiency, ranked #668 of 919 in IL (top 73%) — low school quality limits family demand, transient renter base, plan for 1-2y turnover.
- Market conditions: 99 active listings in the ZIP; 1 comparable units currently listed for rent nearby; 2 units permitted in Marion County in 2024 (0 in 5+ unit buildings).
Forward outlook
- Local home prices are declining (-3.0%/yr); year-one equity from $415 of loan paydown is wiped out by about $2k of value loss. Plan a longer hold.
- Marion County population projected at -20% by 2050 — secular population decline; favor cash flow + early exit over multi-decade hold.
- At projected returns (-3.0% appreciation + 3.0% rent growth), your $17k cash investment doubles in ~10 years — after that, you're playing with house money.
Negotiation context
- It's been on market 180 days — a 12% lower offer ($53k) is reasonable based on typical stale-listing flexibility.
Risks & watch-outs
- Watch-outs: property tax is 2.6% of price; built in 1920 — expect roof / HVAC / electrical / plumbing capex.
Questions for the listing agent
- It's been on market 180 days. Have you received any prior offers? Is the seller open to a 12% concession, seller financing, or rate buy-down credit?
- Built in 1920 — when were the roof, HVAC, electrical panel, plumbing, and water heater last replaced?
- Property tax is high relative to price — has the assessment been appealed recently, and will the sale trigger a re-assessment?
- Why hasn't it sold? Are there any deal-killer items the seller is aware of (foundation, flood, title, zoning, code violations)?
- Is there a deadline driving the sale (1031 exchange, divorce, estate, relocation)? That informs how much negotiation room exists.
- Schools are D-rated, which usually means shorter tenancies and higher turnover. Who's the typical renter profile here, and what's been the actual vacancy rate?
- Crime grade is F in this area — have there been break-ins, vandalism, or insurance claims at this property in the last 3 years? What carrier currently insures it and at what premium?
- What's the average days-on-market for RENTAL listings here right now (not sales)? A rising rental-DOM trend means longer vacancies and softer asking-rent achievability than the comps imply.
- What's the recent tenant-quality profile in this submarket — average credit score on applications, eviction rate, late-payment / NSF rate, and stable-employment percentage? A property-management company in the area should have these aggregated.
- How much new for-sale + rental construction is in the pipeline within 1–3 miles? Heavy new supply typically softens prices + rents 12–24 months out; constrained supply supports both.
Investment metrics
- 1% rule
- 1.33% ✓
- Cap rate
- 9.50%
- Cash-on-cash
- 11.46%
- DSCR
- 1.51
- GRM
- 6.2
CMA / ARV
No comps found within radius.
Projected returns pro-forma
-3.0% appreciation · 3.0% rent growth · sell at horizon
- IRR
- 0.8%
- Equity multiple
- 1.03×
- Total profit
- $543
- Equity at exit
- $8,946
- IRR
- 10.5%
- Equity multiple
- 1.82×
- Total profit
- $13,822
- Equity at exit
- $5,188
Cash invested: $16,800 (down + closing). Projections, not guarantees.
Landlord ↔ Tenant lean methodology
- Overall (STATE)
- 43 Moderately Tenant-Leaning
- State Illinois
- 43 Moderately Tenant-Leaning · D+7
- County
- — inherits STATE
- City
- — inherits STATE
ZIP-level market 62801
- Home prices YoY
- -13.9%
- Active inventory
- 99
- Price-to-rent
- 6.2×
Monthly cashflow live
- Estimated rent
- $800 medium interval (Pro) →
- Mortgage (P&I)
- −$315
- Tax from tax record
- −$132 /mo · $1,583/yr
- Insurance
- −$25
- HOA
- −$0
- Vacancy / Maint / Mgmt
- −$168
- Net cashflow
- $160
Break-even live
UW: 25.0% down · 7.5% · 30yr · 1.5% tax · 5.0% vac · 8.0% maint · 8.0% mgmt
Financing live
Cash to close
- Down payment
- $15,000
- Closing costs
- $1,800
- Reserves months
- —
- Total cash needed
- —
Loan-product check · same deal, 3 products live
Conventional
25% down · 7.5% · 30yr
- Down + closing
- —
- Monthly P&I
- —
- Monthly cashflow
- —
- DSCR
- —
- Eligible?
- —
Personal DTI + credit; lowest rate.
DSCR
20% down · 8.5% · 30yr
- Down + closing
- —
- Monthly P&I
- —
- Monthly cashflow
- —
- DSCR
- —
- Eligible?
- —
No personal income docs; deal must DSCR.
Hard money
10% down · 12.0% · 12mo
- Down + closing
- —
- Monthly P&I
- —
- Monthly cashflow
- —
- DSCR
- —
- Eligible?
- —
Short-term bridge; refi at stabilization.
Rent comps 1 comps
| Address | Beds | Baths | Sqft | Rent | $/sqft | DOM | Units | Dist |
|---|---|---|---|---|---|---|---|---|
| 805 S Hickory St Centralia, IL | 3.0 | 2.0 | 1814 | $800 | $0.44 | 43d | 1 | 0.93mi |
Listing history 22 events
-
2026-06-18days on market $60,000 Active 180 DOM
-
2026-06-17days on market $60,000 Active 179 DOM
-
2026-06-16days on market $60,000 Active 178 DOM
-
2026-06-15days on market $60,000 Active 177 DOM
-
2026-06-13days on market $60,000 Active 175 DOM
-
2026-06-12days on market $60,000 Active 174 DOM
-
2026-06-09days on market $60,000 Active 171 DOM
-
2026-06-08days on market $60,000 Active 170 DOM
-
2026-06-07days on market $60,000 Active 169 DOM
-
2026-06-07days on market $60,000 Active 168 DOM
-
2026-06-04days on market $60,000 Active 165 DOM
-
2026-06-02days on market $60,000 Active 164 DOM
-
2026-06-01days on market $60,000 Active 163 DOM
-
2026-05-31days on market $60,000 Active 162 DOM
-
2026-05-31days on market $60,000 Active 161 DOM
-
2026-05-23historical
-
2026-05-22price
-
2026-04-09price
-
2026-01-08status Active
-
2026-01-06historical
-
2026-01-05historical
-
2025-07-22Active
ⓘ Source: listings_history table (triggers on properties + properties_extension) + one-shot
backfill from property_details.listing_events for pre-trigger history.
Tax reassessment forecast IL · Partial reset (capped growth)
- Current annual tax
- $1,583 · $132/mo
- Projected year-2 tax
- $1,583 · $132/mo
- Expected delta
- $0/yr ($0/mo · 0.0%)
ⓘ Screening estimate from a state-policy table — verify with the county assessor before closing.
Climate risk First Street
- Flood 1/10 Low FEMA zone X (unshaded) · 0% chance over 30 yrs
- Wildfire 1/10 Low
- Heat 4/10 Moderate 7 d/yr ≥106°F today · 20 d/yr by 30 yrs out
- Wind 2/10 Low 2% chance of damaging wind over 30 yrs
- Air quality 2/10 Low 1 unhealthy d/yr today · 1 by 30 yrs out
Nearby sold comps map
Loading sold comps map…
Walkable amenities ~0.75 mi
Loading nearby amenities…
Taxation est. · year 1
- Rental income
- $9,600
- − Mortgage interest
- −$3,361
- − Property taxes
- −$1,583
- − Insurance
- −$300
- − Repairs & maintenance
- −$768
- − Management
- −$768
- − Depreciation
- −$1,745
- Taxable income
- $1,075
- Est. tax owed @ 24.0%
- −$258
- After-tax cash flow
- $1,667/yr
For passive investors: Depreciation is non-cash, so a rental often shows a tax loss while cash-flowing — sheltering income. Rental losses are passive: they offset passive income freely, and up to $25,000/yr can offset ordinary (W-2) income if you actively participate and your MAGI is under $100k (phasing out to $0 by $150k); unused losses carry forward. On sale, claimed depreciation is recaptured at up to 25%, and gains may owe capital-gains tax (a 1031 exchange can defer both). Figures are a year-1 estimate at your 24.0% rate — not tax advice; consult a CPA.
Schools (NCES district)
- District
- Centralia Hsd 200
- NCES district ID
- 1709300
- Math proficiency
- 21% ▲ 6.00%
- Reading proficiency
- 26% ▲ 1.00%
- Median HH income
- $34,555
- Composite
- 22.43/100
- National rank
- #13470
- State rank
- #668 of 919 in IL
Livability — Centralia
- Score
- 68/100
- State rank
- #481
- US rank
- #9987
Category grades
Schools grade is shown separately in the Schools card above.
Census & demographics
- Census place
- Centralia, IL
- City population
- 19,941
- Population (ZIP)
- 19,941
Population outlook (Marion County) Hauer SSP2
- Today (2025)
- 36,071 people
- By 2030
- 34,598 · -4.1%
- By 2040
- 31,754 · -12.0%
- By 2050
- 28,912 · -19.8%
- By 2075
- 22,527 · -37.5%
- By 2100
- 16,455 · -54.4%
Race, ethnicity, and origin ACS 2023
- Neighborhood character
- Predominantly White (81%)
- Race & ethnicity
- White 81% Black 11% Two or more races 4% Hispanic / Latino 4% Asian 1%
- Common ancestry
- Serbian 2% Romanian 2% Lithuanian 1%
- Foreign-born
- 3% · Canada, China
- Languages at home
- 96% English-only · Spanish 2%
Political lean MEDSL · Marion
- 2024 margin
- Solid R (+49.5) · D 24.6% · R 74.1% · Other 1.4%
- 2008→2024 swing
- -47.5pp toward R · 2008: -2.0pp · 2024: -49.5pp
- All cycles
- 2024: R+49.5 2020: R+46.6 2016: R+44.9 2012: R+19.2 2008: R+2.0
Not yet ingested
- Civics
- —
Market trends
- HPI YoY
- ▼ -34.12%
- Current HPI
- 211.3835
- Rent YoY
- —
- Metro
- —
- State GDP YoY
- ▲ 1.59%
- F500 in state
- 60
Industry mix (Fortune 500 HQ in IL)
| Industry | F500 HQs | Revenue |
|---|---|---|
| Insurance | 4 | $201B |
|
||
| Consumer Goods | 4 | $87B |
|
||
| Industrial Machinery | 3 | $64B |
|
||
| Healthcare | 2 | $55B |
|
||
| Retail / Pharmacy | 1 | $148B |
|
||
| Agriculture / Food | 1 | $86B |
|
||
Property tax history
+2.4%/yrLatest (2024): $1,583 · +0.2% YoY. Source: county tax records.
Cash-flow waterfall
monthlySold comps — $/sqft
last 12 mo · ≤1 miLoading sold comps…