 Multi-family
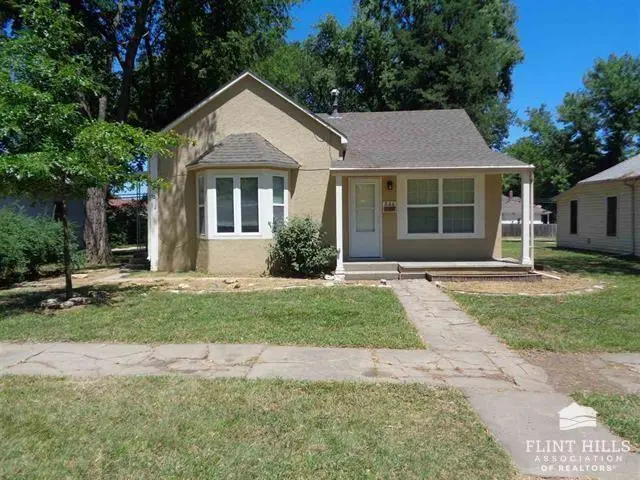
526 W 4th St · Junction City, KS
Flood risk 1/10 · Minimal
- FEMA flood zone
- X (unshaded)
- Chance of flooding over 30 yrs
- 0.0%
- Est. flood insurance / yr
- $507 – $1,088
Fire risk 5/10 · Moderate
- Est. fire insurance / yr
- $1,154 – $2,142
Heat risk 4/10 · Minor
- Hot days now (above 107°F)
- 7 days/yr
- Hot days in 30 yrs
- 16 days/yr
Wind risk 2/10 · Minimal
- Chance of severe wind over 30 yrs
- —
Air-quality risk 3/10 · Minor
- Unhealthy air days now
- 2 days/yr
- Unhealthy air days in 30 yrs
- 3 days/yr
Risk factors via First Street. Map © Google.
Why this score? — see what drove the B grade
The composite is a weighted blend of 9 inputs, each scored 0–100. Each bar is that input's sub-score; the figure is the points it added to the 100-point composite (weight × sub-score).
- Cash flow +30.0/30.0
- 1% rule +10.0/10.0
- DSCR +10.0/10.0
- ARV discount +7.5/15.0
- Rent growth +4.0/5.0
- Livability +3.3/5.0
- Schools +3.0/10.0
- Condition / age +2.5/5.0
- Appreciation +0.0/10.0
$114,900
🖨 Deal sheet 📄 Offer letter ✓ Due diligence
Multi-family units
County records classify this as Multi-Family (5+ Unit). Listing-text estimate: 1 unit. estimate disagrees with records
5+ unit building — per-unit beds/baths from public records are typically unavailable; the breakdown below (if shown) is an estimate from the listing text.
Listing remarks MLS
A great investment opportunity in the heart of Junction City presented by Tricia Stalder with Mathis Lueker Real Estate. Wonderfully maintained duplex, each side is 1 bedroom and 1 bath. Both units are currently leased. Call or text Tricia today to schedule your showing 785.307.6587.
Key facts
- 6,534 sq ft lot
- Built 1930
- Listed 6 days
Property features AI
Finance
- Financial info: Unit rents: one unit rented for $760, the other for $575
Exterior
- Parking: Other parking
- Utilities: Public water; Public sewer
- Home design: Residential income property; duplex (both sides)
- Construction: Asphalt roof; Construction materials: Unknown
- Exterior features: Fenced (type: other); No pool
Interior
- Kitchen: Each unit includes a range and refrigerator
- Bedrooms: Two 1-bedroom units (each unit listed with its bedroom count)
- Bathrooms: Two full bathrooms (one in each unit)
- Heating & cooling: Central air; Window unit(s); Natural gas heating; Wall furnace
- Interior features: No fireplace; Crawl space basement
- Laundry & utility: Tenant pays electric and gas; owner pays water
Neighborhood map
What this means for you Summary
Snapshot
- This is a 2-bed/2.0-bath multifamily listed at $115k.
Deal economics
- At list price, monthly cash flow is $791 ($9k/yr) — positive.
- The deal already cash-flows at list — no discount required.
- Meets the 1% rule at list price ($2k rent vs $115k).
Location & tenants
- Location reads 66/100 on livability (#266 in KS) — a middle-class / working-renter tenant base. Strengths: cost of living A+, housing A+, health & safety A+; Watch: schools D+, crime F, amenities F.
- Geary County Schools (town): math 32% / reading 39% proficiency, ranked #60 of 169 in KS (top 36%) — families likely to look elsewhere, expect single-tenant / working-renter base with shorter leases.
- Market conditions: Rents rising fast (+6.0%/yr); 260 active listings in the ZIP; 93 units permitted in Geary County in 2024 (0 in 5+ unit buildings).
- This rent runs 40% of the median local income ($60k/yr) — at the standard rent-burdened threshold; future hikes will face affordability resistance.
Forward outlook
- Local home prices are declining (-3.0%/yr); year-one equity from $794 of loan paydown is wiped out by about $3k of value loss. Plan a longer hold.
- Geary County population projected at +8% by 2050 — modest demand growth; plan on rents tracking national, not racing it.
- At projected returns (-3.0% appreciation + 6.0% rent growth), your $32k cash investment doubles in ~4 years — after that, you're playing with house money.
Negotiation context
- Only 7 days on market — expect competitive offers; lowballing is unlikely to land.
- 6 sale attempts since 7y ago with the ask held roughly flat each time — persistent listings suggest the price (not the market) is what's stuck; bring a comps-based counter.
- Current owner paid $44k; list at $115k implies a 161% gain — meaningful room to come down on a strong offer.
Risks & watch-outs
- Watch-outs: built in 1930 — expect roof / HVAC / electrical / plumbing capex.
- Climate carrying-cost: moderate wildfire risk — expect insurance premiums to compound above CPI over the hold.
Questions for the listing agent
- Built in 1930 — when were the roof, HVAC, electrical panel, plumbing, and water heater last replaced?
- Is there a deadline driving the sale (1031 exchange, divorce, estate, relocation)? That informs how much negotiation room exists.
- Schools are D-rated, which usually means shorter tenancies and higher turnover. Who's the typical renter profile here, and what's been the actual vacancy rate?
- Crime grade is F in this area — have there been break-ins, vandalism, or insurance claims at this property in the last 3 years? What carrier currently insures it and at what premium?
- What's the average days-on-market for RENTAL listings here right now (not sales)? A rising rental-DOM trend means longer vacancies and softer asking-rent achievability than the comps imply.
- What's the recent tenant-quality profile in this submarket — average credit score on applications, eviction rate, late-payment / NSF rate, and stable-employment percentage? A property-management company in the area should have these aggregated.
- How much new apartment / multifamily construction is in the pipeline within 1–3 miles? Heavy new supply (>2% of stock underway) typically softens rents 12–24 months out; light construction supports rent growth.
Investment metrics
- 1% rule
- 1.73% ✓
- Cap rate
- 14.55%
- Cash-on-cash
- 29.49%
- DSCR
- 2.31
- GRM
- 4.8
CMA / ARV
No comps found within radius.
Projected returns pro-forma
-3.0% appreciation · 6.05% rent growth · sell at horizon
- IRR
- 27.4%
- Equity multiple
- 2.18×
- Total profit
- $38,041
- Equity at exit
- $17,132
- IRR
- 36.7%
- Equity multiple
- 4.90×
- Total profit
- $125,482
- Equity at exit
- $9,934
Cash invested: $32,172 (down + closing). Projections, not guarantees.
Landlord ↔ Tenant lean methodology
- Overall (STATE)
- 83 Strongly Landlord-Friendly
- State Kansas
- 83 Strongly Landlord-Friendly · R+10
- County
- — inherits STATE
- City
- — inherits STATE
ZIP-level market 66441
- Rents YoY
- 6.0%
- Active inventory
- 260
- Price-to-rent
- 9.6×
Monthly cashflow live
- Estimated rent
- $1,985 medium interval (Pro) →
- Mortgage (P&I)
- −$603
- Tax from tax record
- −$127 /mo · $1,524/yr
- Insurance
- −$48
- HOA
- −$0
- Vacancy / Maint / Mgmt
- −$417
- Net cashflow
- $791
Break-even live
2-unit breakdown (identical units grouped — click to expand)
| Units | Beds | Baths | Est. rent |
|---|---|---|---|
| 2× units | 1 | 1 | $1,986 |
| #1 | 1 | 1 | $993 |
| #2 | 1 | 1 | $993 |
| Total (2 units) | $1,985 | ||
UW: 25.0% down · 7.5% · 30yr · 1.5% tax · 5.0% vac · 8.0% maint · 8.0% mgmt
Financing live
Cash to close
- Down payment
- $28,725
- Closing costs
- $3,447
- Reserves months
- —
- Total cash needed
- —
Loan-product check · same deal, 3 products live
Conventional
25% down · 7.5% · 30yr
- Down + closing
- —
- Monthly P&I
- —
- Monthly cashflow
- —
- DSCR
- —
- Eligible?
- —
Personal DTI + credit; lowest rate.
DSCR
20% down · 8.5% · 30yr
- Down + closing
- —
- Monthly P&I
- —
- Monthly cashflow
- —
- DSCR
- —
- Eligible?
- —
No personal income docs; deal must DSCR.
Hard money
10% down · 12.0% · 12mo
- Down + closing
- —
- Monthly P&I
- —
- Monthly cashflow
- —
- DSCR
- —
- Eligible?
- —
Short-term bridge; refi at stabilization.
Listing history 6 events
-
2026-06-19days on market $114,900 Active 7 DOM
-
2026-06-18days on market $114,900 Active 6 DOM
-
2026-06-17days on market $114,900 Active 5 DOM
-
2026-06-16days on market $114,900 Active 4 DOM
-
2026-06-15days on market $114,900 Active 3 DOM
-
2026-06-13$114,900 Active 1 DOM
ⓘ Source: listings_history table (triggers on properties + properties_extension) + one-shot
backfill from property_details.listing_events for pre-trigger history.
Tax reassessment forecast KS · Resets to sale price
- Current annual tax
- $1,524 · $127/mo
- Projected year-2 tax
- $1,620 · $135/mo
- Expected delta
- +$96/yr (+$8/mo · 6.3%)
ⓘ Screening estimate from a state-policy table — verify with the county assessor before closing.
Climate risk First Street
- Flood 1/10 Low FEMA zone X (unshaded) · 0% chance over 30 yrs
- Wildfire 5/10 Major
- Heat 4/10 Moderate 7 d/yr ≥107°F today · 16 d/yr by 30 yrs out
- Wind 2/10 Low
- Air quality 3/10 Moderate 2 unhealthy d/yr today · 3 by 30 yrs out
Nearby sold comps map
Loading sold comps map…
Walkable amenities ~0.75 mi
Loading nearby amenities…
Taxation est. · year 1
- Rental income
- $23,820
- − Mortgage interest
- −$6,436
- − Property taxes
- −$1,524
- − Insurance
- −$574
- − Repairs & maintenance
- −$1,906
- − Management
- −$1,906
- − Depreciation
- −$3,343
- Taxable income
- $8,132
- Est. tax owed @ 24.0%
- −$1,952
- After-tax cash flow
- $7,537/yr
For passive investors: Depreciation is non-cash, so a rental often shows a tax loss while cash-flowing — sheltering income. Rental losses are passive: they offset passive income freely, and up to $25,000/yr can offset ordinary (W-2) income if you actively participate and your MAGI is under $100k (phasing out to $0 by $150k); unused losses carry forward. On sale, claimed depreciation is recaptured at up to 25%, and gains may owe capital-gains tax (a 1031 exchange can defer both). Figures are a year-1 estimate at your 24.0% rate — not tax advice; consult a CPA.
Schools (NCES district)
- District
- Geary County Schools
- NCES district ID
- 2007890
- Math proficiency
- 32% ▲ 1.00%
- Reading proficiency
- 39% ▲ 2.00%
- Median HH income
- $44,319
- Composite
- 30.2/100
- National rank
- #6306
- State rank
- #60 of 169 in KS
Livability — Junction City
- Score
- 66/100
- State rank
- #266
- US rank
- #11965
Category grades
Schools grade is shown separately in the Schools card above.
Census & demographics
- Census place
- Junction City, KS
- County
- Geary County · 25,828 people
- City population
- 25,828
- Metro
- Manhattan, KS
- Population (ZIP)
- 25,828
- Household income
- $59,522
- Rent vs Own
- Severe rent burden
- 950.0
Population outlook (Geary County) Hauer SSP2
- Today (2025)
- 37,364 people
- By 2030
- 38,234 · +2.3%
- By 2040
- 39,727 · +6.3%
- By 2050
- 40,314 · +7.9%
- By 2075
- 44,283 · +18.5%
- By 2100
- 46,935 · +25.6%
Race, ethnicity, and origin ACS 2023
- Neighborhood character
- Diverse neighborhood (Simpson 0.66)
- Race & ethnicity
- White 53% Black 19% Two or more races 15% Hispanic / Latino 15% Asian 3%
- Hispanic origin (detail)
- Mexican 8% Puerto Rican 4%
- Common ancestry
- Lithuanian 3% Italian 2% Portuguese 2%
- Foreign-born
- 8% · Canada, South Korea, Vietnam
- Languages at home
- 85% English-only · Spanish 9% German/W. Germanic 1% Korean 1%
Political lean MEDSL · Geary
- 2024 margin
- R (+17.6) · D 40.1% · R 57.7% · Other 2.2%
- 2008→2024 swing
- -5.2pp toward R · 2008: -12.4pp · 2024: -17.6pp
- All cycles
- 2024: R+17.6 2020: R+14.7 2016: R+21.7 2012: R+14.4 2008: R+12.4
Not yet ingested
- Civics
- —
Market trends
- HPI YoY
- ▼ -152.25%
- Current HPI
- 137.9936
- Rent YoY
- ▲ 6.05%
- Metro
- Manhattan, KS
- State GDP YoY
- —
- F500 in state
- 0
Price history
+161.1% since first listed13 events — show timeline
- 2026-06-11 Listed $114,900 FHAOR as distributed by MLS GRID
- 2026-04-05 Rental Removed $700 APPFOLIO
- 2026-03-12 Listed for Rent $700 APPFOLIO
- 2025-03-06 Rental Removed $700 APPFOLIO
- 2025-02-27 Listed for Rent $700 APPFOLIO
- 2023-08-20 Rental Removed $650 APPFOLIO
- 2023-07-22 Listed for Rent $650 APPFOLIO
- 2023-03-31 Sold (MLS) — FHAOR as distributed by MLS GRID
- 2023-01-17 Pending — FHAOR as distributed by MLS GRID
- 2022-11-23 Listed $89,000 FHAOR as distributed by MLS GRID
- 2020-04-17 Sold (MLS) — FHAOR as distributed by MLS GRID
- 2019-07-26 Listed $69,000 FHAOR as distributed by MLS GRID
- 2008-05-01 Sold (Public Records) $44,000 Public Records
Property tax history
+2.7%/yrLatest (2025): $1,524 · +9.0% YoY. Source: county tax records.
Cash-flow waterfall
monthlySold comps — $/sqft
last 12 mo · ≤1 miLoading sold comps…