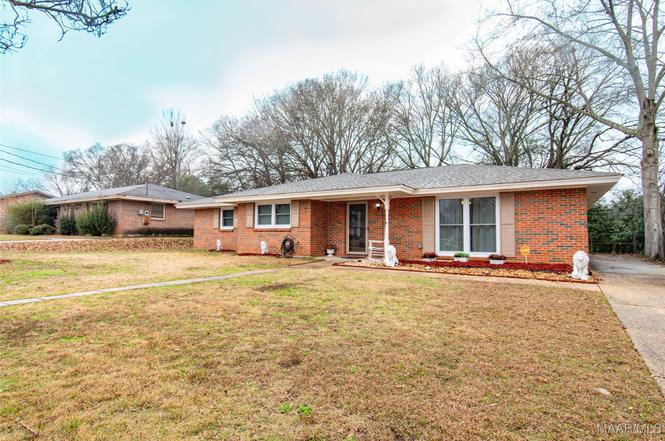
233 Vanderbilt Loop W · Montgomery, AL
Flood risk 1/10 · Minimal
- FEMA flood zone
- X (unshaded)
- Chance of flooding over 30 yrs
- 0.0%
- Est. flood insurance / yr
- $507 – $1,088
Fire risk 1/10 · Minimal
- Est. fire insurance / yr
- $916 – $1,700
Heat risk 8/10 · Major
- Hot days now (above 107°F)
- 7 days/yr
- Hot days in 30 yrs
- 20 days/yr
Wind risk 8/10 · Major
- Chance of severe wind over 30 yrs
- 80.0%
Air-quality risk 4/10 · Minor
- Unhealthy air days now
- 4 days/yr
- Unhealthy air days in 30 yrs
- 5 days/yr
Risk factors via First Street. Map © Google.
Why this score? — see what drove the D grade
The composite is a weighted blend of 9 inputs, each scored 0–100. Each bar is that input's sub-score; the figure is the points it added to the 100-point composite (weight × sub-score).
- Cash flow +14.2/30.0
- ARV discount +8.5/15.0
- DSCR +4.3/10.0
- Rent growth +3.2/5.0
- Livability +3.2/5.0
- 1% rule +2.7/10.0
- Condition / age +2.5/5.0
- Schools +1.7/10.0
- Appreciation +0.0/10.0
$190,000
🖨 Deal sheet (PDF) 📄 Offer letter ✓ Due diligence
Listing remarks
4th SPACE flexible- office, playroom, home gym, or guest space just off the laundry room. MOVE IN READY!! Enjoy peace of mind in this well-kept and upgraded operating systems--New roof (2023), HVAC (2022), New windows (2024), & newer front door. The eat-in kitchen features granite countertops, a gas stove. No carpet here!! Wood flooring or hard tile runs throughout, and both bathrooms are equipped with vanities and upgraded dual-flush toilets. Relax or entertain on the back screened porch, while the fully fenced backyard includes 2 detached storage buildings and plenty of room for kids and/or pets to play. 6 mounted T. V's, Washer, dryer, kitchen refrigerator and laundry refrigerator
Key facts
- New hvac
- New refrigerator
- New front door
Tags
Property features AI
Exterior
- Parking: Driveway
- Utilities: Public water; Public sewer; Electricity available; Natural gas available; Cable available; High-speed internet available
- Home design: Single-story home; Brick construction; Slab foundation; Level lot; City lot (75 x 135)
- Construction: Built per public records; Brick construction; Slab foundation
- Exterior features: Covered patio; Enclosed patio; Fully fenced yard; Storage structure
Interior
- Kitchen: Kitchen/dining combo; Dishwasher; Gas range; Microwave; Refrigerator
- Bedrooms: Two first-floor bedrooms
- Flooring: Laminate
- Bathrooms: Two full bathrooms (first floor)
- Heating & cooling: Heat pump; Ceiling fans
- Interior features: Window treatments; Laminate flooring
- Laundry & utility: First-floor laundry with washer and dryer hookups; Washer; Dryer; Gas water heater
Neighborhood map
What this means for you Summary
Snapshot
- This is a 3-bed/2.0-bath single-family listed at $190k.
Deal economics
- At list price, monthly cash flow is $31 ($372/yr) — positive.
- The deal already cash-flows at list — no discount required.
- To meet the 1% rule (rent ≥ 1% of price), the offer needs to be $147k (22.7% below list).
- Recommended offer: $147k (22.7% below list) — sets the bar for 1% rule.
Location & tenants
- Location reads 65/100 on livability (#138 in AL) — a middle-class / working-renter tenant base. Strengths: cost of living A+, housing A+; Watch: schools C-, employment D, crime F.
- Montgomery County (urban): math 9% / reading 31% proficiency, ranked #106 of 129 in AL (top 82%) — low school quality limits family demand, transient renter base, plan for 1-2y turnover; 70% free/reduced lunch — lower-income household profile, screen leases tightly.
- Market conditions: Rents rising (+2.6%/yr); 209 active listings in the ZIP; 29 comparable units currently listed for rent nearby; rentals at typical pace (median 22d on market — plan ~3-4 weeks tenant-placement turnaround); 48% of comp listings sitting > 30 days — soft ceiling on asking rent; 460 units permitted in Montgomery County in 2024 (37 in 5+ unit buildings).
Forward outlook
- Local home prices are declining (-3.0%/yr); year-one equity from $1k of loan paydown is wiped out by about $6k of value loss. Plan a longer hold.
- Montgomery County population projected to shrink 8% by 2050 — rents likely to lag national; underwrite the cash flow, not the appreciation.
Negotiation context
- It's been on market 140 days — a 12% lower offer ($167k) is reasonable based on typical stale-listing flexibility.
- 4 sale attempts since 3y ago with the ask held roughly flat each time — persistent listings suggest the price (not the market) is what's stuck; bring a comps-based counter.
Risks & watch-outs
- Climate carrying-cost: severe wind risk, 80% chance of damaging wind over 30y; extreme-heat days projected 7→20/yr by 2055 (HVAC capex compounding) — expect insurance premiums to compound above CPI over the hold.
Questions for the listing agent
- It's been on market 140 days. Have you received any prior offers? Is the seller open to a 23% concession, seller financing, or rate buy-down credit?
- Built in 1972 — when were the roof, HVAC, electrical panel, plumbing, and water heater last replaced?
- Why hasn't it sold? Are there any deal-killer items the seller is aware of (foundation, flood, title, zoning, code violations)?
- Is there a deadline driving the sale (1031 exchange, divorce, estate, relocation)? That informs how much negotiation room exists.
- Crime grade is F in this area — have there been break-ins, vandalism, or insurance claims at this property in the last 3 years? What carrier currently insures it and at what premium?
- The area grade is low — what's the realistic commute time and amenity access for the typical tenant pool here? Any planned neighborhood developments (good or bad) we should know about?
- What's the average days-on-market for RENTAL listings here right now (not sales)? A rising rental-DOM trend means longer vacancies and softer asking-rent achievability than the comps imply.
- What's the recent tenant-quality profile in this submarket — average credit score on applications, eviction rate, late-payment / NSF rate, and stable-employment percentage? A property-management company in the area should have these aggregated.
- How much new for-sale + rental construction is in the pipeline within 1–3 miles? Heavy new supply typically softens prices + rents 12–24 months out; constrained supply supports both.
Investment metrics
- 1% rule
- 0.77% ✗
- Cap rate
- 6.49%
- Cash-on-cash
- 0.70%
- DSCR
- 1.03
- GRM
- 10.8
CMA / ARV
- ARV (on-the-fly)
- $194,464
- Comps found
- 12
Show comp detail 12 sales within ~0.75 mi
| Address | Dist | Beds/Ba | Sqft | Sold | Price | $/sf | Match |
|---|---|---|---|---|---|---|---|
| 233 Vanderbilt Loop W | 0.00mi | 3/2.0 | 1,775 (+8%) | 0mo | $190,000 | $107 | 87 |
| 4515 Ray Dr | 0.43mi | 3/2.0 | 1,676 (+2%) | 3mo | $201,000 | $120 | 75 |
| 356 Avon Rd | 0.51mi | 3/2.0 | 1,652 (+0%) | 3mo | $195,000 | $118 | 73 |
| 4208 Johnstown Dr | 0.55mi | 3/2.0 | 1,604 (-3%) | 3mo | $204,900 | $128 | 68 |
| 4329 Florence St | 0.62mi | 3/2.0 | 1,684 (+2%) | 3mo | $160,000 | $95 | 65 |
| 708 Maryethel Dr | 0.62mi | 4/2.0 (+1) | 1,616 (-2%) | 1mo | $178,000 | $110 | 62 |
| 408 Glade Park Dr | 0.64mi | 3/2.0 | 1,579 (-4%) | 4mo | $168,000 | $106 | 60 |
| 4309 Salinas Ct | 0.69mi | 4/2.0 (+1) | 1,610 (-2%) | 2mo | $179,900 | $112 | 58 |
| 737 Ledyard Pl | 0.75mi | 3/2.0 | 1,752 (+6%) | 2mo | $217,000 | $124 | 53 |
| 230 Kiefer Dr | 0.43mi | 3/2.0 | 1,400 (-15%) | 3mo | $167,000 | $119 | 53 |
| 429 Avon Rd | 0.59mi | 3/2.0 | 1,447 (-12%) | 2mo | $160,000 | $111 | 51 |
| 701 Ledyard Pl | 0.67mi | 4/2.0 (+1) | 1,782 (+8%) | 3mo | $239,000 | $134 | 48 |
Match score weights: distance 35% · size 25% · config 20% · recency 20%. Top-matched comps best support the ARV.
Projected returns pro-forma
-3.0% appreciation · 2.65% rent growth · sell at horizon
- IRR
- -15.6%
- Equity multiple
- 0.45×
- Total profit
- $-29,420
- Equity at exit
- $28,330
- IRR
- -7.7%
- Equity multiple
- 0.52×
- Total profit
- $-25,545
- Equity at exit
- $16,428
Cash invested: $53,200 (down + closing). Projections, not guarantees.
Landlord ↔ Tenant lean methodology
- Overall (STATE)
- 90 Strongly Landlord-Friendly
- State Alabama
- 90 Strongly Landlord-Friendly · R+15
- County
- — inherits STATE
- City
- — inherits STATE
ZIP-level market 36109
- Home prices YoY
- -20.1%
- Rents YoY
- 2.6%
- Active inventory
- 209
- Price-to-rent
- 10.8×
Monthly cashflow live
- Estimated rent
- $1,468 high interval (Pro) →
- Mortgage (P&I)
- −$996
- Tax from tax record
- −$53 /mo · $636/yr
- Insurance
- −$79
- HOA
- −$0
- Vacancy / Maint / Mgmt
- −$308
- Net cashflow
- $31
Break-even live
Sensitivity live
| Price | -10% $139 | -5% $85 | +0% $31 | +5% $-23 | +10% $-77 |
|---|---|---|---|---|---|
| Rent | -10% $-85 | -5% $-27 | +0% $31 | +5% $89 | +10% $147 |
| Rate | -1.0pp $127 | -0.5pp $79 | base $31 | +0.5pp $-18 | +1.0pp $-68 |
UW: 25.0% down · 7.5% · 30yr · 1.5% tax · 5.0% vac · 8.0% maint · 8.0% mgmt
Financing live
Cash to close
- Down payment
- $47,500
- Closing costs
- $5,700
- Reserves months
- —
- Total cash needed
- —
Loan-product check · same deal, 3 products live
Conventional
25% down · 7.5% · 30yr
- Down + closing
- —
- Monthly P&I
- —
- Monthly cashflow
- —
- DSCR
- —
- Eligible?
- —
Personal DTI + credit; lowest rate.
DSCR
20% down · 8.5% · 30yr
- Down + closing
- —
- Monthly P&I
- —
- Monthly cashflow
- —
- DSCR
- —
- Eligible?
- —
No personal income docs; deal must DSCR.
Hard money
10% down · 12.0% · 12mo
- Down + closing
- —
- Monthly P&I
- —
- Monthly cashflow
- —
- DSCR
- —
- Eligible?
- —
Short-term bridge; refi at stabilization.
Rent comps 29 comps
| Address | Beds | Baths | Sqft | Rent | $/sqft | DOM | Units | Dist |
|---|---|---|---|---|---|---|---|---|
| 4536 Wake Forest Dr Montgomery, AL | 3.0 | 2.0 | 1244 | $1,250 | $1.00 | 45d | 1 | 0.12mi |
| 4365 Hillside Oaks Montgomery, AL | 2.0 | 2.0 | 1204 | $1,500 | $1.25 | 45d | 1 | 0.53mi |
| 538 Hollow Wood Rd Montgomery, AL | 2.0 | 2.0 | 1053 | $1,100 | $1.04 | 45d | 1 | 0.54mi |
| 564 Glade Park Loop Unit 1043856P Montgomery, AL | 4.0 | 2.0 | 1496 | $2,736 | $1.83 | 15d | 1 | 0.84mi |
| 633 Groveland Dr Montgomery, AL | 3.0 | 2.0 | 1424 | $1,200 | $0.84 | 45d | 1 | 0.95mi |
| 605 Plantation Way Montgomery, AL | 4.0 | 2.0 | 1519 | $1,200 | $0.79 | 22d | 1 | 0.97mi |
| 336 Davors Dr Montgomery, AL | 3.0 | 2.0 | 1569 | $2,200 | $1.40 | 45d | 1 | 0.97mi |
| 516 Lawndale Ln Montgomery, AL | 3.0 | 1.0 | 1125 | $1,150 | $1.02 | 45d | 1 | 1.00mi |
| 535 Lawndale Ln Montgomery, AL | 4.0 | 1.5 | 1260 | $1,100 | $0.87 | 15d | 1 | 1.04mi |
| 3944 Johnstown Dr Montgomery, AL | 3.0 | 2.0 | 1912 | $1,275 | $0.67 | 45d | 1 | 1.06mi |
| 4056 Wares Ferry Rd Montgomery, AL | 3.0 | 2.0 | 1800 | $1,500 | $0.83 | 15d | 1 | 1.08mi |
| 4046 Camellia Dr Unit 1 Montgomery, AL | 3.0 | 2.0 | 1500 | $1,200 | $0.80 | 45d | 1 | 1.09mi |
| 203 Eastdale Rd S Montgomery, AL | 1.0–3.0 | 1.0–2.0 | 931 | $1,290 | $1.39 | 15d | 13 | 1.16mi |
| 5712 Roxboro Dr Montgomery, AL | 4.0 | 2.0 | 1544 | $1,450 | $0.94 | 22d | 1 | 1.22mi |
| 4023 Ware Hill Dr Unit 1507324P Montgomery, AL | 2.0 | 2.0 | 1420 | $4,076 | $2.87 | 15d | 1 | 1.26mi |
| 560 Farmington Rd Montgomery, AL | 4.0 | 2.0 | 2161 | $1,695 | $0.78 | 15d | 1 | 1.33mi |
| 5926 Carmel Dr Montgomery, AL | 3.0 | 2.0 | 1158 | $1,200 | $1.04 | 45d | 1 | 1.33mi |
| 455 Eastdale Rd S Montgomery, AL | 1.0–2.0 | 1.0 | 950 | $850 | $0.89 | 15d | 6 | 1.34mi |
| 572 Farmington Rd Montgomery, AL | 3.0 | 2.0 | 2106 | $1,495 | $0.71 | 45d | 1 | 1.36mi |
| 713 Amity Ln Montgomery, AL | 4.0 | 2.0 | 1696 | $1,900 | $1.12 | 45d | 1 | 1.36mi |
| 107 Dalraida Rd Unit A Montgomery, AL | 3.0 | 2.0 | 1237 | $1,200 | $0.97 | 45d | 1 | 1.39mi |
| 500 Eastdale Rd S Montgomery, AL | 1.0–3.0 | 1.0–2.5 | 1042 | $900 | $0.86 | 22d | 20 | 1.40mi |
| 728 Amity Ln Montgomery, AL | 4.0 | 2.0 | 1218 | $1,700 | $1.40 | 15d | 1 | 1.41mi |
| 323 N Burbank Dr Montgomery, AL | 4.0 | 2.0 | 1584 | $1,381 | $0.87 | 15d | 1 | 1.45mi |
| 3760 Dalraida Pkwy Montgomery, AL | 4.0 | 2.5 | 1900 | $1,850 | $0.97 | 45d | 1 | 1.45mi |
| 3806 Marie Cook Dr Montgomery, AL | 3.0 | 2.0 | 1791 | $1,675 | $0.94 | 15d | 1 | 1.45mi |
| 6320 Burbank Crossing Loop Montgomery, AL | 3.0 | 2.0 | 1238 | $1,600 | $1.29 | 45d | 1 | 1.47mi |
| 3692 Fairfield Dr Montgomery, AL | 3.0 | 2.0 | 1524 | $1,400 | $0.92 | 22d | 1 | 1.49mi |
| 5701 E Shirley Ln Montgomery, AL | 1.0–2.0 | 1.0 | 975 | $850 | $0.87 | 15d | 7 | 1.49mi |
Listing history 20 events
-
2026-06-13statusdays on market $190,000 Pending 140 DOM
-
2026-06-10days on market $190,000 Contingent 138 DOM
-
2026-06-09days on market $190,000 Contingent 137 DOM
-
2026-06-08days on market $190,000 Contingent 136 DOM
-
2026-06-07days on market $190,000 Contingent 135 DOM
-
2026-06-03days on market $190,000 Contingent 131 DOM
-
2026-06-02days on market $190,000 Contingent 130 DOM
-
2026-06-01days on market $190,000 Contingent 129 DOM
-
2026-05-31days on market $190,000 Contingent 128 DOM
-
2026-05-30days on market $190,000 Contingent 127 DOM
-
2026-04-05historical Contingent
-
2026-01-23$190,000 Active
-
2025-12-02price $195,000
-
2025-11-19$205,000 Active
-
2025-11-06$205,000 Active
-
2023-03-03soldstatus $169,900 Closed
-
2023-03-03soldstatus $169,900
-
2023-02-15status Pending
-
2023-02-06historical Contingent
-
2023-01-31$169,900 Active
ⓘ Source: listings_history table (triggers on properties + properties_extension) + one-shot
backfill from property_details.listing_events for pre-trigger history.
Tax reassessment forecast AL · Resets to sale price
- Current annual tax
- $636 · $53/mo
- Projected year-2 tax
- $779 · $65/mo
- Expected delta
- +$143/yr (+$12/mo · 22.5%)
ⓘ Screening estimate from a state-policy table — verify with the county assessor before closing.
Climate risk First Street
- Flood 1/10 Low FEMA zone X (unshaded) · 0% chance over 30 yrs
- Wildfire 1/10 Low
- Heat 8/10 Severe 7 d/yr ≥107°F today · 20 d/yr by 30 yrs out
- Wind 8/10 Severe 80% chance of damaging wind over 30 yrs
- Air quality 4/10 Moderate 4 unhealthy d/yr today · 5 by 30 yrs out
Nearby sold comps map
Loading sold comps map…
Walkable amenities ~0.75 mi
Loading nearby amenities…
Taxation est. · year 1
- Rental income
- $17,613
- − Mortgage interest
- −$10,643
- − Property taxes
- −$636
- − Insurance
- −$950
- − Repairs & maintenance
- −$1,409
- − Management
- −$1,409
- − Depreciation
- −$5,527
- Taxable loss
- −$2,961
- Est. tax savings @ 24.0%
- +$711
- After-tax cash flow
- $1,083/yr
For passive investors: Depreciation is non-cash, so a rental often shows a tax loss while cash-flowing — sheltering income. Rental losses are passive: they offset passive income freely, and up to $25,000/yr can offset ordinary (W-2) income if you actively participate and your MAGI is under $100k (phasing out to $0 by $150k); unused losses carry forward. On sale, claimed depreciation is recaptured at up to 25%, and gains may owe capital-gains tax (a 1031 exchange can defer both). Figures are a year-1 estimate at your 24.0% rate — not tax advice; consult a CPA.
Schools (NCES district)
- District
- Montgomery County
- NCES district ID
- 0102430
- Math proficiency
- 9% ▼ -21.00%
- Reading proficiency
- 31% ▼ -1.00%
- Median HH income
- $43,902
- Composite
- 17.24/100
- National rank
- #9093
- State rank
- #106 of 129 in AL
Livability — Montgomery
- Score
- 65/100
- State rank
- #138
- US rank
- #13416
Category grades
Schools grade is shown separately in the Schools card above.
Census & demographics
- Census place
- Montgomery, AL
- County
- Montgomery County · 190,016 people
- City population
- 175,913
- Metro
- Montgomery, AL
- Population (ZIP)
- 23,581
- Household income
- $59,193
- Rent vs Own
- Severe rent burden
- 1039.0
Population outlook (Montgomery County) Hauer SSP2
- Today (2025)
- 224,008 people
- By 2030
- 221,460 · -1.1%
- By 2040
- 214,179 · -4.4%
- By 2050
- 204,912 · -8.5%
- By 2075
- 177,821 · -20.6%
- By 2100
- 145,134 · -35.2%
Race, ethnicity, and origin ACS 2023
- Neighborhood character
- Diverse neighborhood (Simpson 0.60)
- Race & ethnicity
- White 49% Black 39% Hispanic / Latino 8% Two or more races 4%
- Hispanic origin (detail)
- Mexican 4%
- Common ancestry
- Slovak 2% Lithuanian 1% Serbian 1%
- Foreign-born
- 4% · Canada, South Korea
- Languages at home
- 94% English-only · Spanish 5%
Political lean MEDSL · Montgomery
- 2024 margin
- Solid D (+30.7) · D 64.8% · R 34.1% · Other 1.1%
- 2008→2024 swing
- +11.5pp toward D · 2008: 19.2pp · 2024: 30.7pp
- All cycles
- 2024: D+30.7 2020: D+31.5 2016: D+26.2 2012: D+24.3 2008: D+19.2
Not yet ingested
- Civics
- —
Market trends
- HPI YoY
- ▼ -37.64%
- Current HPI
- 149.3867
- Rent YoY
- ▲ 2.65%
- Metro
- Montgomery, AL
- State GDP YoY
- ▲ 2.94%
- F500 in state
- 4
Industry mix (Fortune 500 HQ in AL)
| Industry | F500 HQs | Revenue |
|---|---|---|
| Financial Services | 1 | $8B |
|
||
| Healthcare | 1 | $5B |
|
||
Price history
+11.8% since first listed10 events — show timeline
- 2026-04-05 Contingent — MAAR
- 2026-01-23 Listed $190,000 MAAR
- 2025-12-02 Price Changed $195,000 MAAR
- 2025-11-19 Listed $205,000 MAAR
- 2025-11-06 Listed $205,000 MAAR
- 2023-03-03 Sold (Public Records) $169,900 Public Records
- 2023-03-03 Sold (MLS) $169,900 MAAR
- 2023-02-15 Pending — MAAR
- 2023-02-06 Contingent — MAAR
- 2023-01-31 Listed $169,900 MAAR
Property tax history
-1.5%/yrLatest (2023): $636 · +57.0% YoY. Source: county tax records.
Cash-flow waterfall
monthlySold comps — $/sqft
last 12 mo · ≤1 miLoading sold comps…