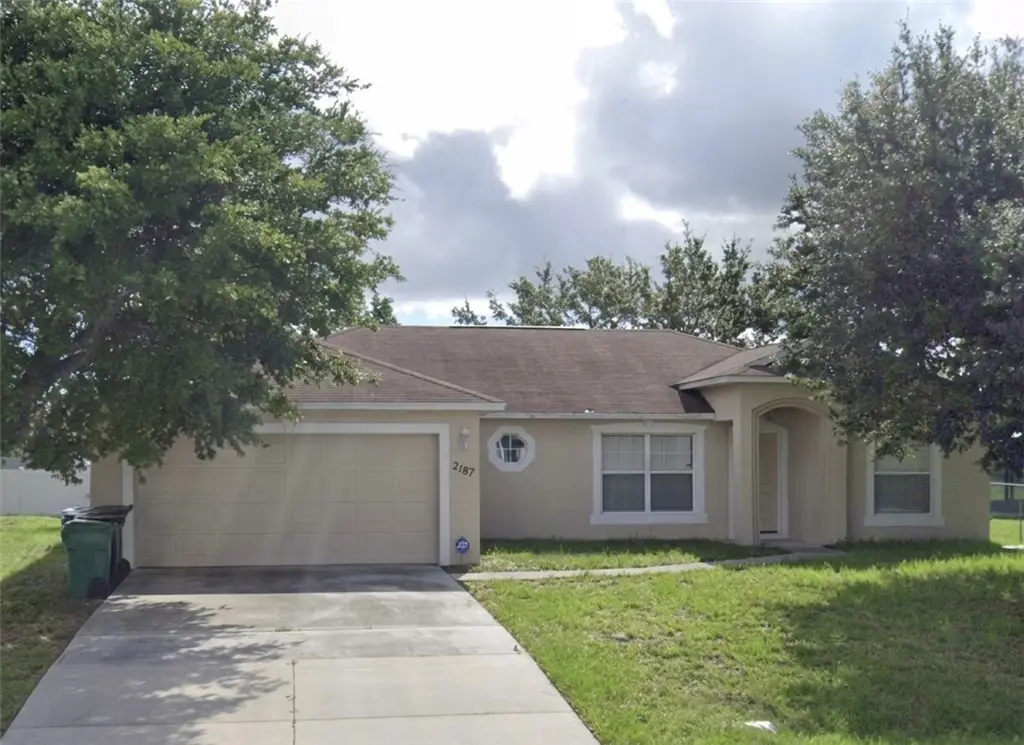
2187 SW Cameo Blvd · Port St. Lucie, FL
Flood risk 1/10 · Minimal
- FEMA flood zone
- X (unshaded)
- Chance of flooding over 30 yrs
- 0.0%
- Est. flood insurance / yr
- $507 – $1,088
Fire risk 1/10 · Minimal
- Est. fire insurance / yr
- $947 – $1,759
Heat risk 10/10 · Severe
- Hot days now (above 106°F)
- 7 days/yr
- Hot days in 30 yrs
- 25 days/yr
Wind risk 10/10 · Severe
- Chance of severe wind over 30 yrs
- 99.0%
Air-quality risk 1/10 · Minimal
- Unhealthy air days now
- 0 days/yr
- Unhealthy air days in 30 yrs
- 0 days/yr
Risk factors via First Street. Map © Google.
Why this score? — see what drove the D grade
The composite is a weighted blend of 9 inputs, each scored 0–100. Each bar is that input's sub-score; the figure is the points it added to the 100-point composite (weight × sub-score).
- Cash flow +15.3/30.0
- ARV discount +9.9/15.0
- DSCR +4.7/10.0
- Schools +3.7/10.0
- 1% rule +3.2/10.0
- Rent growth +2.6/5.0
- Livability +2.5/5.0
- Condition / age +2.5/5.0
- Appreciation +0.0/10.0
$350,000
🖨 Deal sheet (PDF) 📄 Offer letter ✓ Due diligence
Listing remarks MLS
REMODELD HOME NEW TILES IN ALL LIVING AREAS, NEW CARPET IN BEDROOMS, FRESHLY PAINTED, SEPERATE LAUNDRY ROOM, MOVE IN READY. SEWER/ WATER ASSESSMENT IS PAID IN FULL SO TAXES WILL BE LOWER. TAKINF BACK UP OFFERS UNDER CONTRACT UNTIL 12/9/2011,5 DAYS MAX FOR INSPECTION, INFINITI TITLE FOR ESCROW AND CLOSE SELLER PAYS TITLE OR BUYER CAN PAY & CHOSE TITLE PLEASE REFLECT SUCH ON CONTRACT. VOF OR PRE-QUAL MUST ACCOMPANY OFFER. INFINITI TITLE INSURANCE AGENCY, 2833 SW BRIGHTON ST, PSL FL, 34953 PHONE 772-621-7460
Key facts
- 2 garage spots
- Built 2005
- Listed 20 days
Neighborhood map
What this means for you Summary
Snapshot
- This is a 3-bed/2.0-bath single-family listed at $350k.
Deal economics
- At list price, monthly cash flow is $129 ($2k/yr) — positive.
- The deal already cash-flows at list — no discount required.
- To meet the 1% rule (rent ≥ 1% of price), the offer needs to be $286k (18.3% below list).
- Recommended offer: $286k (18.3% below list) — sets the bar for 1% rule.
- Cap rate 6.7% vs local median 3.9% in Port St. Lucie — top-decile yield for the area; either an underpriced asset or a hidden risk that comps aren't pricing in. Stress-test before assuming the spread holds.
Location & tenants
- Location reads: area grade D — affects rentability + tenant quality, not the cash-flow math above.
- St. Lucie (urban): math 40% / reading 48% proficiency, ranked #51 of 73 in FL (top 70%) — families likely to look elsewhere, expect single-tenant / working-renter base with shorter leases.
- Zoned schools: Manatee Academy K-8 (math 53% / reading 51%, grade C-, #990 of 2,144 statewide, top 48%, 1,664 students, 65% FRL); Southern Oaks Middle School (math 39% / reading 43%, grade F, #353 of 571 statewide, top 63%, 894 students, 76% FRL); Fort Pierce Central High School (math 15% / reading 45%, grade F, #441 of 667 statewide, top 67%, 3,091 students, 62% FRL).
- Market conditions: Rents flat; 768 active listings in the ZIP; 40 comparable units currently listed for rent nearby; rentals at typical pace (median 26d on market — plan ~3-4 weeks tenant-placement turnaround); solid renter incomes; 4,868 units permitted in St. Lucie County in 2024 (268 in 5+ unit buildings).
- This rent runs 40% of the median local income ($86k/yr) — at the standard rent-burdened threshold; future hikes will face affordability resistance.
Forward outlook
- Local home prices are declining (-3.0%/yr); year-one equity from $2k of loan paydown is wiped out by about $10k of value loss. Plan a longer hold.
- St. Lucie County population projected at +20% by 2050 — long-run rental-demand tailwind backs the buy-and-hold thesis.
Negotiation context
- It's been on market 20 days — a 2% lower offer ($345k) is reasonable based on typical stale-listing flexibility.
- 2 sale attempts since 17y ago; this cycle's ask is 250% above the opening price — seller raised mid-cycle; expect resistance to lowballs.
- Current owner paid $95k; list at $350k implies a 268% gain — meaningful room to come down on a strong offer.
Risks & watch-outs
- Climate carrying-cost: severe wind risk, 99% chance of damaging wind over 30y; extreme-heat days projected 7→25/yr by 2055 (HVAC capex compounding) — expect insurance premiums to compound above CPI over the hold.
Questions for the listing agent
- Is there a deadline driving the sale (1031 exchange, divorce, estate, relocation)? That informs how much negotiation room exists.
- The area grade is low — what's the realistic commute time and amenity access for the typical tenant pool here? Any planned neighborhood developments (good or bad) we should know about?
- What's the average days-on-market for RENTAL listings here right now (not sales)? A rising rental-DOM trend means longer vacancies and softer asking-rent achievability than the comps imply.
- What's the recent tenant-quality profile in this submarket — average credit score on applications, eviction rate, late-payment / NSF rate, and stable-employment percentage? A property-management company in the area should have these aggregated.
- How much new for-sale + rental construction is in the pipeline within 1–3 miles? Heavy new supply typically softens prices + rents 12–24 months out; constrained supply supports both.
Investment metrics
- 1% rule
- 0.82% ✗
- Cap rate
- 6.74%
- Cash-on-cash
- 1.58%
- DSCR
- 1.07
- GRM
- 10.2
CMA / ARV
- ARV (on-the-fly)
- $369,808
- Comps found
- 12
Show comp detail 12 sales within ~0.75 mi
| Address | Dist | Beds/Ba | Sqft | Sold | Price | $/sf | Match |
|---|---|---|---|---|---|---|---|
| 1971 SW Morelia Ln | 0.23mi | 3/2.0 | 1,516 (-5%) | 3mo | $350,000 | $231 | 79 |
| 2037 SW Mcallister Ln | 0.14mi | 3/2.0 | 1,443 (-10%) | 2mo | $357,000 | $247 | 76 |
| 679 SW Post Ter | 0.38mi | 3/2.0 | 1,564 (-2%) | 7mo | $359,900 | $230 | 73 |
| 702 SW Arkansas Ter | 0.25mi | 3/2.0 | 1,423 (-11%) | 2mo | $330,500 | $232 | 68 |
| 701 SW Amber Ter | 0.55mi | 3/2.0 | 1,539 (-4%) | 1mo | $240,000 | $156 | 68 |
| 331 SW Majestic Ter | 0.58mi | 3/2.0 | 1,538 (-4%) | 3mo | $359,900 | $234 | 64 |
| 674 SW Sandbar Ter SW | 0.46mi | 3/2.0 | 1,647 (+3%) | 10mo | $410,000 | $249 | 64 |
| 2014 SW Trenton Ln | 0.56mi | 3/2.0 | 1,575 (-1%) | 9mo | $377,000 | $239 | 64 |
| 742 SW Nichols Ter | 0.56mi | 3/2.0 | 1,504 (-6%) | 2mo | $245,000 | $163 | 63 |
| 782 SW Amber Ter | 0.50mi | 3/2.0 | 1,808 (+13%) | 4mo | $400,000 | $221 | 51 |
| 1751 SW Bayshore Blvd | 0.74mi | 3/2.0 | 1,735 (+9%) | 1mo | $437,000 | $252 | 50 |
| 2062 SW Idaho Ln | 0.55mi | 3/2.0 | 1,814 (+14%) | 2mo | $415,000 | $229 | 50 |
Match score weights: distance 35% · size 25% · config 20% · recency 20%. Top-matched comps best support the ARV.
Projected returns pro-forma
-3.0% appreciation · 0.22% rent growth · sell at horizon
- IRR
- -16.6%
- Equity multiple
- 0.42×
- Total profit
- $-56,402
- Equity at exit
- $52,186
- IRR
- -13.7%
- Equity multiple
- 0.29×
- Total profit
- $-69,269
- Equity at exit
- $30,262
Cash invested: $98,000 (down + closing). Projections, not guarantees.
Landlord ↔ Tenant lean methodology
- Overall (STATE)
- 87 Strongly Landlord-Friendly
- State Florida
- 87 Strongly Landlord-Friendly · R+3
- County
- — inherits STATE
- City
- — inherits STATE
ZIP-level market 34953
- Home prices YoY
- -10.1%
- Rents YoY
- 0.2%
- Active inventory
- 768
- Price-to-rent
- 10.2×
Monthly cashflow live
- Estimated rent
- $2,860 high interval (Pro) →
- Mortgage (P&I)
- −$1,835
- Tax from tax record
- −$149 /mo · $1,783/yr
- Insurance
- −$146
- HOA
- −$0
- Vacancy / Maint / Mgmt
- −$601
- Net cashflow
- $129
Break-even live
Sensitivity live
| Price | -10% $327 | -5% $228 | +0% $129 | +5% $30 | +10% $-69 |
|---|---|---|---|---|---|
| Rent | -10% $-97 | -5% $16 | +0% $129 | +5% $242 | +10% $355 |
| Rate | -1.0pp $305 | -0.5pp $218 | base $129 | +0.5pp $39 | +1.0pp $-54 |
UW: 25.0% down · 7.5% · 30yr · 1.5% tax · 5.0% vac · 8.0% maint · 8.0% mgmt
Financing live
Cash to close
- Down payment
- $87,500
- Closing costs
- $10,500
- Reserves months
- —
- Total cash needed
- —
Loan-product check · same deal, 3 products live
Conventional
25% down · 7.5% · 30yr
- Down + closing
- —
- Monthly P&I
- —
- Monthly cashflow
- —
- DSCR
- —
- Eligible?
- —
Personal DTI + credit; lowest rate.
DSCR
20% down · 8.5% · 30yr
- Down + closing
- —
- Monthly P&I
- —
- Monthly cashflow
- —
- DSCR
- —
- Eligible?
- —
No personal income docs; deal must DSCR.
Hard money
10% down · 12.0% · 12mo
- Down + closing
- —
- Monthly P&I
- —
- Monthly cashflow
- —
- DSCR
- —
- Eligible?
- —
Short-term bridge; refi at stabilization.
Rent comps 40 comps
| Address | Beds | Baths | Sqft | Rent | $/sqft | DOM | Units | Dist |
|---|---|---|---|---|---|---|---|---|
| 2180 SW Cameo Blvd Port Saint Lucie, FL | 4.0 | 2.0 | 1796 | $3,400 | $1.89 | 25d | 1 | 0.05mi |
| 619 SW Post Ter Port Saint Lucie, FL | 3.0 | 2.0 | 1827 | $2,600 | $1.42 | 25d | 1 | 0.25mi |
| 1941 SW Hampshire Ln Port Saint Lucie, FL | 4.0 | 2.0 | 1908 | $2,600 | $1.36 | 25d | 1 | 0.31mi |
| 613 SW Pueblo Ter Port Saint Lucie, FL | 3.0 | 2.0 | 1209 | $2,200 | $1.82 | 16d | 1 | 0.40mi |
| 613 SW Pueblo Ter Port Saint Lucie, FL | 3.0 | 2.0 | 1209 | $2,200 | $1.82 | 25d | 1 | 0.40mi |
| 481 SW Voltair Ter Port Saint Lucie, FL | 3.0 | 2.0 | 1056 | $3,300 | $3.12 | 25d | 1 | 0.40mi |
| 2351 SW Chestnut Ln Unit N/A Port St. Lucie, FL | 3.0 | 2.0 | 1510 | $3,000 | $1.99 | 25d | 1 | 0.41mi |
| 662 SW Sandbar Ter Port Saint Lucie, FL | 4.0 | 2.0 | 1644 | $2,366 | $1.44 | 16d | 1 | 0.47mi |
| 2141 SW Bayshore Blvd Port Saint Lucie, FL | 3.0 | 2.0 | 1918 | $3,300 | $1.72 | 16d | 1 | 0.50mi |
| 2078 SW Idaho Ln Port Saint Lucie, FL | 3.0 | 2.0 | 1800 | $2,361 | $1.31 | 16d | 1 | 0.53mi |
| 1841 SW McAllister Ln Port Saint Lucie, FL | 3.0 | 2.0 | 1146 | $2,250 | $1.96 | 23d | 1 | 0.60mi |
| 2010 SW Burlington St Port Saint Lucie, FL | 3.0 | 2.0 | 1118 | $2,600 | $2.33 | 25d | 1 | 0.62mi |
| 1782 SW Bayshore Blvd Port Saint Lucie, FL | 4.0 | 3.0 | 2094 | $3,200 | $1.53 | 25d | 1 | 0.64mi |
| 928 SW John Maccormack Ter Port Saint Lucie, FL | 4.0 | 2.5 | 1802 | $2,800 | $1.55 | 16d | 1 | 0.66mi |
| 2265 SW Edison Cir Port Saint Lucie, FL | 2.0 | 2.0 | 1305 | $2,250 | $1.72 | 25d | 1 | 0.72mi |
| 332 SW Glenwood Dr Port Saint Lucie, FL | 4.0 | 2.0 | 2176 | $2,400 | $1.10 | 23d | 1 | 0.73mi |
| 1750 SW Hampshire Ln Port Saint Lucie, FL | 3.0 | 2.0 | 1597 | $2,376 | $1.49 | 16d | 1 | 0.77mi |
| 279 SW Glenwood Dr Port Saint Lucie, FL | 3.0 | 2.0 | 1393 | $2,975 | $2.14 | 25d | 1 | 0.79mi |
| 262 SW Crescent Ave Port Saint Lucie, FL | 3.0 | 2.0 | 1482 | $2,600 | $1.75 | 25d | 1 | 0.82mi |
| 2342 SW Bayshore Blvd Port Saint Lucie, FL | 3.0 | 2.0 | 1176 | $2,300 | $1.96 | 25d | 1 | 0.82mi |
| 233 SW Chapman Ave Port Saint Lucie, FL | 3.0 | 2.0 | 1467 | $1,250 | $0.85 | 23d | 1 | 0.89mi |
| 1626 SW Buffum Ln Port Saint Lucie, FL | 4.0 | 2.0 | 1704 | $2,600 | $1.53 | 25d | 1 | 0.96mi |
| 221 SW Voltair Ter Port Saint Lucie, FL | 4.0 | 2.5 | 2232 | $3,000 | $1.34 | 25d | 1 | 0.97mi |
| 2617 SW Chestnut Ln Port Saint Lucie, FL | 3.0 | 2.0 | 1457 | $2,675 | $1.84 | 25d | 1 | 0.99mi |
| 2617 SW Chestnut Ln Port Saint Lucie, FL | 3.0 | 2.0 | 2052 | $2,675 | $1.30 | 16d | 1 | 0.99mi |
| 2174 SW Wayne St Port Saint Lucie, FL | 3.0 | 2.0 | 1463 | $2,370 | $1.62 | 25d | 1 | 1.00mi |
| 210 SW Voltair Ter Port Saint Lucie, FL | 3.0 | 2.0 | 1526 | $2,650 | $1.74 | 25d | 1 | 1.01mi |
| 1080 SW Colorado Ave Port Saint Lucie, FL | 3.0 | 2.0 | 1240 | $2,150 | $1.73 | 25d | 1 | 1.03mi |
| 543 SW Whitmore Dr Port Saint Lucie, FL | 4.0 | 2.0 | 1916 | $2,950 | $1.54 | 25d | 1 | 1.07mi |
| 481 SW Aster Rd Port Saint Lucie, FL | 3.0 | 2.0 | 1499 | $3,000 | $2.00 | 25d | 1 | 1.07mi |
| 518 SW Aster Rd Port Saint Lucie, FL | 4.0 | 2.0 | 1773 | $3,450 | $1.95 | 25d | 1 | 1.09mi |
| 161 SW Grimaldo Ter Port Saint Lucie, FL | 3.0 | 2.0 | 1628 | $2,300 | $1.41 | 23d | 1 | 1.09mi |
| 180 SW Voltair Ter Port Saint Lucie, FL | 3.0 | 2.0 | 1519 | $2,500 | $1.65 | 25d | 1 | 1.10mi |
| 1143 SW Estaugh Ave Port Saint Lucie, FL | 4.0 | 3.0 | 1941 | $2,800 | $1.44 | 25d | 1 | 1.19mi |
| 992 SW College Park Rd Port Saint Lucie, FL | 4.0 | 3.0 | 2078 | $2,700 | $1.30 | 25d | 1 | 1.21mi |
| 1273 SW Granville Ave Port St. Lucie, FL | 4.0 | 3.0 | 2100 | $3,500 | $1.67 | 25d | 1 | 1.25mi |
| 385 SW Fairway Ave Port Saint Lucie, FL | 3.0 | 2.0 | 1440 | $2,800 | $1.94 | 25d | 1 | 1.32mi |
| 1881 SE Airoso Blvd Port Saint Lucie, FL | 3.0 | 2.0 | 1384 | $2,200 | $1.59 | 25d | 1 | 1.35mi |
| 2357 SW Norton St Port Saint Lucie, FL | 4.0 | 3.0 | 2134 | $2,800 | $1.31 | 25d | 1 | 1.40mi |
| 997 SW Eureka Ave Port Saint Lucie, FL | 3.0 | 2.0 | 1986 | $2,600 | $1.31 | 25d | 1 | 1.45mi |
Listing history 14 events
-
2026-06-21days on market $350,000 Coming Soon 20 DOM
-
2026-06-18days on market $350,000 Coming Soon 17 DOM
-
2026-06-17days on market $350,000 Coming Soon 16 DOM
-
2026-06-16days on market $350,000 Coming Soon 15 DOM
-
2026-06-15days on market $350,000 Coming Soon 14 DOM
-
2026-06-14days on market $350,000 Coming Soon 12 DOM
-
2026-06-13days on market $350,000 Coming Soon 11 DOM
-
2026-06-10days on market $350,000 Coming Soon 9 DOM
-
2026-06-09days on market $350,000 Coming Soon 8 DOM
-
2026-06-08days on market $350,000 Coming Soon 7 DOM
-
2026-06-07days on market $350,000 Coming Soon 6 DOM
-
2026-06-05days on market $350,000 Coming Soon 3 DOM
-
2026-06-03days on market $350,000 Coming Soon 2 DOM
-
2026-06-02$350,000 Coming Soon 1 DOM
ⓘ Source: listings_history table (triggers on properties + properties_extension) + one-shot
backfill from property_details.listing_events for pre-trigger history.
Tax reassessment forecast FL · Resets to sale price
- Current annual tax
- $1,783 · $149/mo
- Projected year-2 tax
- $2,905 · $242/mo
- Expected delta
- +$1,122/yr (+$93/mo · 62.9%)
ⓘ Screening estimate from a state-policy table — verify with the county assessor before closing.
Climate risk First Street
- Flood 1/10 Low FEMA zone X (unshaded) · 0% chance over 30 yrs
- Wildfire 1/10 Low
- Heat 10/10 Extreme 7 d/yr ≥106°F today · 25 d/yr by 30 yrs out
- Wind 10/10 Extreme 99% chance of damaging wind over 30 yrs
- Air quality 1/10 Low 0 unhealthy d/yr today · 0 by 30 yrs out
Nearby sold comps map
Loading sold comps map…
Walkable amenities ~0.75 mi
Loading nearby amenities…
Taxation est. · year 1
- Rental income
- $34,316
- − Mortgage interest
- −$19,605
- − Property taxes
- −$1,783
- − Insurance
- −$1,750
- − Repairs & maintenance
- −$2,745
- − Management
- −$2,745
- − Depreciation
- −$10,182
- Taxable loss
- −$4,495
- Est. tax savings @ 24.0%
- +$1,079
- After-tax cash flow
- $2,630/yr
For passive investors: Depreciation is non-cash, so a rental often shows a tax loss while cash-flowing — sheltering income. Rental losses are passive: they offset passive income freely, and up to $25,000/yr can offset ordinary (W-2) income if you actively participate and your MAGI is under $100k (phasing out to $0 by $150k); unused losses carry forward. On sale, claimed depreciation is recaptured at up to 25%, and gains may owe capital-gains tax (a 1031 exchange can defer both). Figures are a year-1 estimate at your 24.0% rate — not tax advice; consult a CPA.
Schools (NCES district)
- District
- St. Lucie
- NCES district ID
- 1201770
- Math proficiency
- 40% ▼ -11.00%
- Reading proficiency
- 48% ▼ -4.00%
- Median HH income
- $44,737
- Composite
- 37.28/100
- National rank
- #4449
- State rank
- #51 of 73 in FL
Livability — Port St. Lucie
No livability data for this city. (Only ~50 U.S. cities are tracked.)
Census & demographics
- Census place
- Port St. Lucie, FL
- County
- Saint Lucie County · 337,150 people
- City population
- 221,051
- Metro
- Port St. Lucie, FL
- Population (ZIP)
- 86,875
- Household income
- $85,667
- Rent vs Own
- Severe rent burden
- 857.0
Population outlook (St. Lucie County) Hauer SSP2
- Today (2025)
- 338,016 people
- By 2030
- 355,687 · +5.2%
- By 2040
- 385,521 · +14.1%
- By 2050
- 406,106 · +20.1%
- By 2075
- 441,054 · +30.5%
- By 2100
- 436,885 · +29.2%
Race, ethnicity, and origin ACS 2023
- Neighborhood character
- Diverse neighborhood (Simpson 0.69)
- Race & ethnicity
- White 42% Hispanic / Latino 28% Black 23% Two or more races 15% Asian 2%
- Hispanic origin (detail)
- Mexican 2% Puerto Rican 8% Cuban 4% Dominican 3%
- Common ancestry
- Hispanic 4% Romanian 2% Estonian 2%
- Foreign-born
- 24% · Canada, Jamaica, China
- Languages at home
- 69% English-only · Spanish 19% French/Haitian/Cajun 6% Other Indo-European 3%
Political lean MEDSL · St. Lucie
- 2024 margin
- Lean R (+9.1) · D 45.1% · R 54.2%
- 2008→2024 swing
- -21.2pp toward R · 2008: 12.1pp · 2024: -9.1pp
- All cycles
- 2024: R+9.1 2020: R+1.6 2016: R+2.5 2012: D+7.9 2008: D+12.1
Not yet ingested
- Civics
- —
Market trends
- HPI YoY
- ▼ -44.19%
- Current HPI
- 392.7681
- Rent YoY
- ▲ 0.22%
- Metro
- Port St. Lucie, FL
- State GDP YoY
- ▲ 3.28%
- F500 in state
- 36
Industry mix (Fortune 500 HQ in FL)
| Industry | F500 HQs | Revenue |
|---|---|---|
| Industrial Technology | 2 | $29B |
|
||
| Insurance | 2 | $17B |
|
||
| Retail | 1 | $60B |
|
||
| Technology Distribution | 1 | $58B |
|
||
| Homebuilding | 1 | $35B |
|
||
| Technology Manufacturing | 1 | $35B |
|
||
Price history
+288.9% since first listed11 events — show timeline
- 2026-06-01 Coming Soon $350,000 RAIRCMLS
- 2011-12-19 Sold (Public Records) $95,000 Public Records
- 2011-12-09 Sold (MLS) $95,000 Beaches MLS
- 2011-08-11 Listed $100,000 Beaches MLS
- 2011-06-27 Sold (Public Records) $76,000 Public Records
- 2011-06-27 Sold (Public Records) $66,000 Public Records
- 2011-06-16 Sold (MLS) $77,000 Beaches MLS
- 2011-06-10 Listing Removed — Beaches MLS
- 2009-08-26 Listed $79,900 Beaches MLS
- 2005-01-28 Sold (Public Records) $45,000 Public Records
- 2004-08-13 Sold (Public Records) $90,000 Public Records
Property tax history
+3.6%/yrLatest (2025): $1,783 · +4.3% YoY. Source: county tax records.
Cash-flow waterfall
monthlySold comps — $/sqft
last 12 mo · ≤1 miLoading sold comps…