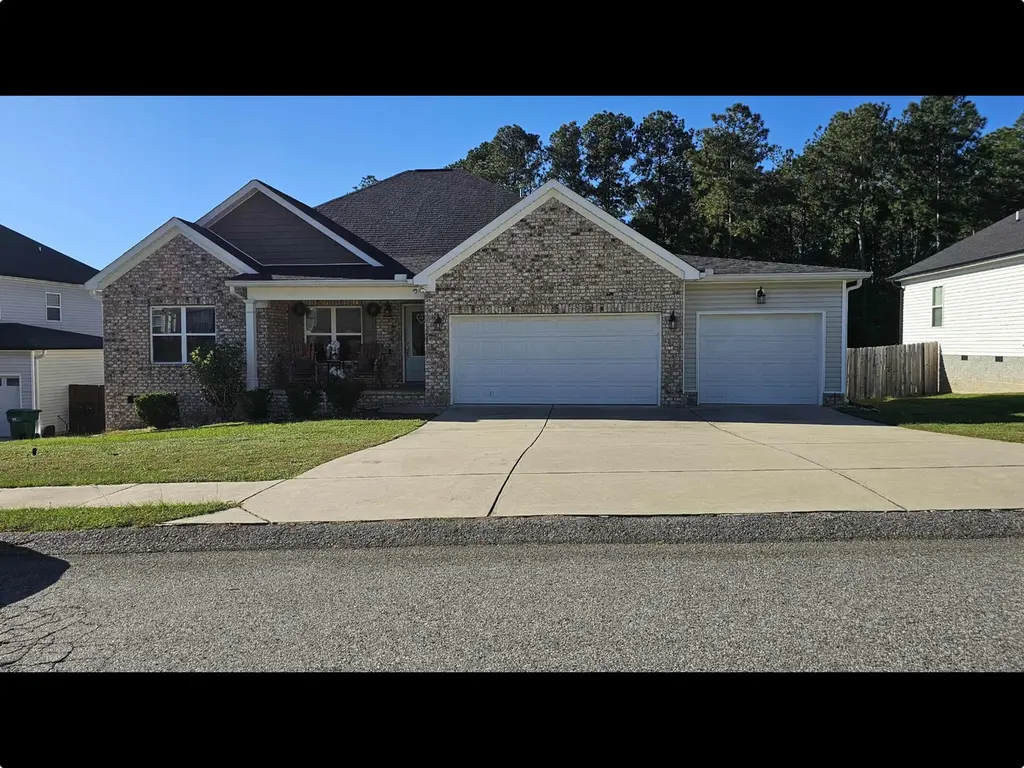
1216 Bubbling Springs Dr · Burnettown, SC
Flood risk 1/10 · Minimal
- FEMA flood zone
- X (unshaded)
- Chance of flooding over 30 yrs
- 0.0%
- Est. flood insurance / yr
- $507 – $1,088
Fire risk 5/10 · Moderate
- Est. fire insurance / yr
- $783 – $1,453
Heat risk 7/10 · Major
- Hot days now (above 109°F)
- 7 days/yr
- Hot days in 30 yrs
- 17 days/yr
Wind risk 6/10 · Moderate
- Chance of severe wind over 30 yrs
- 66.0%
Air-quality risk 3/10 · Minor
- Unhealthy air days now
- 3 days/yr
- Unhealthy air days in 30 yrs
- 4 days/yr
Risk factors via First Street. Map © Google.
Why this score? — see what drove the D+ grade
The composite is a weighted blend of 9 inputs, each scored 0–100. Each bar is that input's sub-score; the figure is the points it added to the 100-point composite (weight × sub-score).
- Cash flow +17.0/30.0
- Appreciation +9.2/10.0
- DSCR +5.3/10.0
- 1% rule +3.4/10.0
- ARV discount +3.4/15.0
- Schools +3.2/10.0
- Livability +3.2/5.0
- Rent growth +2.5/5.0
- Condition / age +2.5/5.0
$288,500
🖨 Deal sheet 📄 Offer letter ✓ Due diligence
Listing remarks MLS
Custom Built
Key facts
- Open floor plan
- Large flat back yard
- 0.33 acre lot
Tags
Neighborhood map
What this means for you Summary
Snapshot
- This is a 3-bed/2.0-bath single-family listed at $288k.
Deal economics
- At list price, monthly cash flow is $194 ($2k/yr) — positive.
- The deal already cash-flows at list — no discount required.
- To meet the 1% rule (rent ≥ 1% of price), the offer needs to be $242k (16.3% below list).
- Recommended offer: $242k (16.3% below list) — sets the bar for 1% rule.
- Cap rate 7.1% vs local median 5.5% in Burnettown — meaningfully above typical; check what's discounted (condition, days-on-market, listing class) to confirm the premium yield is real.
Location & tenants
- Location reads 64/100 on livability (#159 in SC) — a middle-class / working-renter tenant base. Strengths: crime A+, cost of living A+, housing A+; Watch: amenities F, commute F, employment D-.
- Aiken 01 (suburban): math 31% / reading 44% proficiency, ranked #36 of 80 in SC (top 45%) — families likely to look elsewhere, expect single-tenant / working-renter base with shorter leases.
- Zoned schools: Byrd Elementary (math 28% / reading 36%, grade F, #369 of 597 statewide, top 64%, 657 students, 37% FRL); Midland Valley High (math 31% / reading 83%, grade C, #120 of 196 statewide, top 64%, 1,477 students, 62% FRL) — zoned schools at 49% FRL track the district average.
- Market conditions: 299 active listings in the ZIP; 2 comparable units currently listed for rent nearby; solid renter incomes; 2,500 units permitted in Aiken County in 2024 (1,023 in 5+ unit buildings).
Forward outlook
- In year one you build about $26k of equity ($2k loan paydown + $24k appreciation (8.4% local appreciation)).
- Aiken County population projected at +9% by 2050 — modest demand growth; plan on rents tracking national, not racing it.
- At projected returns (8.4% appreciation + 3.0% rent growth), your $81k cash investment doubles in ~3 years — after that, you're playing with house money.
- By year 2, paydown + projected appreciation supports a ~$42k cash-out refi (75% LTV) — recoverable capital for the next deal without selling this one.
Negotiation context
- It's been on market 38 days — a 3% lower offer ($280k) is reasonable based on typical stale-listing flexibility.
- 4 sale attempts since 8y ago with the ask held roughly flat each time — persistent listings suggest the price (not the market) is what's stuck; bring a comps-based counter.
- Current owner paid $228k; 27% above their basis — modest negotiation headroom, anchor on the comps not their cost.
Risks & watch-outs
- Climate carrying-cost: major wind risk, 66% chance of damaging wind over 30y; moderate wildfire risk; extreme-heat days projected 7→17/yr by 2055 (HVAC capex compounding) — expect insurance premiums to compound above CPI over the hold.
Questions for the listing agent
- It's been on market 38 days. Have you received any prior offers? Is the seller open to a 16% concession, seller financing, or rate buy-down credit?
- What does the HOA fee cover, when was the last increase, and are there any pending special assessments or reserve-fund shortfalls?
- Is there a deadline driving the sale (1031 exchange, divorce, estate, relocation)? That informs how much negotiation room exists.
- Schools are D-rated, which usually means shorter tenancies and higher turnover. Who's the typical renter profile here, and what's been the actual vacancy rate?
- The area grade is low — what's the realistic commute time and amenity access for the typical tenant pool here? Any planned neighborhood developments (good or bad) we should know about?
- What's the average days-on-market for RENTAL listings here right now (not sales)? A rising rental-DOM trend means longer vacancies and softer asking-rent achievability than the comps imply.
- What's the recent tenant-quality profile in this submarket — average credit score on applications, eviction rate, late-payment / NSF rate, and stable-employment percentage? A property-management company in the area should have these aggregated.
- How much new for-sale + rental construction is in the pipeline within 1–3 miles? Heavy new supply typically softens prices + rents 12–24 months out; constrained supply supports both.
Investment metrics
- 1% rule
- 0.84% ✗
- Cap rate
- 7.10%
- Cash-on-cash
- 2.88%
- DSCR
- 1.13
- GRM
- 10.0
CMA / ARV
- ARV (on-the-fly)
- $264,600
- Comps found
- 12
Show comp detail 12 sales within ~0.75 mi
| Address | Dist | Beds/Ba | Sqft | Sold | Price | $/sf | Match |
|---|---|---|---|---|---|---|---|
| 5125 Trickling Creek Dr | 0.28mi | 3/2.0 | 1,661 (-12%) | 2mo | $289,000 | $174 | 65 |
| 1034 Tess St | 0.70mi | 3/2.5 | 1,890 (0%) | 4mo | $275,000 | $146 | 62 |
| 1031 Tess St | 0.68mi | 3/2.5 | 1,890 (0%) | 7mo | $279,900 | $148 | 60 |
| 979 Tess St | 0.73mi | 3/2.5 | 1,890 (0%) | 6mo | $259,900 | $138 | 59 |
| 1515 Brookstone Dr | 0.72mi | 4/2.0 (+1) | 1,905 (+1%) | 5mo | $316,000 | $166 | 56 |
| 6229 Whirlaway Rd | 0.50mi | 4/3.0 (+1) | 2,025 (+7%) | 7mo | $287,500 | $142 | 50 |
| 973 Tess St | 0.74mi | 4/2.5 (+1) | 2,046 (+8%) | 4mo | $285,900 | $140 | 41 |
| 995 Tess St | 0.72mi | 3/2.5 | 2,110 (+12%) | 6mo | $259,900 | $123 | 40 |
| 959 Tess St | 0.75mi | 3/2.5 | 2,110 (+12%) | 4mo | $285,900 | $135 | 40 |
| 976 Tess Street Ct | 0.72mi | 4/2.5 (+1) | 2,046 (+8%) | 8mo | $286,435 | $140 | 39 |
| 1039 Tess St | 0.67mi | 4/2.5 (+1) | 2,110 (+12%) | 8mo | $290,870 | $138 | 36 |
| 938 Tess St | 0.74mi | 4/2.5 (+1) | 2,110 (+12%) | 7mo | $291,065 | $138 | 34 |
Match score weights: distance 35% · size 25% · config 20% · recency 20%. Top-matched comps best support the ARV.
Projected returns pro-forma
8.38% appreciation · 3.0% rent growth · sell at horizon
- IRR
- 23.0%
- Equity multiple
- 2.71×
- Total profit
- $138,095
- Equity at exit
- $226,683
- IRR
- 20.8%
- Equity multiple
- 5.85×
- Total profit
- $391,671
- Equity at exit
- $457,313
Cash invested: $80,780 (down + closing). Projections, not guarantees.
Landlord ↔ Tenant lean methodology
- Overall (STATE)
- 90 Strongly Landlord-Friendly
- State South Carolina
- 90 Strongly Landlord-Friendly · R+6
- County
- — inherits STATE
- City
- — inherits STATE
ZIP-level market 29829
- Home prices YoY
- 3.0%
- Active inventory
- 299
- Price-to-rent
- 10.0×
Monthly cashflow live
- Estimated rent
- $2,415 medium interval (Pro) →
- Mortgage (P&I)
- −$1,513
- Tax from tax record
- −$71 /mo · $853/yr
- Insurance
- −$120
- HOA
- −$10
- Vacancy / Maint / Mgmt
- −$507
- Net cashflow
- $194
Break-even live
UW: 25.0% down · 7.5% · 30yr · 1.5% tax · 5.0% vac · 8.0% maint · 8.0% mgmt
Financing live
Cash to close
- Down payment
- $72,125
- Closing costs
- $8,655
- Reserves months
- —
- Total cash needed
- —
Loan-product check · same deal, 3 products live
Conventional
25% down · 7.5% · 30yr
- Down + closing
- —
- Monthly P&I
- —
- Monthly cashflow
- —
- DSCR
- —
- Eligible?
- —
Personal DTI + credit; lowest rate.
DSCR
20% down · 8.5% · 30yr
- Down + closing
- —
- Monthly P&I
- —
- Monthly cashflow
- —
- DSCR
- —
- Eligible?
- —
No personal income docs; deal must DSCR.
Hard money
10% down · 12.0% · 12mo
- Down + closing
- —
- Monthly P&I
- —
- Monthly cashflow
- —
- DSCR
- —
- Eligible?
- —
Short-term bridge; refi at stabilization.
Rent comps 2 comps
| Address | Beds | Baths | Sqft | Rent | $/sqft | DOM | Units | Dist |
|---|---|---|---|---|---|---|---|---|
| 6279 Whirlaway Rd Graniteville, SC | 3.0 | 2.0 | 1295 | $1,900 | $1.47 | 21d | 1 | 0.56mi |
| 618 Count Fleet Ct Graniteville, SC | 4.0 | 2.5 | 2362 | $2,299 | $0.97 | 21d | 1 | 0.69mi |
HOA detail
- Monthly dues
- $10 · $120/yr
Listing history 23 events
-
2026-06-18days on market $288,500 Active 38 DOM
-
2026-06-17days on market $288,500 Active 37 DOM
-
2026-06-16days on market $288,500 Active 36 DOM
-
2026-06-15days on market $288,500 Active 35 DOM
-
2026-06-14days on market $288,500 Active 33 DOM
-
2026-06-13days on market $288,500 Active 32 DOM
-
2026-06-10days on market $288,500 Active 30 DOM
-
2026-06-09days on market $288,500 Active 29 DOM
-
2026-06-08days on market $288,500 Active 28 DOM
-
2026-06-07days on market $288,500 Active 27 DOM
-
2026-06-03days on market $288,500 Active 23 DOM
-
2026-06-02days on market $288,500 Active 22 DOM
-
2026-06-01days on market $288,500 Active 21 DOM
-
2026-05-31days on market $288,500 Active 20 DOM
-
2026-05-30days on market $288,500 Active 19 DOM
-
2026-05-11historical
-
2026-02-17price $288,500
-
2025-10-14$295,000 Active
-
2025-10-14$288,500 Active
-
2018-11-20soldstatus $227,890 12-char remark
Show marketing remark (12 chars)
Custom Built
-
2018-11-20soldstatus $227,890
Show marketing remark (12 chars)
Custom Built
-
2018-11-19$227,890 12-char remark
Show marketing remark (12 chars)
Custom Built
-
2018-11-19$227,890
Show marketing remark (12 chars)
Custom Built
ⓘ Source: listings_history table (triggers on properties + properties_extension) + one-shot
backfill from property_details.listing_events for pre-trigger history.
Tax reassessment forecast SC · Resets to sale price
- Current annual tax
- $853 · $71/mo
- Projected year-2 tax
- $1,644 · $137/mo
- Expected delta
- +$791/yr (+$66/mo · 92.8%)
ⓘ Screening estimate from a state-policy table — verify with the county assessor before closing.
Climate risk First Street
- Flood 1/10 Low FEMA zone X (unshaded) · 0% chance over 30 yrs
- Wildfire 5/10 Major
- Heat 7/10 Severe 7 d/yr ≥109°F today · 17 d/yr by 30 yrs out
- Wind 6/10 Major 66% chance of damaging wind over 30 yrs
- Air quality 3/10 Moderate 3 unhealthy d/yr today · 4 by 30 yrs out
Nearby sold comps map
Loading sold comps map…
Walkable amenities ~0.75 mi
Loading nearby amenities…
Taxation est. · year 1
- Rental income
- $28,980
- − Mortgage interest
- −$16,160
- − Property taxes
- −$853
- − Insurance
- −$1,442
- − Repairs & maintenance
- −$2,318
- − Management
- −$2,318
- − HOA
- −$120
- − Depreciation
- −$8,393
- Taxable loss
- −$2,625
- Est. tax savings @ 24.0%
- +$630
- After-tax cash flow
- $2,954/yr
For passive investors: Depreciation is non-cash, so a rental often shows a tax loss while cash-flowing — sheltering income. Rental losses are passive: they offset passive income freely, and up to $25,000/yr can offset ordinary (W-2) income if you actively participate and your MAGI is under $100k (phasing out to $0 by $150k); unused losses carry forward. On sale, claimed depreciation is recaptured at up to 25%, and gains may owe capital-gains tax (a 1031 exchange can defer both). Figures are a year-1 estimate at your 24.0% rate — not tax advice; consult a CPA.
Schools (NCES district)
- District
- Aiken 01
- NCES district ID
- 4500720
- Math proficiency
- 31% ▼ -11.00%
- Reading proficiency
- 44% ▼ -1.00%
- Median HH income
- $45,081
- Composite
- 31.91/100
- National rank
- #5857
- State rank
- #36 of 80 in SC
Livability — Burnettown
- Score
- 64/100
- State rank
- #159
- US rank
- #14711
Category grades
Schools grade is shown separately in the Schools card above.
Census & demographics
- County
- Aiken County · 116,534 people
- City population
- 12,385
- Metro
- Augusta-Richmond County, GA-SC
- Population (ZIP)
- 12,385
- Household income
- $84,228
- Rent vs Own
- Severe rent burden
- 213.0
Population outlook (Aiken County) Hauer SSP2
- Today (2025)
- 178,003 people
- By 2030
- 182,876 · +2.7%
- By 2040
- 189,970 · +6.7%
- By 2050
- 193,840 · +8.9%
- By 2075
- 199,453 · +12.1%
- By 2100
- 192,403 · +8.1%
Race, ethnicity, and origin ACS 2023
- Neighborhood character
- Diverse neighborhood (Simpson 0.58)
- Race & ethnicity
- White 59% Black 26% Hispanic / Latino 12% Two or more races 9% Asian 1%
- Hispanic origin (detail)
- Mexican 8% Puerto Rican 1%
- Common ancestry
- Italian 2% Swedish 2% Slovak 1%
- Foreign-born
- 6% · Canada
- Languages at home
- 89% English-only · Spanish 10% Other Indo-European 1%
Political lean MEDSL · Aiken
- 2024 margin
- Strong R (+25.9) · D 36.4% · R 62.2% · Other 1.4%
- 2008→2024 swing
- -1.9pp toward R · 2008: -24.0pp · 2024: -25.9pp
- All cycles
- 2024: R+25.9 2020: R+22.7 2016: R+27.5 2012: R+26.0 2008: R+24.0
Not yet ingested
- Civics
- —
Market trends
- HPI YoY
- ▲ 8.38%
- Current HPI
- 286.4155
- Rent YoY
- —
- Metro
- Augusta-Richmond County, GA-SC
- State GDP YoY
- ▲ 4.51%
- F500 in state
- 2
Industry mix (Fortune 500 HQ in SC)
| Industry | F500 HQs | Revenue |
|---|---|---|
| Packaging | 1 | $7B |
|
||
Price history
+26.6% since first listed8 events — show timeline
- 2026-05-11 Listing Removed — Hive MLS
- 2026-02-17 Price Changed $288,500 Hive MLS
- 2025-10-14 Listed $288,500 Hive MLS
- 2025-10-14 Listed $295,000 Hive MLS
- 2018-11-20 Sold (MLS) $227,890 Hive MLS
- 2018-11-20 Sold (MLS) $227,890 Hive MLS
- 2018-11-19 Listed $227,890 Hive MLS
- 2018-11-19 Listed $227,890 Hive MLS
Property tax history
+34.2%/yrLatest (2025): $853 · +0.0% YoY. Source: county tax records.
Cash-flow waterfall
monthlySold comps — $/sqft
last 12 mo · ≤1 miLoading sold comps…