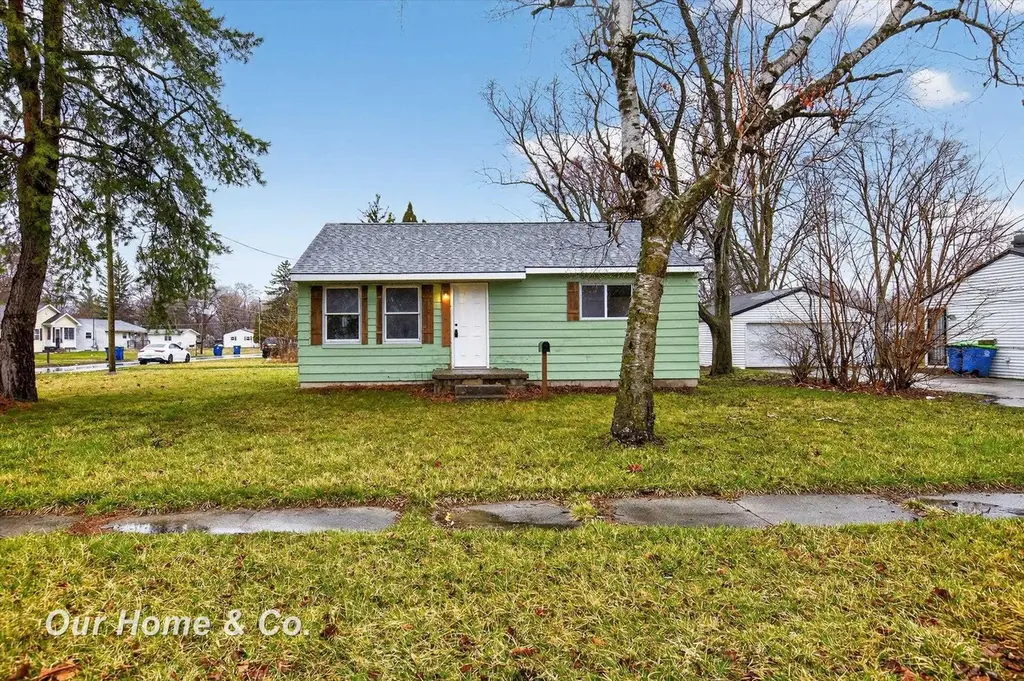
5025 Lodge St · Buena Vista, MI
Flood risk 1/10 · Minimal
- FEMA flood zone
- X (unshaded)
- Chance of flooding over 30 yrs
- 0.0%
- Est. flood insurance / yr
- $507 – $1,088
Fire risk 1/10 · Minimal
- Est. fire insurance / yr
- $784 – $1,456
Heat risk 2/10 · Minimal
- Hot days now (above 98°F)
- 7 days/yr
- Hot days in 30 yrs
- 14 days/yr
Wind risk 1/10 · Minimal
- Chance of severe wind over 30 yrs
- —
Air-quality risk 2/10 · Minimal
- Unhealthy air days now
- 1 days/yr
- Unhealthy air days in 30 yrs
- 2 days/yr
Risk factors via First Street. Map © Google.
Why this score? — see what drove the C grade
The composite is a weighted blend of 9 inputs, each scored 0–100. Each bar is that input's sub-score; the figure is the points it added to the 100-point composite (weight × sub-score).
- Cash flow +28.4/30.0
- DSCR +10.0/10.0
- 1% rule +6.6/10.0
- ARV discount +3.4/15.0
- Livability +3.0/5.0
- Rent growth +2.5/5.0
- Condition / age +2.5/5.0
- Schools +1.0/10.0
- Appreciation +0.0/10.0
$77,400
🖨 Deal sheet 📄 Offer letter ✓ Due diligence
Listing remarks MLS
This updated home offers the perfect blend of modern finishes. Brand new roof, exterior paint, updated garage with new exterior paint, roof and garage door. The home has new electrical, plumbing and all new windows. Cosmetics include a new kitchen with quartz countertops, all new cabinets, backsplash. Additional Benefits: HOME WARRANTY. PRE INSPECTION REPORT WITH REPAIRS COMPLETED. NEW STOVE AND REFRIDGERATOR TO BE INCLUDED UPON A FULL PRICE OFFER.
Key facts
- Fresh paint
- Brand new flooring
- Brand new cabinets
Tags
Property features AI
Finance
- Other: Approximately 896 square feet above grade
- HOA & community: Homeowners association
Exterior
- Parking: Detached 1-car garage
- Utilities: Public water; Public sewer
- Home design: Single-family residence; One level
- Construction: Aluminum and vinyl siding
- Exterior features: Lot approximately 0.14 acres; Lot dimensions: 6,100
Interior
- Bathrooms: 1 full bathroom
- Heating & cooling: Forced air heating (natural gas); No cooling
- Interior features: 3 total rooms; Basement
Neighborhood map
What this means for you Summary
Snapshot
- This is a 2-bed/1.0-bath single-family listed at $77k.
Deal economics
- At list price, monthly cash flow is $250 ($3k/yr) — positive.
- The deal already cash-flows at list — no discount required.
- Meets the 1% rule at list price ($897 rent vs $77k).
- Recommended offer: $76k (1.5% below list) — sets the bar for market timing.
Location & tenants
- Location reads 59/100 on livability (#615 in MI) — a working-class tenant base; expect higher turnover. Strengths: cost of living A+, housing B+; Watch: health & safety C-, schools F, crime F.
- Bridgeport-Spaulding Community School District (suburban): math 7% / reading 17% proficiency, ranked #513 of 540 in MI (top 95%) — low school quality limits family demand, transient renter base, plan for 1-2y turnover; 75% free/reduced lunch — lower-income household profile, screen leases tightly.
- Market conditions: 199 active listings in the ZIP; 3 comparable units currently listed for rent nearby; rentals lingering (median 44d on market — plan ~5-8 weeks vacancy on turnover, expect pricing pressure); 100% of comp listings sitting > 30 days — soft ceiling on asking rent; 154 units permitted in Saginaw County in 2024 (0 in 5+ unit buildings).
Forward outlook
- Local home prices are declining (-3.0%/yr); year-one equity from $535 of loan paydown is wiped out by about $2k of value loss. Plan a longer hold.
- Saginaw County population projected at -25% by 2050 — secular population decline; favor cash flow + early exit over multi-decade hold.
- At projected returns (-3.0% appreciation + 3.0% rent growth), your $22k cash investment doubles in ~9 years — after that, you're playing with house money.
Negotiation context
- It's been on market 27 days — a 2% lower offer ($76k) is reasonable based on typical stale-listing flexibility.
- 4 sale attempts; this cycle's ask has dropped $6k (8%) from the opening price — seller is motivated, your offer sets the floor, not the list.
- Current owner paid $1k; list at $77k implies a 5429% gain — meaningful room to come down on a strong offer.
Risks & watch-outs
- Watch-outs: built in 1957 — expect roof / HVAC / electrical / plumbing capex.
Questions for the listing agent
- Built in 1957 — when were the roof, HVAC, electrical panel, plumbing, and water heater last replaced?
- Is there a deadline driving the sale (1031 exchange, divorce, estate, relocation)? That informs how much negotiation room exists.
- Schools are F-rated, which usually means shorter tenancies and higher turnover. Who's the typical renter profile here, and what's been the actual vacancy rate?
- Crime grade is F in this area — have there been break-ins, vandalism, or insurance claims at this property in the last 3 years? What carrier currently insures it and at what premium?
- What's the average days-on-market for RENTAL listings here right now (not sales)? A rising rental-DOM trend means longer vacancies and softer asking-rent achievability than the comps imply.
- What's the recent tenant-quality profile in this submarket — average credit score on applications, eviction rate, late-payment / NSF rate, and stable-employment percentage? A property-management company in the area should have these aggregated.
- How much new for-sale + rental construction is in the pipeline within 1–3 miles? Heavy new supply typically softens prices + rents 12–24 months out; constrained supply supports both.
Investment metrics
- 1% rule
- 1.16% ✓
- Cap rate
- 10.17%
- Cash-on-cash
- 13.85%
- DSCR
- 1.62
- GRM
- 7.2
CMA / ARV
- ARV (median comp)
- $70,928
- List price
- $77,400
- Delta
- 19.70%
- Verdict
- OVERPRICED
- Comps
- 20 within 1.0 mi
Show comp detail 12 sales within ~0.75 mi
| Address | Dist | Beds/Ba | Sqft | Sold | Price | $/sf | Match |
|---|---|---|---|---|---|---|---|
| 5025 Peterson St | 0.18mi | 2/1.0 | 884 (-1%) | 1mo | $29,500 | $33 | 88 |
| 1726 Prospect St | 0.08mi | 3/1.0 (+1) | 864 (-4%) | 6mo | $33,900 | $39 | 81 |
| 5032 Akron St | 0.03mi | 3/1.0 (+1) | 960 (+7%) | 4mo | $80,000 | $83 | 78 |
| 1800 Prospect St | 0.03mi | 3/1.0 (+1) | 864 (-4%) | 15mo | $62,000 | $72 | 75 |
| 1890 Prospect St | 0.09mi | 3/1.0 (+1) | 864 (-4%) | 14mo | $57,000 | $66 | 73 |
| 5000 Hess Rd | 0.28mi | 2/1.0 | 928 (+4%) | 14mo | $97,900 | $105 | 70 |
| 5057 Akron St | 0.08mi | 3/1.0 (+1) | 960 (+7%) | 15mo | $85,000 | $89 | 67 |
| 5050 Carnegie St | 0.22mi | 3/1.0 (+1) | 988 (+10%) | 2mo | $97,000 | $98 | 66 |
| 1690 Prospect St | 0.11mi | 3/1.0 (+1) | 864 (-4%) | 22mo | $85,000 | $98 | 66 |
| 1575 Mack Rd | 0.26mi | 3/1.5 (+1) | 900 (+0%) | 22mo | $20,000 | $22 | 62 |
| 4749 Strathmoor St | 0.61mi | 2/2.0 | 960 (+7%) | 12mo | $90,000 | $94 | 46 |
| 4724 HESS Rd | 0.67mi | 3/1.0 (+1) | 968 (+8%) | 15mo | $83,000 | $86 | 38 |
Match score weights: distance 35% · size 25% · config 20% · recency 20%. Top-matched comps best support the ARV.
Projected returns pro-forma
-3.0% appreciation · 3.0% rent growth · sell at horizon
- IRR
- 4.0%
- Equity multiple
- 1.15×
- Total profit
- $3,356
- Equity at exit
- $11,541
- IRR
- 13.5%
- Equity multiple
- 2.08×
- Total profit
- $23,302
- Equity at exit
- $6,692
Cash invested: $21,672 (down + closing). Projections, not guarantees.
Landlord ↔ Tenant lean methodology
- Overall (STATE)
- 62 Landlord-Friendly
- State Michigan
- 62 Landlord-Friendly · EVEN
- County
- — inherits STATE
- City
- — inherits STATE
ZIP-level market 48601
- Home prices YoY
- -32.1%
- Active inventory
- 199
- Price-to-rent
- 7.2×
Monthly cashflow live
- Estimated rent
- $897 medium interval (Pro) →
- Mortgage (P&I)
- −$406
- Tax from tax record
- −$21 /mo · $247/yr
- Insurance
- −$32
- HOA
- −$0
- Vacancy / Maint / Mgmt
- −$188
- Net cashflow
- $250
Break-even live
UW: 25.0% down · 7.5% · 30yr · 1.5% tax · 5.0% vac · 8.0% maint · 8.0% mgmt
Financing live
Cash to close
- Down payment
- $19,350
- Closing costs
- $2,322
- Reserves months
- —
- Total cash needed
- —
Loan-product check · same deal, 3 products live
Conventional
25% down · 7.5% · 30yr
- Down + closing
- —
- Monthly P&I
- —
- Monthly cashflow
- —
- DSCR
- —
- Eligible?
- —
Personal DTI + credit; lowest rate.
DSCR
20% down · 8.5% · 30yr
- Down + closing
- —
- Monthly P&I
- —
- Monthly cashflow
- —
- DSCR
- —
- Eligible?
- —
No personal income docs; deal must DSCR.
Hard money
10% down · 12.0% · 12mo
- Down + closing
- —
- Monthly P&I
- —
- Monthly cashflow
- —
- DSCR
- —
- Eligible?
- —
Short-term bridge; refi at stabilization.
Rent comps 3 comps
| Address | Beds | Baths | Sqft | Rent | $/sqft | DOM | Units | Dist |
|---|---|---|---|---|---|---|---|---|
| 2800 Gemini St Unit GE2800 Saginaw, MI | 3.0 | 2.0 | 960 | $920 | $0.96 | 43d | 1 | 0.91mi |
| 2564 Apollo Dr Unit AP2564 Saginaw, MI | 3.0 | 2.0 | 960 | $883 | $0.92 | 43d | 1 | 1.13mi |
| 2554 Apollo Dr Unit AP2554 Saginaw, MI | 3.0 | 2.0 | 960 | $883 | $0.92 | 43d | 1 | 1.15mi |
Listing history 23 events
-
2026-06-18days on market $77,400 Active 27 DOM
-
2026-06-17days on market $77,400 Active 26 DOM
-
2026-06-16days on market $77,400 Active 25 DOM
-
2026-06-15days on market $77,400 Active 24 DOM
-
2026-06-13days on market $77,400 Active 22 DOM
-
2026-06-12days on market $77,400 Active 21 DOM
-
2026-06-09days on market $77,400 Active 18 DOM
-
2026-06-08days on market $77,400 Active 17 DOM
-
2026-06-07days on market $77,400 Active 16 DOM
-
2026-06-07days on market $77,400 Active 15 DOM
-
2026-06-04pricedays on market $77,400 Active 12 DOM
-
2026-06-02days on market $79,900 Active 11 DOM
-
2026-06-01days on market $79,900 Active 10 DOM
-
2026-05-31days on market $79,900 Active 9 DOM
-
2026-05-31days on market $79,900 Active 8 DOM
-
2026-05-18historical
-
2026-05-04price $84,900
-
2026-05-04price $84,900
-
2026-04-17price $87,400
-
2026-04-17price $87,400
-
2026-04-02$89,900 Active
-
2026-04-02$89,900 Active
-
2011-10-21soldstatus $1,400
ⓘ Source: listings_history table (triggers on properties + properties_extension) + one-shot
backfill from property_details.listing_events for pre-trigger history.
Tax reassessment forecast MI · Partial reset (capped growth)
- Current annual tax
- $247 · $21/mo
- Projected year-2 tax
- $719 · $60/mo
- Expected delta
- +$473/yr (+$39/mo · 191.5%)
ⓘ Screening estimate from a state-policy table — verify with the county assessor before closing.
Climate risk First Street
- Flood 1/10 Low FEMA zone X (unshaded) · 0% chance over 30 yrs
- Wildfire 1/10 Low
- Heat 2/10 Low 7 d/yr ≥98°F today · 14 d/yr by 30 yrs out
- Wind 1/10 Low
- Air quality 2/10 Low 1 unhealthy d/yr today · 2 by 30 yrs out
Nearby sold comps map
Loading sold comps map…
Walkable amenities ~0.75 mi
Loading nearby amenities…
Taxation est. · year 1
- Rental income
- $10,767
- − Mortgage interest
- −$4,336
- − Property taxes
- −$247
- − Insurance
- −$387
- − Repairs & maintenance
- −$861
- − Management
- −$861
- − Depreciation
- −$2,252
- Taxable income
- $1,824
- Est. tax owed @ 24.0%
- −$438
- After-tax cash flow
- $2,564/yr
For passive investors: Depreciation is non-cash, so a rental often shows a tax loss while cash-flowing — sheltering income. Rental losses are passive: they offset passive income freely, and up to $25,000/yr can offset ordinary (W-2) income if you actively participate and your MAGI is under $100k (phasing out to $0 by $150k); unused losses carry forward. On sale, claimed depreciation is recaptured at up to 25%, and gains may owe capital-gains tax (a 1031 exchange can defer both). Figures are a year-1 estimate at your 24.0% rate — not tax advice; consult a CPA.
Schools (NCES district)
- District
- Bridgeport-Spaulding Community School District
- NCES district ID
- 2606780
- Math proficiency
- 7% ▼ -4.00%
- Reading proficiency
- 17% ▼ -5.00%
- Median HH income
- $38,403
- Composite
- 10.13/100
- National rank
- #9800
- State rank
- #513 of 540 in MI
Livability — Buena Vista
- Score
- 59/100
- State rank
- #615
- US rank
- #20603
Category grades
Schools grade is shown separately in the Schools card above.
Census & demographics
- Census place
- Buena Vista, MI
- City population
- 32,069
- Population (ZIP)
- 32,069
Population outlook (Saginaw County) Hauer SSP2
- Today (2025)
- 180,568 people
- By 2030
- 172,302 · -4.6%
- By 2040
- 153,919 · -14.8%
- By 2050
- 135,519 · -24.9%
- By 2075
- 97,199 · -46.2%
- By 2100
- 65,037 · -64.0%
Race, ethnicity, and origin ACS 2023
- Neighborhood character
- Diverse neighborhood (Simpson 0.56)
- Race & ethnicity
- Black 59% White 27% Hispanic / Latino 12% Two or more races 5%
- Hispanic origin (detail)
- Mexican 10%
- Common ancestry
- Romanian 2% Lithuanian 2%
- Foreign-born
- 1% · Canada
- Languages at home
- 96% English-only · Spanish 4%
Political lean MEDSL · Saginaw
- 2024 margin
- Toss-up / Even · D 47.7% · R 51.0% · Other 1.4%
- 2008→2024 swing
- -20.6pp toward R · 2008: 17.3pp · 2024: -3.3pp
- All cycles
- 2024: R+3.3 2020: D+0.3 2016: R+1.1 2012: D+11.9 2008: D+17.3
Not yet ingested
- Civics
- —
Market trends
- HPI YoY
- ▼ -93.46%
- Current HPI
- 197.3359
- Rent YoY
- —
- Metro
- —
- State GDP YoY
- ▲ 1.37%
- F500 in state
- 28
Industry mix (Fortune 500 HQ in MI)
| Industry | F500 HQs | Revenue |
|---|---|---|
| Automotive Parts | 3 | $48B |
|
||
| Automotive | 2 | $372B |
|
||
| Chemicals | 1 | $45B |
|
||
| Automotive Retail | 1 | $29B |
|
||
| Healthcare / Medical Devices | 1 | $23B |
|
||
| Automotive Technology | 1 | $20B |
|
||
Price history
+5428.6% since first listed14 events — show timeline
- 2026-06-03 Price Changed $77,400 MiRealSource-MiMLS
- 2026-06-03 Price Changed $77,400 REALCOMP
- 2026-05-28 Price Changed $79,900 MiRealSource-MiMLS
- 2026-05-27 Price Changed $79,900 REALCOMP
- 2026-05-22 Listed $83,900 REALCOMP
- 2026-05-22 Listed $83,900 MiRealSource-MiMLS
- 2026-05-18 Listing Removed — MiRealSource-MiMLS
- 2026-05-04 Price Changed $84,900 MiRealSource-MiMLS
- 2026-05-04 Price Changed $84,900 REALCOMP
- 2026-04-17 Price Changed $87,400 MiRealSource-MiMLS
- 2026-04-17 Price Changed $87,400 REALCOMP
- 2026-04-02 Listed $89,900 MiRealSource-MiMLS
- 2026-04-02 Listed $89,900 REALCOMP
- 2011-10-21 Sold (Public Records) $1,400 Public Records
Property tax history
-12.1%/yrLatest (2025): $247 · -78.3% YoY. Source: county tax records.
Cash-flow waterfall
monthlySold comps — $/sqft
last 12 mo · ≤1 miLoading sold comps…